sas certification Archives - Page 2 of 4 - DexLab Analytics | Big Data Hadoop SAS R Analytics Predictive Modeling & Excel VBA

Digital Transformation: Data Scientists Are a Must Now for Enterprises

Data explosion, sprawling around Facebook and Internet of Things need to be nipped now to make sense what’s in there. Data is filled with promises, it offers new significant insights culled from the patterns in the data to just not report what happened but predict future scenarios.

Digital Transformation: Data Scientists Are a Must Now for Enterprises

This has led organizations to hire data scientists who are adept with the expertise and experience to shed some light on the mysteries of NoSQL data lakes and data bases, in which data is hoarded. For best SAS analytics training in Gurgaon, look up to DexLab Analytics – their SAS certification in Delhi is nifty and student-friendly.

Continue reading “Digital Transformation: Data Scientists Are a Must Now for Enterprises”

How to Create a Self-similar Christmas Tree Using SAS

The season of celebration is here! Christmas is just around the corner. And here is a beautiful self-similar Christmas tree that was created using SAS with the help of two fascinating features – matrix computations and ODS statistical graphics.

How to Create a Self-similar Christmas Tree Using SAS

Experiencing self-similarity in Kronecker products

You might have come across blogposts highlighting how repeated Kronecker product of a binary matrix ushers us into self-similar structures. But this time, we are taking special care in introducing self-similarity in Kronecker products – like, if M is a binary matrix then Kronecker product happens to be M@M, which is a block matrix in which each 1 inside the original matrix is replaced by a copy of M, and each O is replaced with a zero block. In this blog, @ stands for the Kronecker product (or direct product) operator implemented in IML/SAS software). Continue reading “How to Create a Self-similar Christmas Tree Using SAS”

Researchers Peer into the Hood of Computational Linguistics

Researchers Peer into the Hood of Computational Linguistics


To start, give a look at these two sentences:

“This house is in a detestable location.”

“This detestable house is in this location.”


Well, these two sentences have virtually similar words, but owing to their structure, they exude entirely two different meanings. Understanding the true meaning of the sentences just by having a look at the words was something only reserved for the human intelligence, until now. Breakthroughs in Natural Language Processing (NLP), also known as computational linguistics have blazed a trail in this domain, which was once dominated by humans.

Continue reading “Researchers Peer into the Hood of Computational Linguistics”

Wake Up to a World of Data Possibilities: With SAS Certification

Of late, in spite of trending insurgence of cutting edge technology tools, SAS remains one of the most popular, in-demand programming languages for advanced analytics. It’s been more than two decades, yet it didn’t lose its importance in ruling the data science market. This shows how flexible this pioneering analytics tool is, and how adaptable it is in its functionality that it stood strong through the test of time and development.

 
Wake Up to a World of Data Possibilities: With SAS Certification

Possess the Right SAS Skills, Be In Demand

Organizations are utilizing the perks of advanced analytics inside out. They are realizing that not only big data analytics has secured a niche area of concentration for itself, but it has strived to be an indispensable part of any organization that is on its walk to success.

Continue reading “Wake Up to a World of Data Possibilities: With SAS Certification”

Interactive Data Discovery and Predictive Analytics: Extract Useful Knowledge from Data

Impressive predictive analytics coupled with interactive data discovery technology enable rational SAS analysts to distinguish pertinent trends and interactions in datasets, and pan out questions from all dimensions. This smashing concoction of technologies also allows business users to exchange ideas with pundits, to create, modify and pick the best predictive models, constructively.


Interactive-Data-Discovery-and-Predictive-Analytics-Extract-Useful-Knowledge-from-Data


A comprehensive SAS solution might be the key to empower users in taking better business decisions, without wasting much time. This kind of interactive solution must involve ceaseless communication, giving enough room to even non-technical users to explore data visually, develop analytic models, and share fruitful results.  

Continue reading “Interactive Data Discovery and Predictive Analytics: Extract Useful Knowledge from Data”

Here’s why SAS Analytics Is a Must-Have IT Skill to Possess

Here’s why SAS Analytics Is a Must-Have IT Skill to Possess

Without the great Analytical surge, everything was looking fit and fine. The economy was performing well. The IT industry was looking stable. The tech honchos were playing fine. And then IT happened! Data Analytics snatched the dazzling limelight all to itself.

It’s true once in a while, our market needs a good shaking, or else things tend to get sluggish and slow. Over time, the industries start decreasing in efficiency and business houses crumples. Therefore, the change induced by Big Data Analytics is one for good: it started pulling back the market to its former position. From medical science to military to security, the reach of Big Data Analytics can be witnessed everywhere.

The evolution of analytics is largely consistent and covers a wide span of industries. It’s not like it suddenly came into a lot of focus, its advancement was slow and steady. Now, it has strived to become extremely important to store, interpret, analyze and develop crucial insights – social media is deriving maximum benefits out of analytics, while customizing their products to make more money from advertisements. On the other hand, the service-oriented companies love to manipulate data that is generated through myriad social channels to trigger customer base.

The ABC of Summary Statistics and T Tests in SAS – @Dexlabanalytics.

Today, SAS certifications are extremely rewarding and scores high for both employee and employer. Analytics is a big word, encompassing a whole array of job roles, such as Forecaster, Market Researcher, Data Miner, Operations Researcher and Statistical Analyst – so when are you choosing this career gateway for a better future! DexLab Analytics is here with its state-of-the-art SAS training courses, help yourself.

6

3 key benefits of becoming SAS analytics professional:

Increase marketability and reach

SAS Analytics professionals possess higher marketability skills and enjoy a certain edge over competitors. Their job is to deliver nothing but the best, and they are very focused in doing that, leaving no scope for complaints.

Expand credibility for being the right technical professionals

As the SAS certified professionals have a thorough know-how about using SAS Software the employers stay relaxed and trusts their predicaments, hence, enhancing their credibility quotient.

Enhance skill and expertise in SAS area of specialization

No doubt, SAS Analytics professionals are extremely good in their field of work. Owing to their professional nature they tend to attract more lucrative job opportunities.

Data Preparation using SAS – @Dexlabanalytics.

Apart from SAS, R programming is rapidly gaining popularity. Small and large companies have realized the growing the importance of these two tools. SAS combined with R language training in Delhi opens a whole gamut of striking opportunities. Having said that, companies that have stayed traditional, through its very core, have now embraced SAS and R skills, and for the right reasons.

At DexLab Analytics, we increasingly focus on making students totally data-ready. Opt for R programming certification, and give new data-hungry souls the drive to enter the world of analytics. After all, to excel in the analytics career and sail high you need to be well-equipped with SAS and R – they are the tools of combat for the future IT domain.!


Interested in a career in Data Analyst?

To learn more about Data Analyst with Advanced excel course – Enrol Now.
To learn more about Data Analyst with R Course – Enrol Now.
To learn more about Big Data Course – Enrol Now.

To learn more about Machine Learning Using Python and Spark – Enrol Now.
To learn more about Data Analyst with SAS Course – Enrol Now.
To learn more about Data Analyst with Apache Spark Course – Enrol Now.
To learn more about Data Analyst with Market Risk Analytics and Modelling Course – Enrol Now.

How Data Preparation Changed Post Predictive Analytics Model Implementation

Data scientists assembling predictive models and formulating machine learning algorithms need to spare more time on data preparation work upfront than is required in traditional analytics applications.

How Data Preparation Changed Post Predictive Analytics Model Implementation

In today’s business sphere, the drive to structure big data architectures that would stand on predictive analytics models, data mining and machine learning applications is fast modifying the pattern of the data pipeline, along with the data preparation steps necessary to fuel it.

Continue reading “How Data Preparation Changed Post Predictive Analytics Model Implementation”

INTCK and INTNX: All about SAS Dates and Computing Intervals between Dates

INTCK-and-INTNX

The INTCK and INTNX functions in SAS helps you compute the time between events. This technical blog is based on the timeline of living US presidents, sourced from a Wikipedia table. The table data shows the number of years and days between events.

So, let’s start.
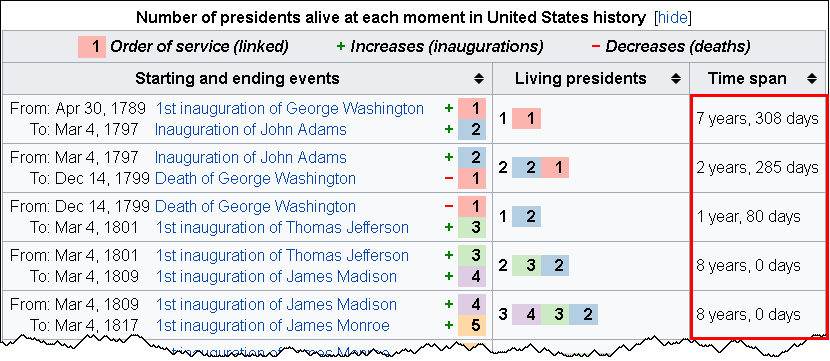
LivingPresidents2

Gaps between dates

To calculate the interval between two dates, you can use these two SAS functions:

The INTCK function returns the number of time units between dates. The time unit can be selected in years, months, weeks, days, or whatever you feel like.

The INTNX function helps you compute the date that is 308 days away in the future from a specific date. This was just an example to help you understand what it means. The INTNX function returns a SAS date that is particular number of time units away from a particular date.

These two functions share a complimentary bond: where one calculates the difference between two dates, the other entitles you to add time units to a specified date value. Also, the INT part in both the functions denotes INTervals, and the terms INTCK and INTNX means Interval Check and Interval Next, respectively.

DexLab Analytics offers intensive SAS certification courses for candidates..

How to calculate anniversary dates

These two prime functions tend to be useful in counting the number of anniversaries between two dates along with calculating a future anniversary date. Use the ‘CONTINUOUS’ option for the INTCK function and the ‘SAME’ option for the INTNX function in the following manner:

The ‘CONTINUOUS’ option in the INTCK function helps you count the number of anniversaries of one date that occur before a second date. For example, the statement

Years = intck('year', '30APR1789'd, '04MAR1797'd, 'continuous');

returns the value 7 because there are 7 full years (anniversaries of 30APR) between those two dates. Without the ‘CONTINUOUS’ option, the function returns 8 as 01JAN occurs 8 times between those dates.

The statement

Anniv = intnx('year', '30APR1789'd, 7, 'same');

returns the 7th anniversary of the date 30APR1789. In some ways, it returns the date value for 30APR1796.

The most exciting part about these two functions is that they automatically handle leap years! Yes, you read that right. If you ask for the number of days within two dates, the INTCK function will show leap days in the result. If an event takes place on a leap day, and you ask the INTNX function to reveal the anniversary date, it will report 28FEB of the next year to the next anniversary date.

An algorithm calculating years and days between events

Go through the following algorithm to calculate the number of years and days between dates in SAS:

  • Use the INTCK function with the ‘CONTINUOUS’ option to calculate the number of completed years between two dates
  • Use the INTNX function to discover a third date, i.e. anniversary date, which is the same month and day like the start date, but takes place less than a year before the end date.
  • Use the INTCK function to ascertain the number of days occurring between the anniversary date and the end date.

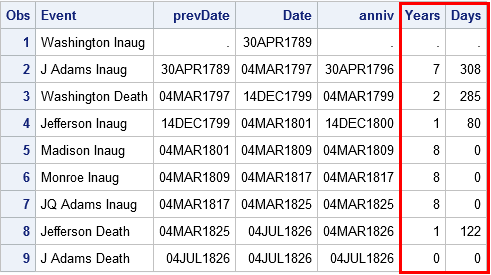
Here are the data steps that enable you to compute the time interval in years and days between the first few US presidential inaugurations and deaths.

data YearDays;
format Date prevDate anniv Date9.;
input @1  Date anydtdte12.
      @13 Event $26.;
prevDate = lag(Date);
if _N_=1 then do;                               /* when _N_=1, lag(Date)=. */
   Years=.; Days=.; return;            /* set years & days, go to next obs */
end;
Years = intck('year', prevDate, Date, 'continuous'); /* num complete years */
Anniv = intnx('year', prevDate, Years, 'same');      /* most recent anniv  */
Days = intck('day', anniv, Date);                    /* days since anniv   */
datalines;
Apr 30, 1789 Washington Inaug
Mar 4, 1797  J Adams Inaug
Dec 14, 1799 Washington Death
Mar 4, 1801  Jefferson Inaug
Mar 4, 1809  Madison Inaug
Mar 4, 1817  Monroe Inaug
Mar 4, 1825  JQ Adams Inaug
Jul 4, 1826  Jefferson Death
Jul 4, 1826  J Adams Death
run;
 
proc print data=YearDays;
var Event prevDate Date Anniv Years Days;
run;


LivingPresidents3


In a nutshell, the INTCK and INTNX functions are consequential for calculating intervals between dates. In this blog, I discussed about two-less-popular options inn SAS, for more such SAS training related blogs, follow us at DexLab Analytics.

Data Science Machine Learning Certification

This post originally appeared onblogs.sas.com/content/iml/2017/05/15/intck-intnx-intervals-sas.html
 

Interested in a career in Data Analyst?

To learn more about Machine Learning Using Python and Spark – click here.
To learn more about Data Analyst with Advanced excel course – click here.
To learn more about Data Analyst with SAS Course – click here.
To learn more about Data Analyst with R Course – click here.
To learn more about Big Data Course – click here.
The ABC of Summary Statistics and T Tests in SAS

The ABC of Summary Statistics and T Tests in SAS

Getting introduced to statistics for SAS training? Then, you must know how to create summary statistics (such as sample size, mean, and standard deviation) to test hypotheses and to figure confidence intervals. In this blog, we will show you how to furnish summary statistics (instead of raw data) to PROC TTEST in SAS, how to develop a data set that includes summary statistics and how to run PROC TTEST to calculate a two-sample or one-sample t test for the mean.

So, let’s start!

2

Running a two-sample t test for difference of means from summarized statistics

Instead of going the clichéd way, we will start with establishing a comparison between the mean heights of 19 students, based on gender – the data is held in the Sashelp class data set.

Observe the below SAS statements that sorts the data by the grouping variable, calling PROC MEANS and printing a subset of the statistics:

proc sort data=sashelp.class out=class; 
   by sex;                                /* sort by group variable */
run;
proc means data=class noprint;           /* compute summary statistics by group */
   by sex;                               /* group variable */
   var height;                           /* analysis variable */
   output out=SummaryStats;              /* write statistics to data set */
run;
proc print data=SummaryStats label noobs; 
   where _STAT_ in ("N", "MEAN", "STD");
   var Sex _STAT_ Height;
run;

summarystats1

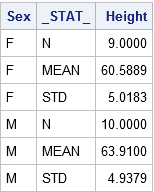
The table reflects the structure of the Summary Stats set for two sample tests. The two samples used here are differentiated on the levels of the Sex Variable (‘F’ for females and ‘M’ for males). The _STAT_ column shows the name of the statistic implemented here. The Height column depicts the value of the statistics for individual group.

Get SAS certification Delhi from DexLab Analytics today!

The problem: The heights of sixth-grade students are normally distributed. Random samples of n1=9 females and n2=10 males are selected. The mean height of the female sample is m1=60.5889 with a standard deviation of s1=5.0183. The mean height of the male sample is m2=63.9100 with a standard deviation of s2=4.9379. Is there evidence that the mean height of sixth-grade students depends on gender?

Here, you have to do nothing special to get the PROC TTEST – whenever the procedure gets the sight of the respective variable _STAT_ and any unique values, the procedure understands that the data set comprises summarized statistics. The following representation compares the mean heights of males and females:

proc ttest data=SummaryStats order=data
           alpha=0.05 test=diff sides=2; /* two-sided test of diff between group means */
   class sex;
   var height;
run;

summarystats1

Check the confidence intervals for the standard deviations and also that the output includes 95% confidence intervals for group means.

In the second table, the ‘Pooled’ row radiates out the impression that both the variances of two groups are more or less equal, which is somewhat true even. The value of the t statistic is t = -1.45 with a two-sided p-value of 0.1645.

The syntax for the PROC TTEST statement allows you to change the type of hypothesis test and the significance level. To support this, you can now run a one-sided test for the alternative hypothesis μ1 < μ2 at the 0.10 significance level just by using:

proc ttest ... alpha=0.10 test=diff sides=L;  /* Left-tailed test */

Running a one-sample t test of the mean from summarized statistics

In the above section, you have learnt to create the summary statistics from PROC MEANS. Nevertheless, you can also generate the summary statistic manually, if you lack original data.

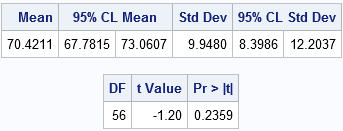
The problem: A research study measured the pulse rates of 57 college men and found a mean pulse rate of 70.4211 beats per minute with a standard deviation of 9.9480 beats per minute. Researchers want to know if the mean pulse rate for all college men is different from the current standard of 72 beats per minute.

The following statements jots down the summary statistics for a data set, asks PROC TTEST to perform a one-sample test of the null hypothesis μ = 72 against a two-sided alternative hypothesis:

data SummaryStats;
  infile datalines dsd truncover;
  input _STAT_:$8. X;
datalines;
N, 57
MEAN, 70.4211
STD, 9.9480
;
 
proc ttest data=SummaryStats alpha=0.05 H0=72 sides=2; /* H0: mu=72 vs two-sided alternative */
   var X;
run;

summarystats3 (2)

The outcome is a 95% confidence interval for the mean containing a value 72. The value of the t statistic is t = -1.20, which corresponds to a p-value of 0.2359. Therefore, the data fails in rejecting the null hypothesis at the 0.05 significance level.

For more informative blogs and news about SAS course, drop by our prime SAS predictive modeling training institute DexLab Analytics.

 
This post originally appeared onblogs.sas.com/content/iml/2017/07/03/summary-statistics-t-tests-sas.html
 

Interested in a career in Data Analyst?

To learn more about Data Analyst with Advanced excel course – Enrol Now.
To learn more about Data Analyst with R Course – Enrol Now.
To learn more about Big Data Course – Enrol Now.

To learn more about Machine Learning Using Python and Spark – Enrol Now.
To learn more about Data Analyst with SAS Course – Enrol Now.
To learn more about Data Analyst with Apache Spark Course – Enrol Now.
To learn more about Data Analyst with Market Risk Analytics and Modelling Course – Enrol Now.

Call us to know more