SAS Archives - DexLab Analytics | Big Data Hadoop SAS R Analytics Predictive Modeling & Excel VBA

The Nitty-Gritty When It Comes to SAS 101

The Nitty-Gritty When It Comes to SAS 101

SAS is a state-of-the-art business intelligence tool that is primarily designed to facilitate reporting, data analysis, mining and predictive modeling using convincing visualization and interactive dashboards. Being a powerful programming language, SAS performs complex statistical data analysis; unlike other built-in tools, like Microsoft Excel, SAS lets users to salvage and run data from a plethora of sources, along with ensuring enough control and freedom during data manipulation and compilation.

Statistical Analysis System (SAS) was introduced for organizations to explore their vast datasets in a highly interactive format. Today, SAS is largely used in machine learning, data science and business intelligence applications. Not only does it arms the organizations with the necessary tools and techniques to monitor key BI metrics, but also develops incredible insights and comprehensive reports, facilitating informed decision-making procedures.

2

SAS Fuelling Career Growth

Business analytics and incredible BI tools have become central for running medium and large-scale enterprises across the globe, efficiently. With data becoming increasingly instrumental in pushing businesses to horizons of success, a majority of organizations is betting on SAS BI analytics.

As a result, the demand for SAS consultants is surging at an accelerating rate. Since more and more companies are adopting SAS analytics and altering the ways they used to work, SAS-related jobs are flooding the market. Handsome pay-packages are being offered to the right candidates, skilled and professional.

According to a recent study, the average salary of a diligent SAS programmer is around 10.8 Lacs – organizations are looking for professionals who would not only know how to slice and dice but also know how to draw the right projections and effectively communicate the insights. This is where SAS training Delhi comes in – Head-start a data journey with DexLab Analytics, as it offers the best SAS analytics training Delhi.

Books: For Enhancing the Level of SAS Knowledge

Besides encompassing SAS certification course modules, books tend to take us all a step closer to the bubbling pool of knowledge – SAS books are carefully written, specifically keeping in mind the requirements and focused areas of programmers and analysts.

Without any further ado, let’s dive into a well-curated list of SAS books that’ll help you ace the language like a pro:


  • SAS Essentials: Mastering SAS for Data Analytics by Elliott and Woodward – With an advanced approach, this book is perfect for master’s students of data analysis and programming and higher-level undergraduates.
  • SAS for Dummies by McDaniel and Hemedinger – An absolute beginner’s approach to SAS, this book is widely popular for its simple language, easier representation of facts and easy-to-follow guidelines.
  • The Little SAS Book by Delwiche and Slaughter – Ideal for beginners and experienced SAS consultants, as well, this book includes self-contained lessons, plenty of examples and interesting visuals.
  • SAS Certification Prep Guide – Released by the SAS institute, this is the final and official test-prep guide to be SAS certified.
  • Learning SAS by Examples: A Programmer’s Guide by Ron Cody – If you are a fast learner, this is the one for you. Each chapter in this book ends with test problems so that you are trained SAS-ready.


As final thoughts, SAS analytics is the most powerful tool for performing complex data analysis. Grasping the fundamentals of SAS language will surely present you a big leg up in the analytical domain. For SAS certification courses, drop by DexLab Analytics.


The blog has been sourced from –

https://www.whoishostingthis.com/resources/sas-programming

https://intellipaat.com/blog/what-is-sas-analytics

https://analyticsindiamag.com/analytics-india-salary-study-2017-by-analytixlabs-aim
 

Interested in a career in Data Analyst?

To learn more about Data Analyst with Advanced excel course – Enrol Now.
To learn more about Data Analyst with R Course – Enrol Now.
To learn more about Big Data Course – Enrol Now.

To learn more about Machine Learning Using Python and Spark – Enrol Now.
To learn more about Data Analyst with SAS Course – Enrol Now.
To learn more about Data Analyst with Apache Spark Course – Enrol Now.
To learn more about Data Analyst with Market Risk Analytics and Modelling Course – Enrol Now.

Amalgamating SAS and Trilliant to Manage IoT and Energy Management Issues

With the rise of IoT and advanced systems that connects everything from a city’s surveillance grid to its transportation and utility systems, smart cities are evolving each day. They are being equipped with better street lighting, traffic conditions and utility services – an area that is in central focus is the smart street lighting that keeps its citizens safe and sound. In this regard, Trilliant, a top notch global provider of safe, enterprise wide smart energy communication systems has stepped forward with the analytics scion SAS. They have come together to sign an agreement that empowers data-driven decisions to optimize connected grid devices in the respective systems.

Amalgamating SAS and Trilliant to Manage IoT and Energy Management Issues

According to the agreement, Trilliant and SAS will jointly work to strike off system and interface compatibility, especially the analytics for the Internet of Things (IoT). While Trilliant will provide real-time data from a secure, technologically robust and multi-application networking platform, SAS will seamlessly integrate principal event stream processing for both structured and unstructured data. The latter will also provide machine learning for event detection, distributed energy resource optimization and revenue protection.

Continue reading “Amalgamating SAS and Trilliant to Manage IoT and Energy Management Issues”

The Soaring Importance of SAS in Creating jobs Across Various Industry Domains

In a survey held in 2016, 54 million employees across 350 industries picked out SAS as the most valuable skill to possess. SAS skills still top the list. With predictive analytics gaining speed and accuracy in the world, one just cannot ignore SAS – the oldest and brightest data analytics tool. Though SAS-dominating days are gone, as R and Python has come up ruling the world , 41% of talented data science professionals still prefer SAS as compared to any other languages. The data science market is conquered by R and Python to a great extent, yet you will find a substantial number of clients still putting their bet on SAS predictive modeling.

SAS-Certification-India

To test how SAS certification is taking the job world by storm, open your web-browser and type ‘SAS jobs’ in the search panel – the following results in front of your eyes will give you all your answers. In fact, you’ll be more than surprised to see how many jobs springs up that calls for SAS expertise. A lot of clients and data houses seek SAS certified professionals to take care of the data-induced challenges and the numbers are quite overwhelming!


In total, SAS has around 85000 clients across the globe – owing to which, the demand for SAS should come as no surprise to you.

Benefits of SAS:

  • High Salary
  • Increasing Global Demand
  • Marketability
  • Role-focused
  • Validation of Skills


Besides the benefits enumerated above, SAS certification sizzles with myriad other perks related to data and analytics, and is regarded to be extremely useful in bagging entry-level jobs in data science and analytics. A diligent SAS expert explores the broadening field of SAS ANALYTICS, while streamlining his individual skill and expertise to add credibility to his job profile.


Want to get an instant pay hike? SAS skills may come to your rescue. Once you hone your SAS analytics skill, you can start expecting 6% to 10% pay hike, which further expands, if you add data mining and data modeling skills to in your resume, likewise.


Financial analytics and SAS

To improve the performance of business and act upon the loopholes present in an organization, financial analysts backed by advanced SAS analytics skills pore over a vast amount of company’s financial data. They help you answer all the business related questions and predict the future of your organization.

Healthcare and SAS

As healthcare pushes boundaries to ace the digital transition, Statistical Analysis Systems (SAS) is bringing all kinds of latest technical updates and modifications across a wide spectrum of care, right from the way healthcare providers perform tests to measuring patient safety and health outcomes. It is playing a pivotal role in tapping a lot of disease states and assessing ways to commercialize treatments.


2

Who specializes in SAS and why?

SAS skill is for experienced professionals. Old timers are its biggest fan, especially those who have more than 15 years of job experience. For them, nothing suits better than this miracle tool for data analysis.

However, the tides of time is changing, the current pool of students is somewhat showing keen interest in this field of study for quite some time now. But it takes a real effort of time and practice both to excel in this highly advanced software.


Drop by DexLab Analytics to avail SAS online training. The course here is designed and delivered by industry experts with crisp content and student-friendly learning techniques. Visit their website today!


Interested in a career in Data Analyst?

To learn more about Machine Learning Using Python and Spark – click here.

To learn more about Data Analyst with Advanced excel course – click here.
To learn more about Data Analyst with SAS Course – click here.
To learn more about Data Analyst with R Course – click here.
To learn more about Big Data Course – click here.

Here’s why SAS Analytics Is a Must-Have IT Skill to Possess

Here’s why SAS Analytics Is a Must-Have IT Skill to Possess

Without the great Analytical surge, everything was looking fit and fine. The economy was performing well. The IT industry was looking stable. The tech honchos were playing fine. And then IT happened! Data Analytics snatched the dazzling limelight all to itself.

It’s true once in a while, our market needs a good shaking, or else things tend to get sluggish and slow. Over time, the industries start decreasing in efficiency and business houses crumples. Therefore, the change induced by Big Data Analytics is one for good: it started pulling back the market to its former position. From medical science to military to security, the reach of Big Data Analytics can be witnessed everywhere.

The evolution of analytics is largely consistent and covers a wide span of industries. It’s not like it suddenly came into a lot of focus, its advancement was slow and steady. Now, it has strived to become extremely important to store, interpret, analyze and develop crucial insights – social media is deriving maximum benefits out of analytics, while customizing their products to make more money from advertisements. On the other hand, the service-oriented companies love to manipulate data that is generated through myriad social channels to trigger customer base.

The ABC of Summary Statistics and T Tests in SAS – @Dexlabanalytics.

Today, SAS certifications are extremely rewarding and scores high for both employee and employer. Analytics is a big word, encompassing a whole array of job roles, such as Forecaster, Market Researcher, Data Miner, Operations Researcher and Statistical Analyst – so when are you choosing this career gateway for a better future! DexLab Analytics is here with its state-of-the-art SAS training courses, help yourself.

6

3 key benefits of becoming SAS analytics professional:

Increase marketability and reach

SAS Analytics professionals possess higher marketability skills and enjoy a certain edge over competitors. Their job is to deliver nothing but the best, and they are very focused in doing that, leaving no scope for complaints.

Expand credibility for being the right technical professionals

As the SAS certified professionals have a thorough know-how about using SAS Software the employers stay relaxed and trusts their predicaments, hence, enhancing their credibility quotient.

Enhance skill and expertise in SAS area of specialization

No doubt, SAS Analytics professionals are extremely good in their field of work. Owing to their professional nature they tend to attract more lucrative job opportunities.

Data Preparation using SAS – @Dexlabanalytics.

Apart from SAS, R programming is rapidly gaining popularity. Small and large companies have realized the growing the importance of these two tools. SAS combined with R language training in Delhi opens a whole gamut of striking opportunities. Having said that, companies that have stayed traditional, through its very core, have now embraced SAS and R skills, and for the right reasons.

At DexLab Analytics, we increasingly focus on making students totally data-ready. Opt for R programming certification, and give new data-hungry souls the drive to enter the world of analytics. After all, to excel in the analytics career and sail high you need to be well-equipped with SAS and R – they are the tools of combat for the future IT domain.!


Interested in a career in Data Analyst?

To learn more about Data Analyst with Advanced excel course – Enrol Now.
To learn more about Data Analyst with R Course – Enrol Now.
To learn more about Big Data Course – Enrol Now.

To learn more about Machine Learning Using Python and Spark – Enrol Now.
To learn more about Data Analyst with SAS Course – Enrol Now.
To learn more about Data Analyst with Apache Spark Course – Enrol Now.
To learn more about Data Analyst with Market Risk Analytics and Modelling Course – Enrol Now.
INTCK and INTNX: All about SAS Dates and Computing Intervals between Dates

INTCK-and-INTNX

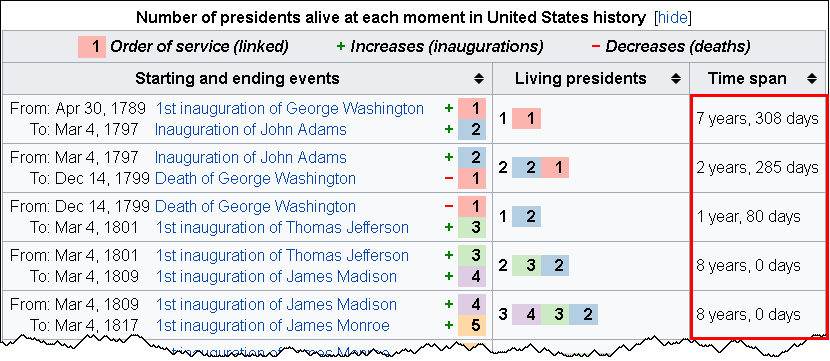
The INTCK and INTNX functions in SAS helps you compute the time between events. This technical blog is based on the timeline of living US presidents, sourced from a Wikipedia table. The table data shows the number of years and days between events.

So, let’s start.

LivingPresidents2

Gaps between dates

To calculate the interval between two dates, you can use these two SAS functions:

The INTCK function returns the number of time units between dates. The time unit can be selected in years, months, weeks, days, or whatever you feel like.

The INTNX function helps you compute the date that is 308 days away in the future from a specific date. This was just an example to help you understand what it means. The INTNX function returns a SAS date that is particular number of time units away from a particular date.

These two functions share a complimentary bond: where one calculates the difference between two dates, the other entitles you to add time units to a specified date value. Also, the INT part in both the functions denotes INTervals, and the terms INTCK and INTNX means Interval Check and Interval Next, respectively.

DexLab Analytics offers intensive SAS certification courses for candidates..

How to calculate anniversary dates

These two prime functions tend to be useful in counting the number of anniversaries between two dates along with calculating a future anniversary date. Use the ‘CONTINUOUS’ option for the INTCK function and the ‘SAME’ option for the INTNX function in the following manner:

The ‘CONTINUOUS’ option in the INTCK function helps you count the number of anniversaries of one date that occur before a second date. For example, the statement

Years = intck('year', '30APR1789'd, '04MAR1797'd, 'continuous');

returns the value 7 because there are 7 full years (anniversaries of 30APR) between those two dates. Without the ‘CONTINUOUS’ option, the function returns 8 as 01JAN occurs 8 times between those dates.

The statement

Anniv = intnx('year', '30APR1789'd, 7, 'same');

returns the 7th anniversary of the date 30APR1789. In some ways, it returns the date value for 30APR1796.

The most exciting part about these two functions is that they automatically handle leap years! Yes, you read that right. If you ask for the number of days within two dates, the INTCK function will show leap days in the result. If an event takes place on a leap day, and you ask the INTNX function to reveal the anniversary date, it will report 28FEB of the next year to the next anniversary date.

An algorithm calculating years and days between events

Go through the following algorithm to calculate the number of years and days between dates in SAS:

  • Use the INTCK function with the ‘CONTINUOUS’ option to calculate the number of completed years between two dates
  • Use the INTNX function to discover a third date, i.e. anniversary date, which is the same month and day like the start date, but takes place less than a year before the end date.
  • Use the INTCK function to ascertain the number of days occurring between the anniversary date and the end date.

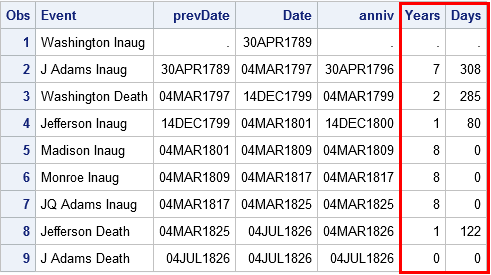
Here are the data steps that enable you to compute the time interval in years and days between the first few US presidential inaugurations and deaths.

data YearDays;
format Date prevDate anniv Date9.;
input @1  Date anydtdte12.
      @13 Event $26.;
prevDate = lag(Date);
if _N_=1 then do;                               /* when _N_=1, lag(Date)=. */
   Years=.; Days=.; return;            /* set years & days, go to next obs */
end;
Years = intck('year', prevDate, Date, 'continuous'); /* num complete years */
Anniv = intnx('year', prevDate, Years, 'same');      /* most recent anniv  */
Days = intck('day', anniv, Date);                    /* days since anniv   */
datalines;
Apr 30, 1789 Washington Inaug
Mar 4, 1797  J Adams Inaug
Dec 14, 1799 Washington Death
Mar 4, 1801  Jefferson Inaug
Mar 4, 1809  Madison Inaug
Mar 4, 1817  Monroe Inaug
Mar 4, 1825  JQ Adams Inaug
Jul 4, 1826  Jefferson Death
Jul 4, 1826  J Adams Death
run;
 
proc print data=YearDays;
var Event prevDate Date Anniv Years Days;
run;


LivingPresidents3


In a nutshell, the INTCK and INTNX functions are consequential for calculating intervals between dates. In this blog, I discussed about two-less-popular options inn SAS, for more such SAS training related blogs, follow us at DexLab Analytics.

Data Science Machine Learning Certification

This post originally appeared onblogs.sas.com/content/iml/2017/05/15/intck-intnx-intervals-sas.html
 

Interested in a career in Data Analyst?

To learn more about Machine Learning Using Python and Spark – click here.
To learn more about Data Analyst with Advanced excel course – click here.
To learn more about Data Analyst with SAS Course – click here.
To learn more about Data Analyst with R Course – click here.
To learn more about Big Data Course – click here.

How to Determine the Size of a SAS Data Set

How to Determine the Size of a SAS Data Set

When program codes, applications and SAS data sets are developed, enough attention is often not given to EFFECIENCY, especially during the initial phases of development. Since, data size and system conduct can influence a program or an application’s functioning, SAS users need to access information about a data set’s size and content. To ascertain how much disk space a data set is using, users can easily do a few calculations to learn to access metadata content and attain the important information. Determine, estimate and understand information with this following tip, which helps improve SAS performance and fine-tuning of techniques.

Also read: How to Code Colour Values Within SAS Enterprise Guide


Implementing PROC SQL and DICTIONARY.TABLES

The SAS system accumulates valuable information (also known as metadata) about all-familiar SAS libraries, indexes, data sets (tables), system options, views, catalogs, macros and an assemblage of other “read-only” tables called Dictionary tables and SASHELP views. TABLES, a particular Dictionary table and its SASHELP view equivalent, VTABLE, consists details about a SAS session’s data set. Check the following PROC SQL code as its specification will help us get access to the contents of four columns observed in the TABLES Dictionary table, namely BNAME, MEMNAME, MEMTYPE and FILESIZE to exhibit the size of the CARS data set.

Also read: How to Use PUT and %PUT Statements in SAS: 6 Tips


PROC SQL and Dictionary.TABLES:

PROC SQL ;
  TITLE ‘Filesize for CARS Data Set’ ;
  SELECT LIBNAME,
         MEMNAME,
         FILESIZE FORMAT=SIZEKMG.,
         FILESIZE FORMAT=SIZEK.
    FROM DICTIONARY.TABLES
      WHERE LIBNAME = ‘SASHELP’
        AND MEMNAME = ‘CARS’
        AND MEMTYPE = ‘DATA’ ;
QUIT ;

Results

Size-of-SAS-data-set1

Analysis

The above results show that the CARS data set filesize is 192KB.

Nota bene: If the SIZEKMG.format is mentioned in a format=option, SAS ascertains whether it should apply KB for kilobytes, MB for megabytes or GB for gigabytes, and divide the filesize value with the help of one of the following values:

KB           1024

MB          1048576

GB           1073741824


Using PROC PRINT and SASHELP.VTABLE

In the following example, the provisions of a PROC PRINT are explained to access the constituents of three columns found in the VTABLE SASHELP view, particularly LIBNAME, MEMNAME and FILESIZE to exhibit the size of the CARS data set.

Also read: SAS Still Dominates the Market After Decades of its Inception


PROC PRINT and SASHELP.VTABLE

PROC PRINT DATA=SASHELP.VTABLE NOOBS ;
  VAR LIBNAME MEMNAME FILESIZE ;
  WHERE LIBNAME = ‘SASHELP’
    AND MEMNAME = ‘CARS’ ;
  FORMAT FILESIZE SIZEKMG. ;
  TITLE ‘Filesize for SASHELP.CARS Data Set’ ;
RUN ;

Results

Size-of-SAS-data-set2


Using DATA _NULL_, SASHELP.VEXTFL and CALL SYMPUTX

Lastly, a DATA_NULL_ is depicted to approach the contents of the VEXTFL SASHELP view with a FILENAME statement. An assignment statement is specified to determine the FILESIZE value for the size of the CARS data set. The CALL SYMPUTX left supports and chops off the trailing blanks from the digital FILSESIZE value of 196608.

Also read: Things to judge in SAS training centres


DATA_NULL_and SASHELP.VEXTFL

filename myfile 'C:\Program Files\SAS9.4\SASFoundation\9.4\\CORE\SASHELP\Cars.sas7bdat' ;
DATA _NULL_ ;
  SET SASHELP.VEXTFL (WHERE=(FILEREF=’MYFILE’)) ; 
  /* Calculate the Filesize in MB */
  FILESIZE = FILESIZE / (1024 ** 2) ;
  CALL SYMPUTX (‘FILESIZE’,FILESIZE) ;
RUN ;

Results

Size-of-SAS-data-set3


Learn more about SAS Predictive Modelling by taking up SAS certification courses in Delhi and Gurgaon. DexLab Analytics offers excellent SAS analytics course for data enthusiasts.

 
This post originally appeared onblogs.sas.com/content/sastraining/2017/04/25/determining-the-size-of-a-sas-data-set
 

Interested in a career in Data Analyst?

To learn more about Machine Learning Using Python and Spark – click here.
To learn more about Data Analyst with Advanced excel course – click here.
To learn more about Data Analyst with SAS Course – click here.
To learn more about Data Analyst with R Course – click here.
To learn more about Big Data Course – click here.

How to Use PUT and %PUT Statements in SAS: 6 Tips

The PUT statement in SAS for programmers who have completed a SAS certification in the DATA step and the %PUT macro statements are highly useful statements, which will help to enable you to display the values of variables and macro variables, respectively.


How to Use PUT and %PUT Statements in SAS: 6 Tips


And almost by default the output will appear in the SAS logs. In this article we will share a few tips which will allow you to make use of these statements more efficiently.

Continue reading “How to Use PUT and %PUT Statements in SAS: 6 Tips”

How to Read Data With SAS JSON Libname Engine

To those of you unaware of the developments in the SAS world, JSON is the new XML and the number of users who need to access JSON has really grown in the recent times. This is mainly due to proliferation of REST-based APIs and other web services. A good reason for JSON being so popular is the fact that it is structured data in the format of text. We have been capable of offering simple parsing techniques, which make use of data step and most recently PROC DS2. Now with the SAS 9.4 and Maintenance 4 we now have a built-in libname engine for the JSON XML.


How to read data with SAS JSON libname engine


As a SAS training institute we strive to keep our students updated with the latest developments in the field of data analytics even after they move on. Continue reading “How to Read Data With SAS JSON Libname Engine”

Celebrate Christmas in Data Analyst Style With SAS!

Christmas is just at the end of this week, so we at team DexLab decided to help our dear readers who love some data-wizardry, with some SAS magic! You can choose to flaunt your extra SAS knowledge to your peer groups with the below described SAS program.


Celebrate Christmas in Data Analyst Style With SAS!

We are taking things a tad backwards by trying to, almost idiosyncratically complicate things that are otherwise simple. After all some say, a job of a data analyst is to do so! However, be it stupid or unnecessary this is definitely by far the coolest way to wish Merry Christmas, in data-analyst style.

Continue reading “Celebrate Christmas in Data Analyst Style With SAS!”

Call us to know more