Risk Management in Banking Archives - DexLab Analytics | Big Data Hadoop SAS R Analytics Predictive Modeling & Excel VBA

MongoDB Basics Part-II

In our previous blog we discussed about few of the basic functions of MQL like .find() , .count() , .pretty() etc. and in this blog we will continue to do the same. At the end of the blog there is a quiz for you to solve, feel free to test your knowledge and wisdom you have gained so far.

Given below is the list of functions that can be used for data wrangling:-

  1. updateOne() :- This function is used to change the current value of a field in a single document.

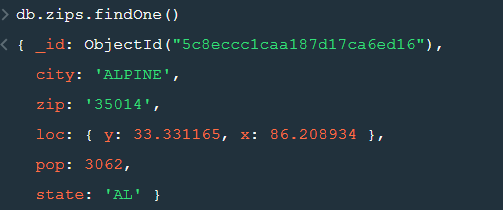
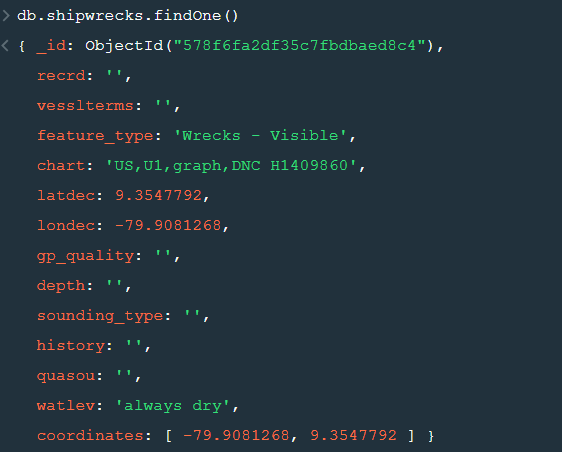
After changing the database to “sample_geospatial” we want to see what the document looks like? So for that we will use .findOne() function.

Now lets update the field value of “recrd” from ‘ ’ to “abc” where the “feature_type” is ‘Wrecks-Visible’.

Now within the .updateOne() funtion any thing in the first part of { } is the condition on the basis of which we want to update the given document and the second part is the changes which we want to make. Here we are saying that set the value as “abc” in the “recrd” field . In case you wanted to increase the value by a certain number ( assuming that the value is integer or float) you can use “$inc” instead.

2. updateMany() :- This function updates many documents at once based on the condition provided.

3. deleteOne() & deleteMany() :- These functions are used to delete one or many documents based on the given condition or field.

4. Logical Operators :-

“$and” : It is used to match all the conditions.

“$or” : It is used to match any of the conditions.

The first code matches both the conditions i.e. name should be “Wetpaint” and “category_code” should be “web”, whereas the second code matches any one of the conditions i.e. either name should be “Wetpaint” or “Facebook”. Try these codes and see the difference by yourself.


So, with that we come to the end of the discussion on the MongoDB Basics. Hopefully it helped you understand the topic, for more information you can also watch the video tutorial attached down this blog. The blog is designed and prepared by Niharika Rai, Analytics Consultant, DexLab Analytics DexLab Analytics offers machine learning courses in Gurgaon. To keep on learning more, follow DexLab Analytics blog.


.

MongoDB Basics Part-I

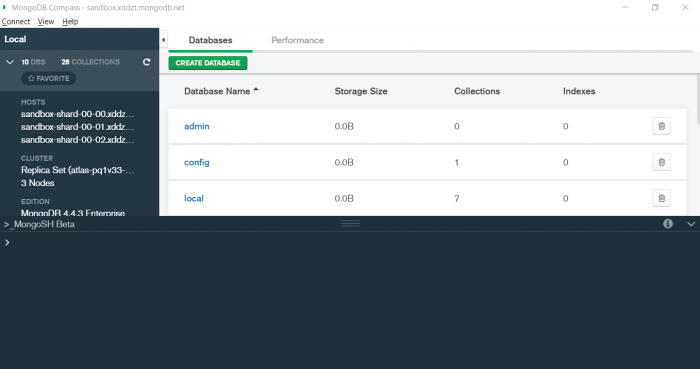
In this particular blog we will discuss about few of the basic functions of MQL (MongoDB Query Language) and we will also see how to use them? We will be using MongoDB Compass shell (MongoSH Beta) which is available in the latest version of MongoDB Compass.

Connect your Atlas cluster to your MongoDB Compass to get started. Latest version of  MongoDB Compass will have this shell, so if you don’t find this shell then please install the latest version for this to work.

Now lets start with the functions.

  1. find() :- You need this function for data extraction in the shell.

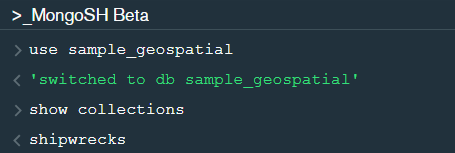
In the shell we need to first write the “use database name”  code to access the database  then use .find() to extract data which has name “Wetpaint”

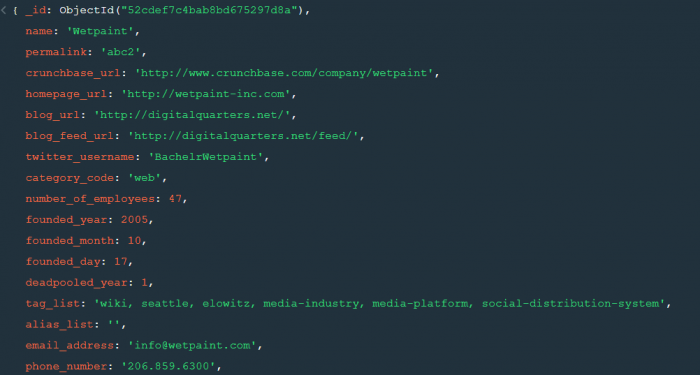
For the above query we get the following result:-


The above result brings us to another function .pretty() .

2. pretty() :- this function helps us see the result more clearly.

Try it yourself to compare the results.

3. count() :- Now lets see how many entries we have by the company name “Wetpaint”.

So we have only one document.

4. Comparison operators :-

“$eq” : Equal to

“$neq”: Not equal to

“$gt”: Greater than

“$gte”: Greater than equal to

“$lt”: Less than

“$lte”: Less than equal to

Lets see how this works.

5. findOne() :- To get a single document from a collection we use this function.


6. insert() :- This is used to insert documents in a collection.

Now lets check if we have been able to insert this document or not.

Notice that a unique id has been added to the document by default. The given id has to be unique or else there will be an error. To provide a user defined  id use “_id”.


So, with that we come to the end of the discussion on the MongoDB. Hopefully it helped you understand the topic, for more information you can also watch the video tutorial attached down this blog. The blog is designed and prepared by Niharika Rai, Analytics Consultant, DexLab Analytics DexLab Analytics offers machine learning courses in Gurgaon. To keep on learning more, follow DexLab Analytics blog.


.
Time Series Analysis Part I


A time series is a sequence of numerical data in which each item is associated with a particular instant in time. Many sets of data appear as time series: a monthly sequence of the quantity of goods shipped from a factory, a weekly series of the number of road accidents, daily rainfall amounts, hourly observations made on the yield of a chemical process, and so on. Examples of time series abound in such fields as economics, business, engineering, the natural sciences (especially geophysics and meteorology), and the social sciences.

  • Univariate time series analysis- When we have a single sequence of data observed over time then it is called univariate time series analysis.
  • Multivariate time series analysis – When we have several sets of data for the same sequence of time periods to observe then it is called multivariate time series analysis.

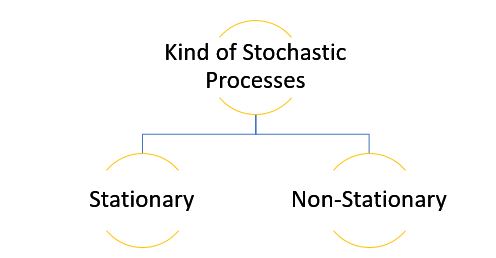
The data used in time series analysis is a random variable (Yt) where t is denoted as time and such a collection of random variables ordered in time is called random or stochastic process.

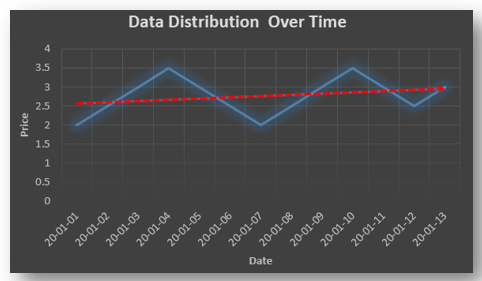
Stationary: A time series is said to be stationary when all the moments of its probability distribution i.e. mean, variance , covariance etc. are invariant over time. It becomes quite easy forecast data in this kind of situation as the hidden patterns are recognizable which make predictions easy.

Non-stationary: A non-stationary time series will have a time varying mean or time varying variance or both, which makes it impossible to generalize the time series over other time periods.

Non stationary processes can further be explained with the help of a term called Random walk models. This term or theory usually is used in stock market which assumes that stock prices are independent of each other over time. Now there are two types of random walks:
Random walk with drift : When the observation that is to be predicted at a time ‘t’ is equal to last period’s value plus a constant or a drift (α) and the residual term (ε). It can be written as
Yt= α + Yt-1 + εt
The equation shows that Yt drifts upwards or downwards depending upon α being positive or negative and the mean and the variance also increases over time.
Random walk without drift: The random walk without a drift model observes that the values to be predicted at time ‘t’ is equal to last past period’s value plus a random shock.
Yt= Yt-1 + εt
Consider that the effect in one unit shock then the process started at some time 0 with a value of Y0
When t=1
Y1= Y0 + ε1
When t=2
Y2= Y1+ ε2= Y0 + ε1+ ε2
In general,
Yt= Y0+∑ εt
In this case as t increases the variance increases indefinitely whereas the mean value of Y is equal to its initial or starting value. Therefore the random walk model without drift is a non-stationary process.

So, with that we come to the end of the discussion on the Time Series. Hopefully it helped you understand time Series, for more information you can also watch the video tutorial attached down this blog. DexLab Analytics offers machine learning courses in delhi. To keep on learning more, follow DexLab Analytics blog.


.
Incredible Future Possibilities of Market Risk Analytics

Global risks are burgeoning; companies of all sizes are seeking the perks of risk analytics and management. Smart companies are realizing the change is coming from people as well as recent technological breakthroughs, including Big Data and AI. And CEOs are improvising their risk teams, and transforming them into perceptive strategic advisors to address budding dangerous threats like cybercrime.

 
Incredible Future Possibilities of Market Risk Analytics
 

Modern risk analysts have accurate knowledge about risk, artificial intelligence and cyber security – so, it’s time they get an opportunity to show a greater presence in the stoic boardrooms as strategic advisors. AI, the cutting-edge risk analytics tool surfaced out to enhance the inexorable march of big data. As such, their importance in the organization in assessing risk has greatly increased.

Continue reading “Incredible Future Possibilities of Market Risk Analytics”

Risk Analytics Market: Serious Growth Rate Projection for 2017-2021

Want to get to the core of understanding risk within various business frameworks? The answer is Risk Analytics. This new breed of data analytics facilitates organizations in precisely defining, recognizing and managing their risk, and its need is going to increase in the coming few years. New developments in risk analytics are gaining limelight and bringing a notable transformation in the market, while enhancing its overall capability.

 
Risk Analytics Market: Serious Growth Rate Projection for 2017-2021
 

Recently, a team of analysts had eureka moment – they introduced a new concept of real-time risk analytics – it is nothing but a modern, more advanced version of traditional risk analytics methods. Here, the prediction is based on real-time data – it processes, examines and determines risk all on a real-time basis – hence top notch financial institutions are putting real-time risk analytics to best use to manage and mitigate associated risks. Several asset management, portfolio management and hedge fund firms, and investment banks are relying on this mode of risk analytics to modify their operating principles to play in accordance with investment and market shifts.

Continue reading “Risk Analytics Market: Serious Growth Rate Projection for 2017-2021”

What the Future Holds for Risk Management in Banking

The past decade saw some impressive changes brought into the aorta of risk management. And the change is showing no signs of slowing down, now.

 
What the Future Holds for Risk Management in Banking
 

In order to keep pace with the changing times, you need to get to the crux of these five trends that are shaping the role of risk management in banking sector: Continue reading “What the Future Holds for Risk Management in Banking”

Call us to know more