R programming using Python Archives - DexLab Analytics | Big Data Hadoop SAS R Analytics Predictive Modeling & Excel VBA

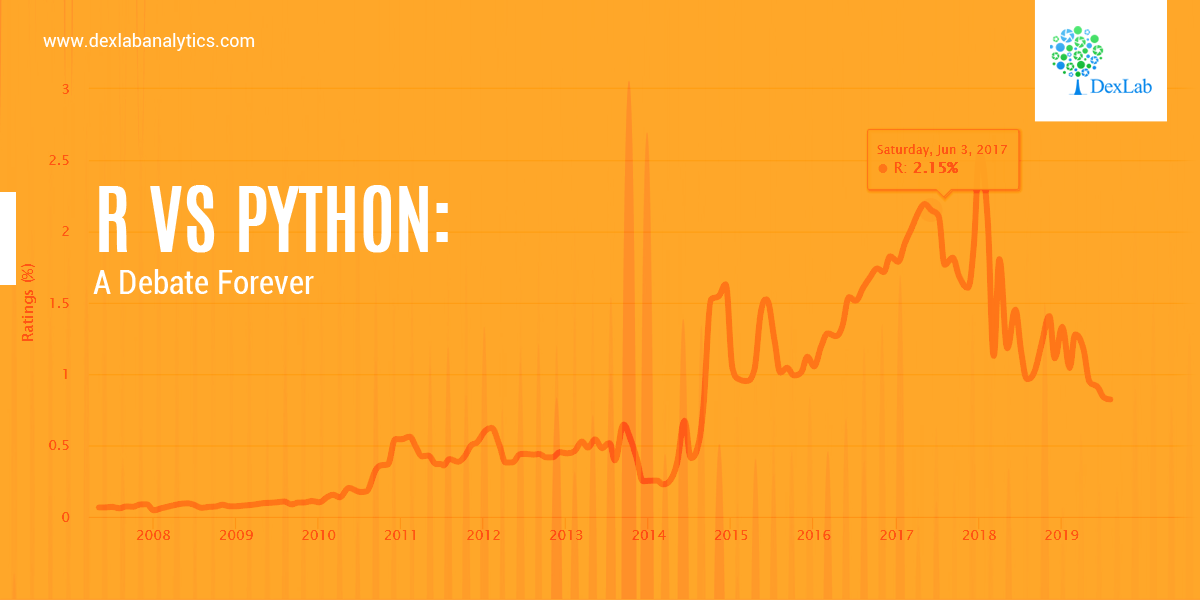
R Vs Python: A Debate Forever

R Vs Python: A Debate Forever

In this blog, we will bring forth the age old question and check which one is better, R programming and Python programming, when it comes to data science?

To be very honest, this question does not have a strict answer to it. However, in this blog we will lay down the key components of both the languages to give you a clearer picture. In the end, please decide for yourself and leave your comments in the section below.

The aim of this blog is to objectively put forward the pros and cons of both languages strictly from the perspective of data science.

We will discuss only about three main components, which are as follows:

  • Syntax
  • Performance
  • Applicability

There are other metrics, such as, trends in Industries and adaptation in the recent years which are beyond the scope of this blog. However, you can safely declare Python as the clear winner if those perspectives were concerned.

So let’s get started:

Syntax

Both R and Python are object-oriented languages. This is to say that everything is created as an object in which the information is mapped with the idea of using that object later in the analysis. However, when it comes to the syntax, i.e., the grammar of programming, R and Python are indeed very different.

R Programming

R programing is more suited to more seasoned coders who have prior experience of coding. The syntax is actually very similar to that of the previous languages, such as C, or C++ or Java and so on. The fundamental rules are that of C programming language. Also, use of semicolons is deemed optional in R. However, semicolons are necessary for multiple lines in a code inside a code block.

Deep Learning and AI using Python

Python

Python on the other hand, is the language more adaptable to the new generation of programmers. You can come from a non-programming background and still learn Python with relative ease.

Python is one of the most user friendly languages for the beginners. The syntax is designed to prioritize readability over preciseness of the code. In layman’s terms – coding in Python is very close to reading and writing with hand. In this regard, it is really popular amongst beginners in Data Science.

Performance

The performance is essentially measured by speed essentially when it comes to programming.

R Programming

As far as the general consensus goes R programming is much slower in terms of speed. The reason behind this is that R programming was initially designed to be used by statisticians for data analysis. Thus, R programming stresses more on precision than the speed.

Python

Python on the other hand, is relatively faster than R. Python offers the same level of precision whilst acting on a faster speed.

Note – The speed is taken into account independent of packages and libraries.

Applicability

Lastly, we will discuss the popular domains in which these languages are used.

2

R Programming

As mentioned above, R was developed specifically for statisticians. For this reason, R is mainly used in various research organizations and academia in general. However, R is now quickly being absorbed in the enterprises as well, mainly because of its popularity and the availability of a large number of packages for statistical computation.

Python

Python is a gene

As Python is a general-purpose programming language we can use to build different kinds of applications. We can use Python to build web applications using popular frameworks like Django or Flask.

Lately, Python is becoming popular amongst data scientists as the language of choice given the simplicity of syntax, high speed and performance it has to offer. There has been a trend which has seen a sharp rise in the adaptability of Python over R in the last few years in Data Science.

So, there you have it folks. Decide for yourself now! We will meet you soon in the next blog.

Dexlab Analytics is a pioneering institute of Data Science and Big Data Analytics with all-inclusive Big data courses in Delhi along with numerous other efficacious courses like Hadoop certification in Delhi, R programming courses in Gurgaon and Python for Data Analysis under experienced trainers and professionals.


Interested in a career in Data Analyst?

To learn more about Data Analyst with Advanced excel course – Enrol Now.
To learn more about Data Analyst with R Course – Enrol Now.
To learn more about Big Data Course – Enrol Now.

To learn more about Machine Learning Using Python and Spark – Enrol Now.
To learn more about Data Analyst with SAS Course – Enrol Now.
To learn more about Data Analyst with Apache Spark Course – Enrol Now.
To learn more about Data Analyst with Market Risk Analytics and Modelling Course – Enrol Now.

Calculating the Standard Deviation Using R & Python

Calculating the Standard Deviation Using R & Python

When it comes to summarizing the data, standard deviation (σ) is the value which tells us about the spread of the data. More specifically, it gives information about the dispersion of each observation from the mean of the data. Now, if you are interested in understanding Mean and knowing how to calculate it, then we have shown you in CALCULATING GEOMETRIC MEAN USING R AND PYTHON And APPLICATION OF HARMONIC MEAN USING R AND PYTHON.

Thus, in essence standard deviation gives us valuable information about the robustness of the mean. The deviation is in both positive and negative direction of the mean.

Therefore, it is desirable for the standard deviation to be a low value in comparison to the mean. This would indicate a smaller spread.

Mathematically speaking, standard deviation is known as the second moment about Mean. Variance is standard deviation squared. The variance does not have any mathematical significance on its own. Think of the variance as a mere mathematical maneuver.

The formula for the Variance is:

Application:

An investor wants to calculate the Standard Deviation experience by his investment portfolio in last 12 months (Year 2017-2018).  The returns are:-

Month (Year 2017-18)

Returns (%)

April

12%

May

10%

June

-8%

July

4%

August

12.25%

September

18%

October

13%

November

-9%

December

-4%

January

3%

February

9%

March

11.05%

Calculate Standard Deviation in R:

Examining the Standard Deviation of the investment portfolio returns of a year in R, we get the deviation = 8.803533 or, 8.81% (Approx).

Calculate Standard Deviation in Python:

First, create a Data Frame in Python.

Now, calculate Standard Deviation of the returns,

Examining the Standard Deviation of the investment portfolio returns of a year in Python, we get the deviation = 8.803533209439092 or, 8.81% (Approx)

Standard Deviation is a key part of calculating margins of errors.

Standard deviation shows the variation from the mean. A low standard deviation indicates that the observations (series of number) are very close to the mean. A high standard deviation indicates that the observations (series of numbers) are spread out over a large range.

In this data the mean of the returns is 5.95%, and standard deviation is 8.81% which is close to the mean. So, the deviation of the data is low.

Thus, the investor now knows that the returns of his portfolio fluctuate by approximately 8.81% month-over-month. The information can be used to modify the portfolio to better the investor’s attitude towards risk. If the investor is risk-loving and is comfortable with investing in higher-risk, higher-return securities and can tolerate a higher standard deviation, he/she may consider adding in some small-cap stocks or high-yield bonds. Conversely, an investor who is more risk-averse may not be comfortable with this standard deviation and would want to add in safer investments such as large-cap stocks or mutual funds.

Endnotes

This article will surely help you to figure out the standard deviation with R and Python. However, if you want to have a general idea about Central tendency, about Mean, Median and Mode, then go through our blog on STATISTICAL APPLICATION IN R & PYTHON: CHAPTER 1 – MEASURE OF CENTRAL TENDENCY.

For all other information about us and our courses, Dexlab Analytics is there with you. You can also follow us on Facebook and LinkedIn and go through our blogs to stay updated always.


Interested in a career in Data Analyst?

To learn more about Data Analyst with Advanced excel course – Enrol Now.
To learn more about Data Analyst with R Course – Enrol Now.
To learn more about Big Data Course – Enrol Now.

To learn more about Machine Learning Using Python and Spark – Enrol Now.
To learn more about Data Analyst with SAS Course – Enrol Now.
To learn more about Data Analyst with Apache Spark Course – Enrol Now.
To learn more about Data Analyst with Market Risk Analytics and Modelling Course – Enrol Now.
Application of Median Using R And Python: Calculating Median On the Go

Application of Median Using R And Python: Calculating Median On the Go

This blog is in continuation of STATISTICAL APPLICATION IN R & PYTHON: CHAPTER 1 – MEASURE OF CENTRAL TENDENCY and takes you through a comprehensive way to calculate the Median in R and Python.

The term ‘Median’ is derived from the Latin word – ‘Medius’ means the center of something. In mathematics, Median is treated is that unique observation which would divide your data set into two equal halves.

If you are still unclear about Mean and/or seeking easier ways to calculate Mean using R & Python, then check APPLICATION OF HARMONIC MEAN USING R AND PYTHON and CALCULATING GEOMETRIC MEAN USING R AND PYTHON.

Median is special because unlike its rival, the Mean, Median is not ridiculed by the curse of extreme values. To illustrate the curse of extreme values, we bring you the following example:

Imagine I had the following data about the average annual salaries:

In Lacs

8.5
9
11
7
8
8.5
36

The mean of the above data set is: 88/7 = 12.57 lacs.

Whereas, to get the median we would have to first arrange the data into ascending order and look for the midpoint of my data i.e.,(1/2 + n/2)th observation. Where “n” is the number of observations.

The median would then be:

7
8
8.5
8.5
9
11
36

Median is the 4th observation, which is 8.5 lacs.

Looking at the mean and median, it would be fair to conclude that median is the better choice to accurate summarizing the data set whenever extreme values are present. However, this may be a crude generalization which should be taken with a pinch of salt. Despite its flaws, the mean still has statistical properties used in predictive analytics which the median lacks.

Application:

A construction company gave wages to their 10 labor (Let name A to J)  as a weekly basis, the wages are 2000, 2100, 1900, 2150, 2500, 2450, 1800, 2600, 2200, 2300. Compute the Median wages of the construction company.

Sr.NoLaborsWages (Weekly)
1A2000
2B2100
3C1900
4D2150
5E2500
6F2450
7G1800
8H2600
9I2200
10J2300

Calculation Median in R:

Python Certification

The Median wage is 2175, calculate in R.

Calculate Median in Python:

Create a data frame of the data in Python.

R Programming Certification

Now, calculate Median in Python.

R Programming Certification

The Median wage is 2175, calculated in R.

This concludes the post. If you have any queries with regards to this post, you can reach us at Dexlab Analytics. Furthermore, you can also look up for interesting and quality courses of R Programming Certification, Python Certification. Also, you can enroll with us for our combined courses of Data Science with Python Certification, Deep Learning and AI using Python, among others. So, hurry up and grab the best course!


Interested in a career in Data Analyst?

To learn more about Data Analyst with Advanced excel course – Enrol Now.
To learn more about Data Analyst with R Course – Enrol Now.
To learn more about Big Data Course – Enrol Now.

To learn more about Machine Learning Using Python and Spark – Enrol Now.
To learn more about Data Analyst with SAS Course – Enrol Now.
To learn more about Data Analyst with Apache Spark Course – Enrol Now.
To learn more about Data Analyst with Market Risk Analytics and Modelling Course – Enrol Now.

6 Essential Skills Data Scientists Need to Add to Their Resumes

6 Essential Skills Data Scientists Need to Add to Their Resumes

Like all other career paths, cracking the hottest job of 21st century is mainly about gaining knowledge and developing important skills relevant to the job. And your resume should reflect all these skills. So what must the resume of a professional data scientist look like? Here are 6 key skills that must be in the fingertips of a good data scientist.

Stats and Math:

Not only blue-chip tech companies, even medium and small scale enterprises are operated by data science these days. And statistical knowledge is vital for that. You should be thorough with general statistical concepts, like distributions, tests, range, likelihood estimators, etc.

In mathematics, one must know the basics of linear algebra and multivariable calculus. This will definitely make a difference in your work outcomes as it enables you to improve predictive presentations.

2

Excellent Programming and Computing Skills:

Simply put, being good at coding is a must. So, if you are a budding data scientist you must actively work towards developing a computing mind; you should be able to understand, write and even analyze code whenever necessary. This level of dexterity only comes through meticulous study and practice of not one, but a number of programming languages.

If you want to develop a programming skill which is especially designed for data scientists, then get enrolled for R programming certification. Over 40 percent data scientists prefer R for solving stat problems. But it must be noted that R isn’t easy to learn, especially for those who aren’t comfortable with codes.

Python is another language which is highly preferred by data scientists because it is very adaptable and hence, can be employed in all the different steps part of a data science project. Moreover, data sets can be created with ease and SQL tables can be imported into working codes when required. Considering these benefits and the fact that over 50% data scientists favor Python, an excellent Python Certification in Delhi should be first in your list of courses to undertake.

Live Projects

Learning isn’t effective unless you implement it practically. Moreover, your skills get duly appreciated when it’s demonstrated. Hence, always look for live projects you can join and try to understand the data architecture behind the screen. It may be up there in your head, but it needs to be implemented. Large companies actually prefer candidates who have more practical experience rather than just bookish knowledge.

Managing Unstructured Data

Unstructured data is any type of content that doesn’t fit into traditional database tables. These data types aren’t well organized and hence, sorting them becomes very difficult. Blogs, videos and customer reviews are some examples of unstructured data. Being able to manage unstructured data is an important skill for data scientists. Apache Hadoop, NoSQL and Microsoft HDI insight are some good software for tackling unstructured data. If you are interested to learn the techniques, you can look up the course details for Hadoop certification in Delhi at DexLab Analytics.

Storytelling with Data

Data scientists might have to work with complicated models and datasets, but they must know how to express their deductions in lucid language that’s simple and engaging. Hence their raw data must be expressed in the form of tables, charts and graphs, which are visually appealing and can capture the attention of stakeholders.

Academics and Degrees

A strong educational background is the door to the world of data science. Big companies prefer applicants who are master degree holders in either stats or math or computer science or physical science.

Data science is definitely the trendiest job and you might be eager to land one, but it’s not easy to acquire the above mentioned skills. If you are looking for guidance from experts who have previously worked in this field, then you should get enrolled for Data Science Courses in Delhi right away. The industry experts at DexLab Analytics tailor the courses to the unique needs of students and incorporate ample practical cases to help them get ready for the challenges ahead.


Reference: www.analyticsindiamag.com/7-things-data-scientists-must-have-in-their-resumes


Interested in a career in Data Analyst?

To learn more about Data Analyst with Advanced excel course – Enrol Now.
To learn more about Data Analyst with R Course – Enrol Now.
To learn more about Big Data Course – Enrol Now.

To learn more about Machine Learning Using Python and Spark – Enrol Now.
To learn more about Data Analyst with SAS Course – Enrol Now.
To learn more about Data Analyst with Apache Spark Course – Enrol Now.
To learn more about Data Analyst with Market Risk Analytics and Modelling Course – Enrol Now.

R Programming: The Language Marketers Use to Tame Data

R Programming: The Language Marketers Use to Tame Data

How to manage data? This is a question that’s baffles us each and every time, whenever we look at data.

The real challenge is not about managing data, but how to synchronize processes to expose the issues with data. Today’s marketers may have a tough time tackling these challenges. Even more for non-tech-savvy marketers, they may be feel a bit overwhelmed, but we’ve a solution – R programming language is capable of performing specific tasks while preparing data for machine learning models or advanced analytics.

2

Basics of R

R programming is a popular open source language ideal for smart data visualization and statistical modeling. Generally, it functions through a terminal on a laptop, but you can also enjoy development environment software that makes R quite user-friendly.

One of the most sought after Integrated Development Environment (IDE) is RStudio – it’s very popular amongst practitioners mostly owing to its quad-window view, which let users view their results in the terminal beside the whiteboard platform.

Exploring Data with R

Data importing is the starting point of analyzing data. Fortunately, a more than sufficient number of R programming libraries exist today that are up to interface with a database or an API. Some of these libraries are: twitteR, RMongo and Jsonlite. A quick search across Comprehensive R Archive Network will help you find them.

Next, you have to turn your attention to data wrangling. It’s the method of mapping one row format to another, while amalgamating, dividing and rearranging rows and columns. Map out the metrics after ascertaining whether a task falls under one of the following mathematical categories:

  • Discrete Metrics
  • Continuous Metrics

Another significant step is corroborating the columns decided: are headers from the data source given? R Programming helps add headers on data as soon as data is imported. Furthermore, another question that pops up here is that are the headers from the same labels of parties who have access to data? Now, this question is instrumental in answering whether there is any more efficient way to have access to data consecutively without manually rectifying columns before placing the data in a model.

For R programming, some of the basic libraries to consider are as follows:

Readr – It helps estimate functions and read data in rectangular tabular formats

Tidyr – It helps in organizing missing field values and arranging tabular data in an effective and compatible structure

Dplyr – Ideal for transforming data after it’s added in R

Marketing Knowledge Is Still an Add-On Factor

Lastly, marketers should never ignore their domain knowledge, while modeling data. At times, your experience will help you tackle an outlier for a model in the best way possible. Or else, you might ask your technical team to adjust and manage data in cloud in a situation where other teams try to downstream assess data.

Thus, a relevant marketing knowledge is essential. It will help decide which data to be queried or how to parse it well.

If you are thinking of learning a popular yet effective programming language to tame your data, R Programming certification in Delhi NCR is the best solution for you. A good R programming training will help you understand and evaluate data like a pro.


The blog first appeared on ― www.cmswire.com/digital-marketing/how-marketers-can-plan-data-mining-with-r-programming


Interested in a career in Data Analyst?

To learn more about Data Analyst with Advanced excel course – Enrol Now.
To learn more about Data Analyst with R Course – Enrol Now.
To learn more about Big Data Course – Enrol Now.

To learn more about Machine Learning Using Python and Spark – Enrol Now.
To learn more about Data Analyst with SAS Course – Enrol Now.
To learn more about Data Analyst with Apache Spark Course – Enrol Now.
To learn more about Data Analyst with Market Risk Analytics and Modelling Course – Enrol Now.

Open a World of Opportunities: Web Scraping Using PHP and Python

Open a World of Opportunities: Web Scraping Using PHP and Python

The latest estimates says, the total number of websites has crossed one billion mark; everyday a new site is being added and removed, but the record stays.

Having said that, just imagine how much data is floating around the web. The amount is so huge that it would be impossible for even hundreds of humans to digest all the information in a lifetime. To tackle such large amounts of data, you not only need to have easy access to all the information but should also process some scalable way to gather data in order to organize and analyze it. And that’s exactly where web data scraping comes into picture.

Web scraping, data mining, web data extraction, web harvesting or screen scraping – they all means the same thing – a technique in which a computer program fetches huge piles of data from a website and saves them in your computer, spreadsheet or database in a normal format for easy analysis.

2

Web Scraping with Python and BeautifulSoup

In case, you are not satisfied with the internet sources of web scraping, you are most likely to develop your very own data scraping tools, which is quite easier. In this blog we will show you how to frame a web scraper with Python and very simple yet dynamic BeautifulSoup Library:

First, import the libraries we will use: requests and BeautifulSoup:

# Import libraries
import requests
from bs4 import BeautifulSoup

Secondly, point out the variable for the URL using request.get method and gain access to the HTML content right from this page:

import requests
URL = "http://www.values.com/inspirational-quotes"
r = requests.get(URL)
print(r.content)

Next, we will parse a webpage, and for that, we need to create a BeautifulSoup object:

import requests 
from bs4 import BeautifulSoup
URL = "http://www.values.com/inspirational-quotes"
r = requests.get(URL)

 # Create a BeautifulSoup object
soup = BeautifulSoup(r.content, 'html5lib')
print(soup.prettify())

Now, let’s extract some meaningful information from HTML content. Look at the HTML content of the webpage, which was printed using the soup.pretify()method..

table = soup.find('div', attrs = {'id':'container'})

Here, you will find each quote inside a div container, belonging to the class quote.

We will repeat the process with each div container, belonging to the class quote. For that, we will use findAll()method and repeat the process with each quote using variable row.

After which, we will create a dictionary, in which all the data about the quote will be saved in a list, and is called ‘quotes’.

    quote['lines'] = row.h6.text

Now, coming to the final step – write down the data to a CSV file, but how?

See below:

filename = 'inspirational_quotes.csv'
with open(filename, 'wb') as f:
    w = csv.DictWriter(f,['theme','url','img','lines','author'])
    w.writeheader()
    for quote in quotes:
        w.writerow(quote)

This type of web scraping is used on a small-scale; for larger scale, you can consider:

Scraping Websites with PHP and Curl

To connect to a large number of servers and protocols, and download pictures, videos and graphics from several websites, consider Scraping Websites with PHP and cURL.

<?php

function curl_download($Url){

    if (!function_exists('curl_init')){
        die('cURL is not installed. Install and try again.');
    }

    $ch = curl_init();
    curl_setopt($ch, CURLOPT_URL, $Url);
    curl_setopt($ch, CURLOPT_RETURNTRANSFER, true);
    $output = curl_exec($ch);
    curl_close($ch);

    return $output;

print curl_download('http://www.gutenberg.org/browse/scores/top');

?>

In a nutshell, the scopes of using web scraping for analyzing content and applying it to your content marketing strategies are vast like the horizon. Armed by endless types of data analysis, web scraping technology has proved to be a valuable tool for the content producers. So, when are you feeding yourself with web scraping technology?

Discover the perfect platform for excellent R programming using Python courses. For more information on R programming training institute drop by DexLab Analytics.

 
This post originally appeared ondzone.com/articles/be-leading-content-provider-using-web-scraping-php
 

Interested in a career in Data Analyst?

To learn more about Data Analyst with Advanced excel course – Enrol Now.
To learn more about Data Analyst with R Course – Enrol Now.
To learn more about Big Data Course – Enrol Now.

To learn more about Machine Learning Using Python and Spark – Enrol Now.
To learn more about Data Analyst with SAS Course – Enrol Now.
To learn more about Data Analyst with Apache Spark Course – Enrol Now.
To learn more about Data Analyst with Market Risk Analytics and Modelling Course – Enrol Now.

Call us to know more