R Programming Tutorial Archives - DexLab Analytics | Big Data Hadoop SAS R Analytics Predictive Modeling & Excel VBA

R Programming: The Language Marketers Use to Tame Data

R Programming: The Language Marketers Use to Tame Data

How to manage data? This is a question that’s baffles us each and every time, whenever we look at data.

The real challenge is not about managing data, but how to synchronize processes to expose the issues with data. Today’s marketers may have a tough time tackling these challenges. Even more for non-tech-savvy marketers, they may be feel a bit overwhelmed, but we’ve a solution – R programming language is capable of performing specific tasks while preparing data for machine learning models or advanced analytics.

2

Basics of R

R programming is a popular open source language ideal for smart data visualization and statistical modeling. Generally, it functions through a terminal on a laptop, but you can also enjoy development environment software that makes R quite user-friendly.

One of the most sought after Integrated Development Environment (IDE) is RStudio – it’s very popular amongst practitioners mostly owing to its quad-window view, which let users view their results in the terminal beside the whiteboard platform.

Exploring Data with R

Data importing is the starting point of analyzing data. Fortunately, a more than sufficient number of R programming libraries exist today that are up to interface with a database or an API. Some of these libraries are: twitteR, RMongo and Jsonlite. A quick search across Comprehensive R Archive Network will help you find them.

Next, you have to turn your attention to data wrangling. It’s the method of mapping one row format to another, while amalgamating, dividing and rearranging rows and columns. Map out the metrics after ascertaining whether a task falls under one of the following mathematical categories:

  • Discrete Metrics
  • Continuous Metrics

Another significant step is corroborating the columns decided: are headers from the data source given? R Programming helps add headers on data as soon as data is imported. Furthermore, another question that pops up here is that are the headers from the same labels of parties who have access to data? Now, this question is instrumental in answering whether there is any more efficient way to have access to data consecutively without manually rectifying columns before placing the data in a model.

For R programming, some of the basic libraries to consider are as follows:

Readr – It helps estimate functions and read data in rectangular tabular formats

Tidyr – It helps in organizing missing field values and arranging tabular data in an effective and compatible structure

Dplyr – Ideal for transforming data after it’s added in R

Marketing Knowledge Is Still an Add-On Factor

Lastly, marketers should never ignore their domain knowledge, while modeling data. At times, your experience will help you tackle an outlier for a model in the best way possible. Or else, you might ask your technical team to adjust and manage data in cloud in a situation where other teams try to downstream assess data.

Thus, a relevant marketing knowledge is essential. It will help decide which data to be queried or how to parse it well.

If you are thinking of learning a popular yet effective programming language to tame your data, R Programming certification in Delhi NCR is the best solution for you. A good R programming training will help you understand and evaluate data like a pro.


The blog first appeared on ― www.cmswire.com/digital-marketing/how-marketers-can-plan-data-mining-with-r-programming


Interested in a career in Data Analyst?

To learn more about Data Analyst with Advanced excel course – Enrol Now.
To learn more about Data Analyst with R Course – Enrol Now.
To learn more about Big Data Course – Enrol Now.

To learn more about Machine Learning Using Python and Spark – Enrol Now.
To learn more about Data Analyst with SAS Course – Enrol Now.
To learn more about Data Analyst with Apache Spark Course – Enrol Now.
To learn more about Data Analyst with Market Risk Analytics and Modelling Course – Enrol Now.

Why R is the Most Suitable Programming Language for Encompassing Data Science Projects?

Why R is the Most Suitable Programming Language for Encompassing Data Science Projects?

Since the early 1990’s, when R was first conceptualized, it has been leading the show in the field of data science. In the past few years, however, the popularity of R has increased exponentially – thanks to the advancement in data analytics environment. From data scientists to statisticians and researchers, R has become a hot-favorite for all. And, why not? It’s a GNU package and a free software package for statistical computing.

In this era of evolution, finding the best tool to stay ahead of the curve is the need of the hour. For that and more, we have selected R and given below are the points proving why R is the best programming tool in the competitive environment of data science.

2

R is a substitute for data science for non-technical data enthusiasts

Well, if you are aware of leading data science trends and programming languages, you will find two high-end data science tools – R and Python – they tend to be the topic of conversation for all data-related matter. Python is a top of the line programming language for software professionals who have a knack in mathematics, statistics and machine learning, but lacks big time in offering library support on subjects like Econometrics and a bunch of communication tools, including reporting.

Most of the consultants working in the field of data science belongs from business community, and have no particular interest in technical know-how about developing software and acing programming languages. Learning python would not be as much of help as it would be mastering R programming – R is a programming language that supports libraries for stats, machine learning and data science. Thus, R is the best fit for data science enthusiasts not belonging from technical background. Also, R offers support packages or libraries for Econometrics, Finance, etc. – all of this is widely used for data analytics.

For R language training in Delhi, drop by DexLab Analytics.

After Tidyverse, mastering R is easy

Previously, learning R was no mean feat. It was considered one of the toughest languages to learn and largely inconsistent; the reasons being structuring and formality. But the things started to change when Tidyverse was introduced – it’s a robust set of packages and tools that offers steady structural programming interface.

In fact, after the launch of ‘dplyr’ and ‘ggplot2’, curve complexities got reduced even more. Just like any other languages, R went on getting better with its programming interface and achieving more structural and consistent – thanks to Tidyverse – it turned out to be efficient as it includes support packages for visualization, modeling, manipulation, iteration and communication – all of these turned R a super easy language to ace on.

R is mostly used for business purposes

The biggest advantage of R as compared to other programming languages is its capability to create industry-ready reports and infographics, and ML-powered web applications. For business-related matter, no other tool is as efficient as R.

But have you wondered what makes R so popular among the business community? It’s the two special R-enabled frameworks – RMARKDOWN and Shiny.

RMARKDOWN helps in developing reconstructable reports, which are regarded as the stepping stone for building blogs, websites, presentations, books and journals. On the other hand, Shiny is a powerful framework for creating interactive web applications for R. It is handy and widely popular.

DexLab Analytics offers leading R programming courses in Gurgaon for all the data enthusiasts. Check out the course itinerary and decide for yourself.


The blog has been sourced from – 

www.technotification.com/2018/06/r-programming-data-science.html


Interested in a career in Data Analyst?

To learn more about Data Analyst with Advanced excel course – Enrol Now.
To learn more about Data Analyst with R Course – Enrol Now.
To learn more about Big Data Course – Enrol Now.

To learn more about Machine Learning Using Python and Spark – Enrol Now.
To learn more about Data Analyst with SAS Course – Enrol Now.
To learn more about Data Analyst with Apache Spark Course – Enrol Now.
To learn more about Data Analyst with Market Risk Analytics and Modelling Course – Enrol Now.

How R Programming is Transforming Business for Good

Today, every business is putting efforts to understand their customers and themselves, better. But, how? What methods are they applying? Do mere Excel pivot tables help analyze vast pool of data? The answer to the latter question is in the negative – Excel pivot tables are not that great at analyzing data – so a wide number of companies look forward to SAS and R Programming to cull Business Intelligence.

 
How R Programming is Transforming Business for Good
 

Besides SAS, R-Programming is another open-source language that is used by most of the budding data scientists in the world of analytics. The R Programming language is more oriented towards the correct implication of data science, while ensuring business the cutting edge data analysis tools. Continue reading “How R Programming is Transforming Business for Good”

We Feel Honored To Conduct Training for Mercer in R Programming

We are back again with some awesome news! DexLab Analytics is organizing a comprehensive one-week training program for super-efficient data analytics and big data team of Mercer – a top notch multinational corporation that provides top-of-the-line solutions in Talent, Retirement and Investments worldwide.

 
We Feel Honored To Conduct Training for Mercer in R Programming
 

The training module has started from Thursday, 21st September 2017 and our in-house senior consultants are imparting cutting edge technological knowledge about R Programming to the data-hungry Mercer professionals. The training is taking place at Mercer’s corporate in DLF Phase 3, Gurgaon Office: with the rising demand of data analytics and R skills to imbibe, the advancement in the field of health, wealth and careers is witnessing a steady growth. To target a larger audience and loyal clientele base, R Programming skills need to be harnessed properly so as to flourish the future of business on a larger scale.

Continue reading “We Feel Honored To Conduct Training for Mercer in R Programming”

Open a World of Opportunities: Web Scraping Using PHP and Python

Open a World of Opportunities: Web Scraping Using PHP and Python

The latest estimates says, the total number of websites has crossed one billion mark; everyday a new site is being added and removed, but the record stays.

Having said that, just imagine how much data is floating around the web. The amount is so huge that it would be impossible for even hundreds of humans to digest all the information in a lifetime. To tackle such large amounts of data, you not only need to have easy access to all the information but should also process some scalable way to gather data in order to organize and analyze it. And that’s exactly where web data scraping comes into picture.

Web scraping, data mining, web data extraction, web harvesting or screen scraping – they all means the same thing – a technique in which a computer program fetches huge piles of data from a website and saves them in your computer, spreadsheet or database in a normal format for easy analysis.

2

Web Scraping with Python and BeautifulSoup

In case, you are not satisfied with the internet sources of web scraping, you are most likely to develop your very own data scraping tools, which is quite easier. In this blog we will show you how to frame a web scraper with Python and very simple yet dynamic BeautifulSoup Library:

First, import the libraries we will use: requests and BeautifulSoup:

# Import libraries
import requests
from bs4 import BeautifulSoup

Secondly, point out the variable for the URL using request.get method and gain access to the HTML content right from this page:

import requests
URL = "http://www.values.com/inspirational-quotes"
r = requests.get(URL)
print(r.content)

Next, we will parse a webpage, and for that, we need to create a BeautifulSoup object:

import requests 
from bs4 import BeautifulSoup
URL = "http://www.values.com/inspirational-quotes"
r = requests.get(URL)

 # Create a BeautifulSoup object
soup = BeautifulSoup(r.content, 'html5lib')
print(soup.prettify())

Now, let’s extract some meaningful information from HTML content. Look at the HTML content of the webpage, which was printed using the soup.pretify()method..

table = soup.find('div', attrs = {'id':'container'})

Here, you will find each quote inside a div container, belonging to the class quote.

We will repeat the process with each div container, belonging to the class quote. For that, we will use findAll()method and repeat the process with each quote using variable row.

After which, we will create a dictionary, in which all the data about the quote will be saved in a list, and is called ‘quotes’.

    quote['lines'] = row.h6.text

Now, coming to the final step – write down the data to a CSV file, but how?

See below:

filename = 'inspirational_quotes.csv'
with open(filename, 'wb') as f:
    w = csv.DictWriter(f,['theme','url','img','lines','author'])
    w.writeheader()
    for quote in quotes:
        w.writerow(quote)

This type of web scraping is used on a small-scale; for larger scale, you can consider:

Scraping Websites with PHP and Curl

To connect to a large number of servers and protocols, and download pictures, videos and graphics from several websites, consider Scraping Websites with PHP and cURL.

<?php

function curl_download($Url){

    if (!function_exists('curl_init')){
        die('cURL is not installed. Install and try again.');
    }

    $ch = curl_init();
    curl_setopt($ch, CURLOPT_URL, $Url);
    curl_setopt($ch, CURLOPT_RETURNTRANSFER, true);
    $output = curl_exec($ch);
    curl_close($ch);

    return $output;

print curl_download('http://www.gutenberg.org/browse/scores/top');

?>

In a nutshell, the scopes of using web scraping for analyzing content and applying it to your content marketing strategies are vast like the horizon. Armed by endless types of data analysis, web scraping technology has proved to be a valuable tool for the content producers. So, when are you feeding yourself with web scraping technology?

Discover the perfect platform for excellent R programming using Python courses. For more information on R programming training institute drop by DexLab Analytics.

 
This post originally appeared ondzone.com/articles/be-leading-content-provider-using-web-scraping-php
 

Interested in a career in Data Analyst?

To learn more about Data Analyst with Advanced excel course – Enrol Now.
To learn more about Data Analyst with R Course – Enrol Now.
To learn more about Big Data Course – Enrol Now.

To learn more about Machine Learning Using Python and Spark – Enrol Now.
To learn more about Data Analyst with SAS Course – Enrol Now.
To learn more about Data Analyst with Apache Spark Course – Enrol Now.
To learn more about Data Analyst with Market Risk Analytics and Modelling Course – Enrol Now.

Using R Programming to Simulate the Incredible Pong Arcade Game

Unleashed in the market in 1972, Pong is one of the first computer games ever developed. Loosely inspired by tennis, Pong captured the worldwide gaming market soon after its launch. Instantaneously, it became a trending fad. Gaming enthusiasts became intrigued, they desired to delve deeper into the computer coding and system mechanisms mostly to understand the essence of arcade game development.

 
Using R Programming to Simulate the Incredible Pong Arcade Game
 

Today, R-Programming is extensively used to develop numerous board games. But the question to ponder on is – can we create traditional arcade games with R programming?

Continue reading “Using R Programming to Simulate the Incredible Pong Arcade Game”

How to Create Repeat Loop in R Programming

In this tutorial, we will learn to make a repeat loop with the use of R programming.

How to Create Repeat Loop in R Programming

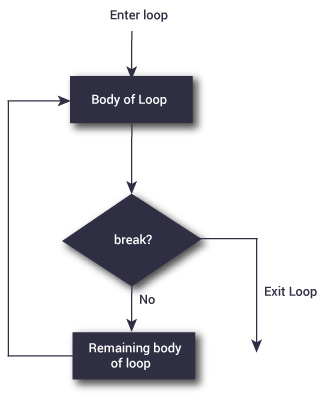
A repeat loop is used to iterate over a block of code over several number of times.

In case of a repeat loop, there is no condition to check in for exiting repeat loop.

Hence, we must ourselves put a condition explicitly within a repeat loop body and make use of the break statement to exit the loop. Failing to do so will result into an infinite loop.

 Syntax of repeat loop

repeat {
   statement
}

When in the statement block, we must use the statement ‘break’ to exit the loop.

 r-repeat-loop-flowchart-120

Example: repeat loop

x <- 1

repeat {
   print(x)
   x = x+1
   if (x == 6){
       break
   }
}

 Output

[1] 1
[1] 2
[1] 3
[1] 4
[1] 5

Note that in the example above, we have only made use of a condition to check and exit the loop when x equals the value of 6.

That is why we see in our output that only values from 1 to 5 get printed.

Why not pull the strings of your career by enrolling for an intensive R programming certification course in Delhi!  DexLab Analytics, being a premier R programming training institute can help you on your endeavour.


This post originally appeared onwww.datamentor.io/r-programming/repeat-loop

Interested in a career in Data Analyst?

To learn more about Machine Learning Using Python and Spark – click here.
To learn more about Data Analyst with Advanced excel course – click here.
To learn more about Data Analyst with SAS Course – click here.
To learn more about Data Analyst with R Course – click here.
To learn more about Big Data Course – click here.

Debugging Magrittr Pipelines in R with Bizarro Pipe and Eager Assignment

Debugging Magrittr Pipelines in R with Bizarro Pipe and Eager Assignment


Pipes in R

Pipe, written as “%>%“ is basically an efficient operator, supplied by magrittr R package. The pipe operator is notably famous due to its wide range of use in dplyr and by the proficient dplyr users. The usage of pipe operator allows one to write “sin(5)” as “5 %>% sin“,  which is inspired by F#‘s pipe-forward operator “|>” and is further characterised by: Continue reading “Debugging Magrittr Pipelines in R with Bizarro Pipe and Eager Assignment”

How To Visualize Multivariate Relationships in Large Datasets in R Programming:

How To Visualize Multivariate Relationships in Large Datasets in R Programming:
 

In this post, we will discuss how to use the package nmle in R programming, which includes the dataset MathArchieve. To install the package and load it into your R programming environment, use the code mentioned below:

Continue reading “How To Visualize Multivariate Relationships in Large Datasets in R Programming:”

Call us to know more