R language training Archives - Page 2 of 2 - DexLab Analytics | Big Data Hadoop SAS R Analytics Predictive Modeling & Excel VBA

How R Programming is Transforming Business for Good

Today, every business is putting efforts to understand their customers and themselves, better. But, how? What methods are they applying? Do mere Excel pivot tables help analyze vast pool of data? The answer to the latter question is in the negative – Excel pivot tables are not that great at analyzing data – so a wide number of companies look forward to SAS and R Programming to cull Business Intelligence.

 
How R Programming is Transforming Business for Good
 

Besides SAS, R-Programming is another open-source language that is used by most of the budding data scientists in the world of analytics. The R Programming language is more oriented towards the correct implication of data science, while ensuring business the cutting edge data analysis tools. Continue reading “How R Programming is Transforming Business for Good”

We Feel Honored To Conduct Training for Mercer in R Programming

We are back again with some awesome news! DexLab Analytics is organizing a comprehensive one-week training program for super-efficient data analytics and big data team of Mercer – a top notch multinational corporation that provides top-of-the-line solutions in Talent, Retirement and Investments worldwide.

 
We Feel Honored To Conduct Training for Mercer in R Programming
 

The training module has started from Thursday, 21st September 2017 and our in-house senior consultants are imparting cutting edge technological knowledge about R Programming to the data-hungry Mercer professionals. The training is taking place at Mercer’s corporate in DLF Phase 3, Gurgaon Office: with the rising demand of data analytics and R skills to imbibe, the advancement in the field of health, wealth and careers is witnessing a steady growth. To target a larger audience and loyal clientele base, R Programming skills need to be harnessed properly so as to flourish the future of business on a larger scale.

Continue reading “We Feel Honored To Conduct Training for Mercer in R Programming”

How to create Chart Templates with R Functions

R functions are used to produce chart templates to keep the look and feel of the reports intact.

 
How to create Chart Templates with R Functions
 

In this post you will come across how to create chart templates with R functions – all the R users should be accustomed to the calling functions so as to perform calculations and outline plots accurately. Remember what colors and fonts to use each time: R functions are used as a short-cut for producing customary-looking charts.

Continue reading “How to create Chart Templates with R Functions”

Classifying Bank Customer Data Using R? Use K-means Clustering

Before delving deeper into the analysis of bank data using R, let’s have a quick brush-up of R skills.


Classifying Bank Customer Data Using R? Use K-means Clustering


As you know, R is a well-structured functional suite of software for data estimation, manipulation and graphical representation.

Continue reading “Classifying Bank Customer Data Using R? Use K-means Clustering”

Analyze Smartphone Sensor Data with R and the BreakoutDetection Package

Analyze-Smartphone-Sensor-Data-with-R-and-the-BreakoutDetection-Package

Quite interetsing. Juggling with sensor data is starkly different from economics data, document processing or social networking, but very worthwhile. In this blog, we will take a practical approach to analyze smartphone sensor data with R. We are going to use the accelerometer smartphone data that Datarella presented in its Data Fiction competition. The dataset signifies the stimulation along the three axes of the smartphone:


x – for sideways stimulation

y – for forward and backward stimulation

z – for upward and downward stimulation


The trickier part lies in its interpretation – on one hand where there are device, manufacturer and sensor specific mutations and artifacts, the other reflects all acceleration is calculated relative to the sensor orientation of the device. For example, taking out the cell phone out of your pocket and reading a tweet can be presented in the following way:


y acceleration – the phone was in the pocket top down but now has been taken out

z and y acceleration – tossing the phone so that it becomes horizontal

x acceleration – moving the smartphone from the left to the middle of your body

z acceleration – bringing  up the phone so that you can read the tweet clearly

And thirdly, the gravity influences all the movements.


Seeking R programming courses in Gurgaon? Feel free to reach us at DexLab Analytics..

Knowing exactly what to do with your smartphone can be quite intimidating – let us introduce an application of the Twitter BreakoutDetection Open Source library (see Github), which is used extensively for Behavioral Change Point analysis.

First, I have loaded the dataset and this is how it looks like:

setwd("~/Documents/Datarella")
accel <- read.csv("SensorAccelerometer.csv", stringsAsFactors=F)
head(accel)

  user_id           x          y        z                 updated_at                 type
1      88 -0.06703765 0.05746084 9.615114 2014-05-09 17:56:21.552521 Probe::Accelerometer
2      88 -0.05746084 0.10534488 9.576807 2014-05-09 17:56:22.139066 Probe::Accelerometer
3      88 -0.04788403 0.03830723 9.605537 2014-05-09 17:56:22.754616 Probe::Accelerometer
4      88 -0.01915361 0.04788403 9.567230 2014-05-09 17:56:23.372244 Probe::Accelerometer
5      88 -0.06703765 0.08619126 9.615114 2014-05-09 17:56:23.977817 Probe::Accelerometer
6      88 -0.04788403 0.07661445 9.595961  2014-05-09 17:56:24.53004 Probe::Accelerometer

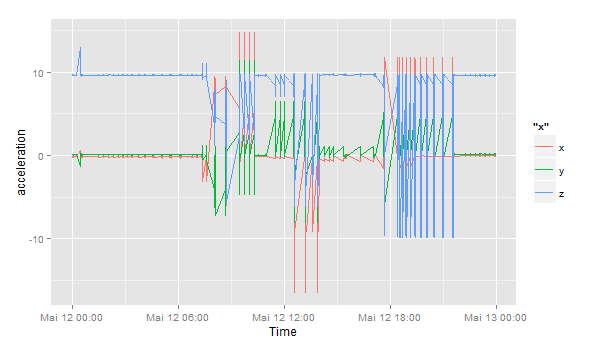
This data includes the sensor data per user per day:

accel$day <- substr(accel$updated_at, 1, 10)
df <- accel[accel$day == '2014-05-12' & accel$user_id == 88,]
df$timestamp <- as.POSIXlt(df$updated_at) # Transform to POSIX datetime
library(ggplot2)
ggplot(df) + geom_line(aes(timestamp, x, color="x")) + 
             geom_line(aes(timestamp, y, color="y")) + 
             geom_line(aes(timestamp, z, color="z")) + 
             scale_x_datetime() + xlab("Time") + ylab("acceleration")

sensor_all

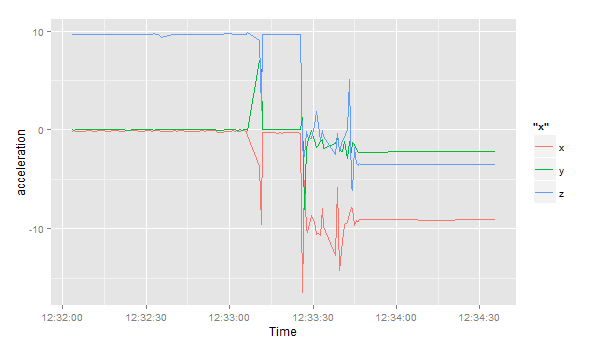
Let’s focus on the period between 12:32 and 13:00:

ggplot(df[df$timestamp >= '2014-05-12 12:32:00' & df$timestamp < '2014-05-12 13:00:00',]) +
  geom_line(aes(timestamp, x, color="x")) + 
  geom_line(aes(timestamp, y, color="y")) + 
  geom_line(aes(timestamp, z, color="z")) + 
  scale_x_datetime() + xlab("Time") + ylab("acceleration")

sensor_zoom

Following all this, I load the Breakoutdetection library:

install.packages("devtools")
devtools::install_github("twitter/BreakoutDetection")
library(BreakoutDetection)
bo <- breakout(df$x[df$timestamp >= '2014-05-12 12:32:00' & df$timestamp < '2014-05-12 12:35:00'], 
               min.size=10, method='multi', beta=.001, degree=1, plot=TRUE)
bo$plotsensor_breakout

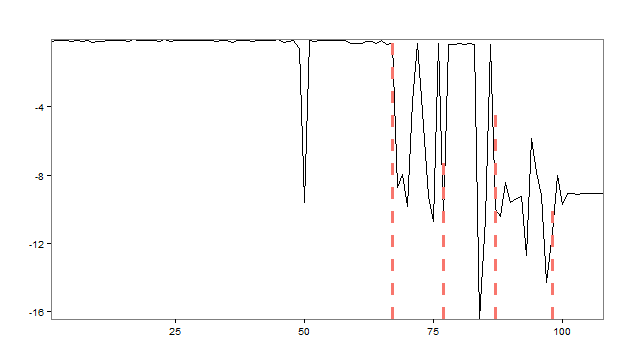
The rapid analysis of the acceleration in the x direction presents us with 4 change points, in which the stimulation suddenly starts to change. At the start, the smartphone normally lies flat on a horizontal surface – the sensor reading revolves around value of 9.8 in a positive direction – which means the gravitational force only triggers this axis and not the x or y axes. Therefore, the phone is lying flat. However, things change and after a couple of movements or changing directions, the last observation reveals the phone has been on a position where the x axis has 9.6 acceleration, meaning the phone is being positioned in a landscape orientation facing the right.

Get the best R Analytics Certification in Gurgaon from our seasoned experts at DexLab Analytics.

 
This post originally appeared onwww.r-bloggers.com/how-to-analyze-smartphone-sensor-data-with-r-and-the-breakoutdetection-package
 

Interested in a career in Data Analyst?

To learn more about Data Analyst with Advanced excel course – Enrol Now.
To learn more about Data Analyst with R Course – Enrol Now.
To learn more about Big Data Course – Enrol Now.

To learn more about Machine Learning Using Python and Spark – Enrol Now.
To learn more about Data Analyst with SAS Course – Enrol Now.
To learn more about Data Analyst with Apache Spark Course – Enrol Now.
To learn more about Data Analyst with Market Risk Analytics and Modelling Course – Enrol Now.

Is Data an Asset or Liability

While many firms are stating that they leverage their data to gain valuable insights and translate them into profit. But the basic question remains whether data is an asset or a liability. This is the mind-numbing question that haunts all IT managers and must be given ample concentration on what is collected in terms of data and how can it be managed efficiently.


Is data an asset or liability


There can be two approaches to answer this question, the first being that data could be an asset if used ethically and correctly. But when no actionable insight can be gathered from data, it is a liability in the same lines as an old non-performing loan. Optimum use of data is elemental to the operations of any data driven initiative. The main reason behind this data-drive remains to be to obtain faster and better decision making abilities with more accuracy. Nowadays organizations across the board leverage their data to achieve their goals. Currently sales organizations are the frontrunners who mine their data to get the best results and maximize their revenue from already customers. Also crediting companies use their data to evaluate the risks associated with different individual debtors and then act accordingly when setting rates and fees for their loans that seem to be fair based on this information. In these scenarios the companies use real information to make decisions.

Continue reading “Is Data an Asset or Liability”

Role of R In Business Intelligence

To put it simply Business Intelligence is the action of extracting and to derive information that may be of use from the available data. As might be evident the process is a broad one where the quality and the source of the data structure is variable. Transformations like this might in technical terms be described as ETL or extract, transform and load in addition to the presentation of information that is of use.


role of r in business intelligence

R Programming in Business Intelligence

Some R Programming Experts hold that R is fully able to take on the role of the engine for processes related to BI. Here we will focus only on the BI function of R i.e. to extract, transform load and present information and data. The following packages correspond to indicated processes in Business Intelligence.


Extract


Extraction


  •  RODBC
  • DBI
  • data.table’s fread
  • RJDBC


In addition to these, there are several other packages that support data in a variety of formats.


Transform


  • data.table
  • dplyr


Load


  • DBI
  • RODBC
  • RJDBC


Let’s Take Your Data Dreams to the Next Level


Prsentation


Presenting data is a wholly different ball game than the previously mentioned process of ETL. Never fear, it may be outsourced with ease to tools of BI dashboard with ease by populating the structure of data according to the expectations of the particular data tool. R is able to create a dashboard of a web app directly from within itself through packages like:


  •  shiny
  • httpuv
  • opencpu
  • rook


These packages let you play host to interactive web apps. They have the ability to query the data in an interactive manner and generate interactive plots. The basis for all of these is an R session engine and is able to execute all functions of R and may leverage the capabilities of statistics of all packages in R.


2


Extras


The above mentioned packages serve as the core whose functionality may be simplified through the use of the packages mentioned below:


  • db.r
  • ETLUtils
  • Sqldf
  • Dplyr
  •  shinyBI
  • dwtools


The following factors are critical while R is adopted by businesses:


  • Extraction / Loading
  • Performance and scalability
  • Presentation
  • Support and licensing


For more details on R Programming, get yourself enrolled in superior R programming courses in Pune. R programming certification in Pune by DexLab Analytics is extremely popular.


Interested in a career in Data Analyst?

To learn more about Machine Learning Using Python and Spark – click here.
To learn more about Data Analyst with Advanced excel course – click here.
To learn more about Data Analyst with SAS Course – click here.
To learn more about Data Analyst with R Course – click here.
To learn more about Big Data Course – click here.

New R Packages- 5 Reasons for Data Scientists to Rejoice

5-Reasons-for-Data-Scientists-to-Rejoice

One of the fundamental advantages of the ecosystem related to R and the primary reason that lie behind the phenomenal growth of R is the practice and facility to contribute new packages to R. When this is added to the highly stable CRAN which happens to be the primary repository of packages of R,gives it a great advantage. The effectiveness of CRAN is further enhanced by the ability of people with sufficient technical expertise and to contribute packages through a proper system of submission.

It is only with sufficient effort and time that one realizes the system of packages submitted through proper procedures can yield integrated software of high quality.Even those who are relatively new to R Programming the process of discovering the packages that serves as the bedrock of R language growth. Such packages add value to the language in a reliable way.

2

The following 5 new packages listed in the paragraphs that follow may trigger the curiosity of data scientists.

  •  AzureML V0.1.1

Cloud computing is and will continue to be of great interest to all data scientists. The AzureML provides Python and R Programmers a rich environment for machine learning. If you are yet to be initiated to Azure as a user this package will go long ways in helping you get started. It provides functions that let you push R code from your local system to the Azure cloud in addition to publishing models and functions as web services.

  •  Distcomp V0.25.1

Using distributed computing when dealing with large sets of data is invariable an irksome problem. This is truer in cases where sharing data amongst collaborators is difficult or simply not possible. The distcomp package implements a crafty partial likelihood algorithm which lets users build statistical models of complexity and sophistication on data sets that are not aggregated.

  • RotationForest V0.1

If there is any primary ensemble method that performs well on diverse sets of data on a constant basis is the forests algorithm. This particular variety performs principal analysis of components on subsets taken at random in the feature space and holds great promise.

  • Rpca V0.2.3

In case there is a matrix that forms a superposition of a component that is lowly ranked along with a sparse component, rcpa calls in a robust PCA method that recovers all of these components. The algorithm was publicized by the data scientists at Netflix.

  •  SwarmSVM V0.1

One of the primary machine learning algorithm happens to be the support vector machine. SwarmSVM has for its basis an approach that may be said to be as a clustering approach and makes provisions for 3 different ensemble methods that train support vector machines. A practical introduction to this particular method is also attached with the vignette that comes with the package.

For more such interesting technical blogs and insights, follow us at DexLab Analytics. We are a pioneering R programming training institute. Our industry experts impart the best possible R programming courses, so when are you contacting us!!


Interested in a career in Data Analyst?

To learn more about Data Analyst with Advanced excel course – Enrol Now.
To learn more about Data Analyst with R Course – Enrol Now.
To learn more about Big Data Course – Enrol Now.

To learn more about Machine Learning Using Python and Spark – Enrol Now.
To learn more about Data Analyst with SAS Course – Enrol Now.
To learn more about Data Analyst with Apache Spark Course – Enrol Now.
To learn more about Data Analyst with Market Risk Analytics and Modelling Course – Enrol Now.

Twelve Great Free R Programming E-books

To Big Data enthusiasts R is word or rather a letter that needs no introduction. R programming is a programming language that brings the complex world of statistics and datasets at your fingertips. It is mainly used for computing statistics and relevant graphics. The following twelve e-books are not only useful to bring you up to the task for R programming but best of all they are free.


Twelve Great Free R Programming E-books


  • Learning Statistics with R
    Author: Daniel Navarro

If you are looking for a guide that will take you through the intricacies of developing software with R be it the basic types and structures of data to more complex topics like recursion, closures as well as anonymous functions. Knowledge of statistics, although helpful, is not an essential pre-requisite .

Continue reading “Twelve Great Free R Programming E-books”

Call us to know more