Python Archives - Page 5 of 7 - DexLab Analytics | Big Data Hadoop SAS R Analytics Predictive Modeling & Excel VBA

Straight Out of College? Grasp These Killer Data Science Skills

Straight Out of College? Grasp These Killer Data Science Skills

Data Science is one of the most demanding fields in the present world. Going hand in hand with the Artificial Intelligence, Data Science is showing a colossal growth in the coming years. So, honestly speaking, you should be prepared with all of the cutting-edge tools and up skill yourself accordingly to pace up with the modern world.

According to Derek Steer, CEO of Mode, the world will generate 50 times more data than what we were present in 2011. Moreover, with the data processing power becoming easy and inexpensive for most of the firms, candidates with real skill and a hunger for knowledge would only see their way through till the end, added Steer.

Among various other skills like retail analytics using Python, neural network machine learning Python, which are dominating and/or expected to rule the world of technology in the upcoming years, here we list you some of them:

2

Data Visualization

This is one of the top notch skills that you can find now. It is process of maintaining data with the help of graphical representations. This further makes the interpretation and thereby, the comprehension of data, much easier.

This is an extremely relevant skill which is not to be found among the high schoolers. This makes the undergraduates or post graduates with the knowhow of data visualisation all the more important everywhere.

Data Modelling

Data Modelling is the second most wanted skill that the entire world is seeking for. In a nutshell, Data Modelling is the process of understanding and using data to seek relationships across varied sets of information.

It is, in fact, a skill which is gaining an immense popularity among the fresh graduates. You can also reach Dexlab Analytics to gain an insight of all the industry relevant courses and enrol yourself asap to speed up your career!
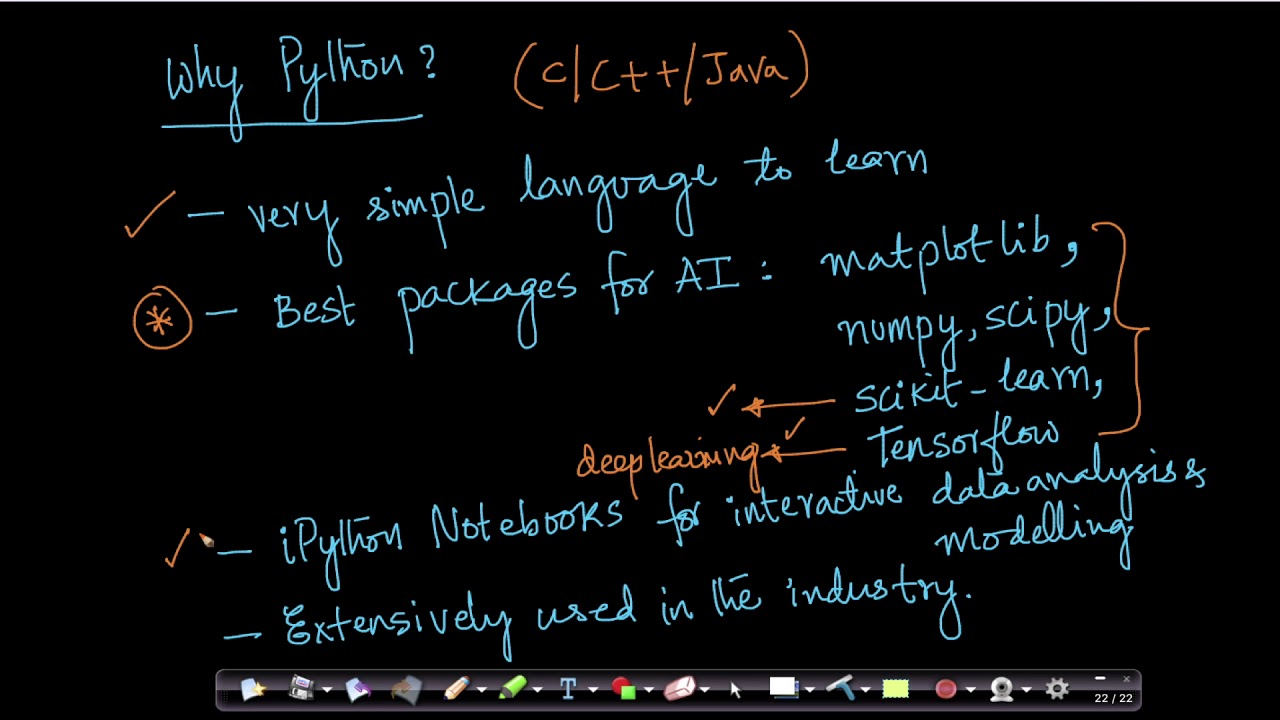
Deep Learning and AI using Python

Python

Python is undoubtedly the most demanding language ever in the history of computer science; hence, it enjoys all the attention that it gets.

With its welcoming nature to every other architecture, which is in sharp contradiction to Java and C++, Python is preferred all the way. Secondly, Python is quite a powerful language and effective too, when it comes to bulk data and a need to process them faster.

It is basically an open source program which is easy accessible and largely customised. This is really a gift for upcoming world of Data Science. Thus, Python for data analysis is an invaluable skill that you can develop to make yourself marketable like never before.

We hope you liked our post! You can Take A Deep Look On How Machine Learning Boosts Business Growth! and more such topics on our website.


Interested in a career in Data Analyst?

To learn more about Data Analyst with Advanced excel course – Enrol Now.
To learn more about Data Analyst with R Course – Enrol Now.
To learn more about Big Data Course – Enrol Now.

To learn more about Machine Learning Using Python and Spark – Enrol Now.
To learn more about Data Analyst with SAS Course – Enrol Now.
To learn more about Data Analyst with Apache Spark Course – Enrol Now.
To learn more about Data Analyst with Market Risk Analytics and Modelling Course – Enrol Now.

Hacking is Wide and Dangerous in India, CBI Reports

Hacking is Wide and Dangerous in India, CBI Reports

The recent conference organized by the Central Bureau of Investigation on Cyber forensic notes that over 22,000 websites were hacked in India between April 2017 – Jan 2018. Not the best of the news for the nation which is largely counting on their citizens to be tech-savvy.

In the conference, CBI disclosed of its plans to build a cutting edge Centralised Technology Vertical (CTV) to fight crimes, voiced by Minister of State for Personnel, Jitendra Singh. The CTV is a huge project involving around Rs 99 crore, which will not only share the real-time information about the cyber attacks but also of the perpetrators.

From young superintendents of police to top brass of security agencies, police forces, law enforcement officers and the Intelligence attended this conference and discussed about the alarming rise of cybercrimes throughout the country.

2

The Major Issue

Jurisdictional issues were a main problem and hit greatly on the investigation in these cases because most of the incidents of cybercrimes are triggered from foreign lands. Though the total loss of money from the recent cybercrimes weren’t disclosed, some debilitating cases in cybercrimes were dicussed once again, which included the loss of USD 171 million from union Bank of India’s Swift.

To End it

To lessen the magnitude of the cybercrimes, the CBI is on their way towards reinforcing them with the state of the art technology. Besides, you can also take up courses in PHP, HTML, Python Certification Training in Delhi, to be informed of the trending languages and be future proof.


Interested in a career in Data Analyst?

To learn more about Data Analyst with Advanced excel course – Enrol Now.
To learn more about Data Analyst with R Course – Enrol Now.
To learn more about Big Data Course – Enrol Now.

To learn more about Machine Learning Using Python and Spark – Enrol Now.
To learn more about Data Analyst with SAS Course – Enrol Now.
To learn more about Data Analyst with Apache Spark Course – Enrol Now.
To learn more about Data Analyst with Market Risk Analytics and Modelling Course – Enrol Now.

Application of Mode using R and Python

Application of Mode using R and Python

Mode, for a given set of observations, is that value of the variable, where the variable occurs with the maximum or the highest frequency.

This blog is in continuation with STATISTICAL APPLICATION IN R & PYTHON: CHAPTER 1 – MEASURE OF CENTRAL TENDENCY. However, here we will elucidate the Mode and its application using Python and R.

Mode is the most typical or prevalent value, and at times, represents the true characteristics of the distribution as a measure of central tendency.

Application:

The numbers of the telephone calls received in 245 successive one minute intervals at an exchange are shown in the following frequency distribution table:


No of Calls
Frequency
0
14
1
21
2
25
3
43
4
51
5
40
6
51
7
51
8
39
9
12
Total
245


 [Note: Here we assume total=245 when we calculate Mean from the same data]

Evaluate the Mode from the data.

Evaluate the Mode from the data

Calculate Mode in R:

Calculate mode in R from the data, i.e. the most frequent number in the data is 51.

The number 51 repeats itself in 5, 7 and 8 phone calls respectively.

Calculate Median in Python:

First, make a data frame for the data.

Now, calculate the mode from the data frame.

Calculate mode in Python from the data, i.e. the most frequent number in the data is 51.

The number 51 repeats itself in 5, 7 and 8 phone calls respectively.

Mode is used in business, because it is most likely to occur. Meteorological forecasts are, in fact, based on mode calculations.

The modal wage of a group of the workers is the wages which the largest numbers of workers receive, and as such, this wage may be considered as the representative wage of the group.

In this particular data set we use the mode function to know the occurrence of the highest number of phone calls.

It will thus, help the Telephone Exchange to analyze their data flawlessly.

2

Note – As you have already gone through this post, now, if you are interested to know about the Harmonic Mean, you can check our post on the APPLICATION OF HARMONIC MEAN USING R AND PYTHON.

Dexlab Analytics is a formidable institute for Deep learning for computer vision with PythonHere, you would also find more information about courses in Python, Deep LearningMachine Learning, and Neural Networks which will come with proper certification at the end.

We are there in the Social Media where you can follow us both in Facebook and Instagram.


Interested in a career in Data Analyst?

To learn more about Data Analyst with Advanced excel course – Enrol Now.
To learn more about Data Analyst with R Course – Enrol Now.
To learn more about Big Data Course – Enrol Now.

To learn more about Machine Learning Using Python and Spark – Enrol Now.
To learn more about Data Analyst with SAS Course – Enrol Now.
To learn more about Data Analyst with Apache Spark Course – Enrol Now.
To learn more about Data Analyst with Market Risk Analytics and Modelling Course – Enrol Now.

Application of Harmonic Mean using R and Python

Application of Harmonic Mean using R and Python

Harmonic mean, for a set of observations is the number of observations divided by the sum of the reciprocals of the values and it cannot be defined if some of the values are zero.

This blog is in continuation with STATISTICAL APPLICATION IN R & PYTHON: CHAPTER 1 – MEASURE OF CENTRAL TENDENCY. However, here we will discover Harmonic mean and its application using Python and R.

2

Application:

A milk company sold milk at the rates of 10,16.5,5,13.07,15.23,14.56,12.5,12,30,32, 15.5, 16 rupees per liter in twelve different months (January-December), If an equal amount of money is spent on milk by a family in the ten months. Calculate the average price in rupees per month.

Table for the problem:

Month

Rates (Rupees/Liter)

January

10

February

16.5

March

5

April

13.07

May

15.23

June

14.56

July

12.5

August

12

September

30

October

32

November

15.5

December

16

Calculate Harmonic Mean in R:-

So, the average rate of the milk in rupees/liter is 12.95349 = 13 Rs/liter (Approx)

We get this answer from the Harmonic Mean, calculated in R.

Calculate Harmonic Mean in Python:-

First, make a data frame of the available data in Python.

Now, calculate the Harmonic mean from the following data frame.

So, the average rate of the milk in rupees/liter is 12.953491609077956 = 13 Rs/Liter (Approx)

We get this answer from Harmonic mean, calculated in Python.

Summing it Up:

In this data, we have a few large values which are putting an effect on the average value, if we calculate the average in Arithmetic mean, but in Harmonic mean, we get a perfect average from the data, and also for calculating the average rate.

Use of Harmonic mean is very limited. Harmonic mean gives the largest value to the smallest item and smallest value to the largest item.

Where there are a few extremely large or small values, Harmonic mean is preferable to Arithmetic mean as an average.

The Harmonic mean is mainly useful in averages involving time, rate & price.

Deep Learning and AI using Python

Note – If you want to learn the calculation of Geometric Mean, you can check our post on CALCULATING GEOMETRIC MEAN USING R AND PYTHON.

Dexlab Analytics is a peerless institute for Python Certification Training in Delhi. Therefore, for tailor-made courses in Python, Deep Learning, Machine Learning, Neural Networks, reach us ASAP!

You can even follow us on Social Media. We are available both in Facebook and Instagram.


Interested in a career in Data Analyst?

To learn more about Data Analyst with Advanced excel course – Enrol Now.
To learn more about Data Analyst with R Course – Enrol Now.
To learn more about Big Data Course – Enrol Now.

To learn more about Machine Learning Using Python and Spark – Enrol Now.
To learn more about Data Analyst with SAS Course – Enrol Now.
To learn more about Data Analyst with Apache Spark Course – Enrol Now.
To learn more about Data Analyst with Market Risk Analytics and Modelling Course – Enrol Now.

Python is the Leader in Data Science: Know Why

Python is the Leader in Data Science: Know Why

From being simple and effective to being updated and thereby, solving almost everything that the booming industry of Data Science of today can look up to, Python boasts of it all.

It’s not a shock that Python is finding its uses in an array of industries. It is, in fact, the language that the Data Scientists rely on. Thus, our tailored courses of Python Certification Training in Delhi would be helpful for all in this digital age.

Let’s see some more of the advantages for which Python stands distinguished among the other programming languages:

Handling Data without a Hassle

The field of Data Science is entrusted with the handling of incredibly large amounts of data which is found to be intricate to compute. However, with Python, it is now simpler than ever. Any of the other high-level programming languages would make it rather difficult and messy compared to the peerless Python, if we talk about analytical and quantitative computing.

Open Source Programming Language

Python is an open-source programming language. Wonder why this programming language is the most preferred still?

It truly opens a whole lot of opportunities that the language can build upon, being open-source in nature. Furthermore, there is not a single restriction regarding Python. Thus, you can be as creative as you wish on this programming language.

It is Powerful and Easy to Use

Python is an easy language right from the start for which it has become so popular. Any of the beginners with just the rudimentary knowledge can start fine with Python. Besides, once you are on with this programming language, you can start progressing with it day by day at your own pace.

The implementation of the code has a slower approach in the languages: Java, C and C#, but if you try Python, you would discover that it is fast to debug and effective to perform. The prompt results in coding would aid with an added boost in your work.

In the Library of Python

Python is an all-absorbing language that even supports the cutting edge technologies of Machine Learning and Artificial Intelligence. And on top of it, Python also offers its users a colossal database of libraries. Therefore, you can simply check in the libraries, import them and then implement all of them in your day to day coding.

It is Highly Scalable

In the parameter of scalability, Python superbly stands out. The programming languages: R and Java certainly falls short in this factor. Thus, with the ease of scalability and quicker turnaround times, data scientists and nearly all of the organisations exploring Data Science, are choosing Python over any other existing languages.

Data Science Machine Learning Certification

It is Peerless in Visualisation and Graphics

As the smooth rendering of quality graphics and visualisation is the demand of the age, Python fits in quite comfortably here. With an exhaustive range of options for visualisation, which are simple and efficient, the world of Data Science is rooting for Python.

With all the benefits that you can reap, Python for data analysis is a must, if you want to be absorbed in the industry of Data Science.


.

Statistical Application In R & Python: Chapter 1 – Measure Of Central Tendency

Statistical Applcation In R & Python: Chapter 1 – Measure Of Central Tendency

Statistical analysis helps explore data relationship and develop high-end models to frame better decisions. It’s an intricate process of collecting and evaluating data to define the nature of data that has to be analyzed.

Below, we dig into the basics of statistical application in R and Python using the measure of central tendency.

  • Introduction:-

As body methods for the study of numerical data, if some rows or columns are too long, in such cases, it becomes necessary to summarize data in an easily manageable form. The purpose is to serve by classifying the data in the form of frequency distribution and various graphs. When data relate to a variable, the process of summarization can be taken a step further by using certain descriptive measures. The dim is to focus on certain features that are central frequency and description.

2

  • Central Tendency :

In a set of data, they have a tendency, notwithstanding their variability, to cluster-around a central value and the tendency of the quantitative statistical observations is called central tendency.

The three measures of the central tendency are commonly used is:-

  • Mean
  • Median
  • Mode

The description of these 3 estimators start below:-

  • Mean:-

Mean is the average of central tendency and is the most commonly used measures.

The concept of mean is divided into three parts:-

  • Arithmetic mean.
  • Geometric mean.
  • Harmonic mean.

Mainly the mean refers to an arithmetic mean.

  • Arithmetic Mean (A.M.):-

The arithmetic mean of a set of observations is defined to be their sum, divided by the number of observations.

For n numbers of observation (x1,x2,… ,xn )

  • Weighted A.M.

For frequency distribution where  have  frequencies. (i=1,2,3…)

  • Application of A.M.:-

Let’s, calculate the mean of Age, Height & Weight from the given data.

NameSexAgeHeightWeight
RiteshM246.9112.5
HeenaF235.6584
KritikaF236.5398
AnuradhaF246.28102.5
GauravM246.35102.5
PrakashM225.7383
AartiF225.9884.5
MeenaF256.25112.5
UtkarshM236.2584
ChiragM225.999.5
NehaF215.1350.5
SmritaF246.4390

Calculating Mean in Python:

Therefore,

Age (Mean) = 23.08333333, Height (Mean) = 6.12, weight(Mean) = 85.625

Calculating Mean in R:

  • Application of Weighted A.M.:-

The weighted mean is denoted that the mean with frequency.

Data to solve:

Calculate the average price per ton of coal purchased by the industry for the half-year.

Month

Price Per TonTons Purchased

January

Rs. 52.4926

February

Rs. 62.2334
MarchRs. 87.26

40

AprilRs. 45.25

54

MayRs. 78.56

13

June

Rs. 69.25

45

Data to solve:

Month

Price (Rs)

Per Ton

(x)

Tons

Purchased

(f)

fx=y

(Main Data)

January

 52.49261364.74

February

 62.2334

2115.82

March

 87.2640

3490.4

April

45.2554

2443.5

May

 78.5613

1021.28

June

69.2545

3116.25

Total395.04N=212

13551.99


The price is denoted as x (52.49, 62.23, 87.26, 45.25, 78.56, 69.25 [in Rs.])=395.04

The amount of purchased (frequency) is denoted by f (26, 34, 40, 54, 13, 45) = 212 (N)

Then multiply the x and f and we get the total amount which is denoted by y, fx(y) = 13551.99

Calculate Weighted Mean in R:

Calculate Weighted Mean in Python:

To calculate the weighted mean from R & Python we get the same result = 63.9244811.

Want to know more about the nature of data? Keen to perform high-end statistical analysis using Python and R? Follow DexLab Analytics, an excellent Python training center in Gurgaon, India. Our team of consultants will help you learn the basics of R and Python in the easiest manner possible.


Interested in a career in Data Analyst?

To learn more about Data Analyst with Advanced excel course – Enrol Now.
To learn more about Data Analyst with R Course – Enrol Now.
To learn more about Big Data Course – Enrol Now.

To learn more about Machine Learning Using Python and Spark – Enrol Now.
To learn more about Data Analyst with SAS Course – Enrol Now.
To learn more about Data Analyst with Apache Spark Course – Enrol Now.
To learn more about Data Analyst with Market Risk Analytics and Modelling Course – Enrol Now.

Demand for Data Analysts is Skyrocketing – Explained

Demand for Data Analysts is Skyrocketing - Explained

The salary of analytics professionals outnumbers that of software engineers by more than 26%. The wave of big data analytics is taking the world by storm. If you follow the latest studies, you will discover that there has been a prominent growth in median salary over several experience levels in the past three years (2016 to 2018). In 2019, the average analytics salary has been capped at 12.6 lakh per annum.

The key takeaway is that the salary structure of analytics professionals continues to beat other tech-related job roles. In fact, data analysts are found out-earning their Java correspondents by nearly 50% in India alone. A latest survey provides an encompassing view of base and compensation salaries in data science along with median salaries followed across diverse job categories, regions, education profiles, experience, tools and skills.

In this regard, a spokesperson of a prominent data analytics learning institute was found saying, “The demand for AI skills is expected to increase rapidly, which is also reflected by the fact that AI engineers command a higher salary than peers.” She further added, “Many of our clients have realized that investing in data-driven skills at the leadership level is a determining factor for the success of digital and AI initiatives in the organization. With the increasing adoption of digital technologies, we expect an enduring growth of Data Science and AI initiatives to offer exciting and lucrative career options to new age professionals,”

Over time, we are witnessing how markets are evolving while the demand for skilled data scientists is following an upward trend. It is not only the technology firms that are posting job offers, but the change is also evident across industries, like retail, medical, retail and CPG amongst others. These sectors are enhancing their analytical capabilities implying an automatic increase in the number of data-centric jobs and recruitment of data scientists.

Points to Consider:

  • In the beginning, nearly 76% of data analysts earn 6-lakh figure per annum.
  • The average analytics salary observed in 2018-19 is 12.6 lakh.
  • In terms of analytics career, Mumbai offers the highest compensation of 13.7 lakh yearly, followed by Bangalore at 13 lakh.
  • Mid-level professionals proficient in data analytics are more in demand.
  • Knowing Python is an added advantage; Python Programming training will help you earn more. Expect a package of 15.1 lakh.
  • Nevertheless, we often see a pay disparity for female data scientists against their male counterparts. While women’s take-home salary is 9.2 lakh, male from the same designation and profession earns 13.7 lakh per annum.

2

As endnotes, the demand for data science skills is skyrocketing. If you want to enter into this flourishing job market, this is the best time! Enroll in a good data analyst course in Delhi and mould your career in the shape of success! DexLab Analytics is a top-notch data analyst training institute that offers a plethora of in-demand skill training courses. Reach us for more.


This article has been sourced fromwww.tribuneindia.com/news/jobs-careers/data-analytics-professionals-ride-the-big-data-wave/759602.html


Interested in a career in Data Analyst?

To learn more about Data Analyst with Advanced excel course – Enrol Now.
To learn more about Data Analyst with R Course – Enrol Now.
To learn more about Big Data Course – Enrol Now.

To learn more about Machine Learning Using Python and Spark – Enrol Now.
To learn more about Data Analyst with SAS Course – Enrol Now.
To learn more about Data Analyst with Apache Spark Course – Enrol Now.
To learn more about Data Analyst with Market Risk Analytics and Modelling Course – Enrol Now.

Top 4 Python Industrial Use-Cases: Explained

Top 4 Python Industrial Use-Cases: Explained

Dexlab ____ YOutube subscriber

Python is one of the fastest-growing and most popular coding languages in the world; a large number of developers use it on daily basis and why not, it works brilliantly for a plethora of developer job roles and data science positions – starting from scripting solution for sysadmins to supporting machine learning algorithms to fueling web development, Python can work wonders across myriad platforms!

Below, we’ve rounded up 4 amazing Python industrial use-cases; scroll ahead:

Insurance

Widely used in generating business insights; courtesy machine learning.

Case Study:

Smaller firms driven by machine learning gave stiff competition to a US multinational finance and insurance corporation. In return, the insurer formed teams and devised a new set of services and applications based on ML algorithms to enjoy a competitive edge. However, the challenge was that with so many data science tools, numerous versions of Python came into the picture and gave rise to compatibility issues. As a result, the company finalized only one version of Python, which was then used in line with machine learning algorithms and tools to derive specific results.

Data Science Machine Learning Certification

Finance

Data mining helps determine cross-sell opportunities.

Case Study:

Another US MNC dealing in financial services showed interest in mining complex customer behavioral data. Using Python, the company launched a series of ML and data science initiatives to dig into its structured data that it has been gathering for years and correlated it with an army of unstructured data, gathered from social media and web to enhance cross-selling and retrieve resources.

Aerospace

Python helps in meeting system deadlines and ensured utmost confidentiality.

Case Study:

Recently, the International Space Station struck a deal with an American MNC dealing in military, defense and aerospace technology; the latter has been asked to provide a series of systems to the ISS. The critical safety systems were mostly written in languages, like Ada; they didn’t fare well in terms of scripting tasks, data science analysis or GUI creation. That’s why Python was chosen; it offered bigger contract value and minimum exposure.

Retail Banking

Enjoy flexible data manipulation and transformation – all with Python!

Case Study:

A top-notch US department store chain equipped with an in-store banking division gathered data and stored it in a warehouse. The main aim of the company was to share the information with multiple platforms to fulfill its supply chain, analytics, retail banking and reporting needs. Though the company chose Python for on-point data manipulation, each division came up with their own versions of Python, resulting in a new array of issues. In the end, the company decided to keep a standard Python; this initiative not only resulted in amplifying engineering speed but also reduced support costs.

As end notes, Python is the next go-to language and is growing each day. If you have dreams of becoming an aspiring programmer, you need to book the best Python Certification Training in Delhi. DexLab Analytics is a premier Python training institute in Delhi; besides Python, it offers in-demand skill development courses for interested candidates.


The blog has been sourced from www.techrepublic.com/article/python-5-use-cases-for-programmers


Interested in a career in Data Analyst?

To learn more about Data Analyst with Advanced excel course – Enrol Now.
To learn more about Data Analyst with R Course – Enrol Now.
To learn more about Big Data Course – Enrol Now.

To learn more about Machine Learning Using Python and Spark – Enrol Now.
To learn more about Data Analyst with SAS Course – Enrol Now.
To learn more about Data Analyst with Apache Spark Course – Enrol Now.
To learn more about Data Analyst with Market Risk Analytics and Modelling Course – Enrol Now.

Decoding the Equation of AI, Machine Learning and Python

Decoding the Equation of AI, Machine Learning and Python

AI is an absolute delight. Not only is it considered one of the most advanced fields in the present computer science realm but also AI is a profit-spinning tool leveraged across diverse industry verticals.

In the past few years, Python also seems to be garnering enough fame and popularity. Ideal for web application development, process automation, web scripting, this wonder tool is a very potent programming language in the world. But, what makes it so special?

Owing to ease of scalability, learning and adaptability of Python, this advanced interpreted programming language is the fastest growing global language. Plus, its ever-evolving libraries aid it in becoming a popular choice for projects, like mobile app, data science, web app, IoT, AI and many others.

Python, Machine Learning, AI: Their Equation

Be it startups, MNCs or government organizations, Python seem to be winning every sector. It provides a wide array of benefits without limiting itself to just one activity – its popularity lies in its ability to combine some of the most complex processes, including machine learning, artificial intelligence, data science and natural language processing.

Deep learning can be explained as a subset of a wider arena of machine learning. From the name itself you can fathom that deep learning is an advanced version of machine learning where intelligence is being harnessed by a machine generating an optimal or sub-optimal solution.

Combining Python and AI

Lesser Coding

AI is mostly about algorithms, while Python is perfect for developers who are into testing. In fact, it supports writing and execution of codes. Hence, when you fuse Python and AI, you drastically reduce the amount of coding, which is great in all respects.

Encompassing Libraries

Python is full of libraries, subject to the on-going project. For an instance, you can use Numpy if you are into scientific computation – for advanced computing, you have put your bet on SciPy – whereas, for machine learning, PyBrain is the best answer.

A Host of Resources

Entirely open source powered by a versatile community, Python provides incredible support to developers who want to learn fast and work faster. The huge community of web developers are active worldwide and willing to offer help at any stage of the development cycle.

Better Flexibility

Python is versatile. It can be used for a variety of purposes, right from OOPs approach to scripting. Also, it performs as a quintessential back-end and successfully links different data structures with one another.

Perfect for Today’s Millennial

Thanks to its flexibility and versatility, Python is widely popular amongst the millennials. You might be surprised to hear that it is fairly easier to find out Python developers than finding out Prolog or LISP programmers, especially in some countries. Encompassing libraries and great community support helps Python become the hottest programming language of the 21st century.

Data Science Machine Learning Certification

Some of the most popular Python libraries for AI are:

  • AIMA
  • pyDatalog
  • SimpleAI
  • EasyAI

Want to ace problem-solving skills and accomplish project goals, Machine Learning Using Python is a sure bet. With DexLab Analytics, a recognized Python Training Center in Gurgaon, you can easily learn the fundamentals and advance sections of Python programming language and score goals of success.


The blog has been sourced from ― www.information-age.com/ai-machine-learning-python-123477066


.

Call us to know more