Data Science is the new rage and if you are looking to make a career, you might as well choose to become a data scientist. Data Scientists work with large sets of data to draw valuable insights that can be worked upon. Businesses rely on data scientists to sieve through tonnes of data and mine out crucial information that becomes the bedrock of business decisions in the future.
With the growth of AI, machine learning and predictive analytics, data science has come to be one of the favoured career choices in the world today. It is imperative for a data scientist to know one of more programming languages from any of those available – Java, R, Python, Scala or MATLAB.
However, Data Scientists prefer Python to other programming languages because of a number of reasons. Here we delve into some of them.
Popular
Python is one of the most popular programming languages used today. This dynamic language is easy to pick up and learn and is the best option for beginners. Secondly, it interfaces with complex high performance algorithms written in Fortran or C. It is also used for web development, data mining and scientific computing, among others.
Preferred for Data Science
Python solves most of the daily tasks a data scientist is expected to perform. “For data scientists who need to incorporate statistical code into production databases or integrate data with web-based applications, Python is often the ideal choice. It is also ideal for implementing algorithms, which is something that data scientists need to do often,” says a report.
Packages
Python has a number of very useful packages tailored for specific functions, including pandas, NumPy and SciPy. Data Scientists working on machine learning tasks find scikit-learn useful and Matplotlib is a perfect solution for graphical representation and data visualization in data science projects.
Easy to learn
It is easy to grasp and that is why not only beginners but busy professionals also choose to learn Python for their data science needs. Compared to R, this programming language shows a sharper learning curve for most people choosing to learn it.
Scalability
Unlike other programming languages, Python is highly scalable and perceptive to change. It is also faster than languages like MATLAB. It facilitates scale and gives data scientists multiple ways to approach a problem. This is one of the reasons why Youtube migrated to Python.
Libraries
Python offers access to a wide range of data science and data analysis libraries. These include pandas, NumPy, SciPy, StatsModels, and scikit-learn. And Python will keep building on these and adding to these. These libraries have made many hitherto unsolvable problems seem easy to crack for data scientists.
Python Community
Python has a very robust community and many data science professionals are willing to create new data science libraries for Python users. The Python community is tight-knit one and very active when it comes to finding a solution. Programmers can connect with community members over the Internet and Codementor or Stack Overflow.
So, that is why data scientists tend to opt for Python over other programming languages. This article was brought to you by DexLab Analytics. DexLab Analytics is premiere data science training institute in Gurgaon.
Our industry experts introduce beginners to Machine Learning Algorithms with Python. In this blog, we will go through various Machine Learning Algorithms to understand the concepts better. This is the first part of a series.
Machine Learning, a subset of Artificial Intelligence, is a process of data analysis that automates analytical model building. It is a branch of artificial intelligence based on the idea that computing systems can learn from data, identify patterns in them and make intelligent decisions with minimal human intervention.
Parametric and Non-Parametric ML Algorithms
We first divide the mathematical methods for decision making in to sections – parametric and non-parametric algorithms. Parametric has a functional form while non-parametric has no functional form.
Functional form comprises a simple formula like 2+2=4 or Y=F(X). So if you input a value, you are to get a fixed output value. That means, if the data set is changed or being changed, there is not much variation in the results. But in non-parametric algorithms, a small change in data sets can result in a large change in the results.
But we do not desire this. We do not want this massive change in results in investments, for instance. We have various ways to solve this difficulty. For example, in statistics, you must have learnt the Central Limit Theorem – As the number of samples increase, the data will start following the normal distribution.
Here is an experiment on decision making with the help of non-parametric algorithm. We first take a random sample, and we apply an algorithm to it to get a result. We repeat this process several times and get an average of the results. In this way, the variation in our results goes down considerably. We will get a central tendency.
Take for example stock market data where prices are totally random. There is no fixed pattern to it. It is a manmade phenomenon. In the same way, we can make predictions in data sets only when there is a particular pattern. It becomes that much more difficult to make predictions in the absence of a clear pattern. In such a case, we take thousands of samples and work them to get a result before investing. We can use a Decision Tree like Random Forest for this.
Supervised and Unsupervised Algorithms
Now, secondly, we can term ML algorithms as supervised or unsupervised algorithms. Suppose we have data under sub-heads – Name, Age, Gender and Salary and Period of Service. Now, consider the model wherein we are asked to predict the period of service of an employee based on data provided under the rest of the sub-heads based on existing employee data.
Now, in this example, the period of service is the Target. The data sets on the basis of which the prediction will be made – Name, Age, Gender, Salary – is the Input. In such a model, where the target variable is specified, we term it as supervised machine learning algorithm. We do this according to a formula – Y=B0 + B1X1.
In unsupervised learning, the target variable is not provided and all we can do is divide the historical data in clusters. For example, Google Translate runs on a supervised model as do chatbots. Data is not only the new oil, it is everything. And there will come a time of data colonisation whereby the organisation with the best data will rule. The better the date, the better our ML models. Who has the best data sets in the world? Google and Amazon, among others, do.
So this is it, about supervised and unsupervised machine learning. For more on this, do watch our intensive video tutorial on ML algorithms.
(Translated till first 28:00 minutes)
This is the first blog of the series, stay tuned with Dexlab Analytics to read through the whole video we’ll covering in our upcoming blogs!
Today we are going to learn about the new releases from Scikit-learn version 0.22, a machine learning library in Python. First we learn how to install it on our systems. Then, we come to the much talked about new release called stacking regression.
Now, how does stacking regression work? Well, you have been using machine learning algorithms like Decision Tree or Random Forest. Have you heard of Voter Classifier? It is an algorithm in Scikit-learn. Ensemble algorithm is a combination of two or more algorithms to make it stronger.
When working on a set of data, we must apply all these algorithms to get predicted values. Then we vote out classified predicted values in Voter Classifier. Stacking Classifier is different. What we are doing in it is stacking together the predicted values to make a new input.
Initially, we make prediction by using various algorithms separately. Their results or output are then concatenated together. Then we use this output as a new input and apply the algorithms to it to get target variable. This method is known as stacking regression.
We try this out on a data set that can be taken from a github repository the link to which is given below.
Then we use two algorithms as estimators. Then we use stacking regression to build a model. For more on this do watch the video attached herewith. This tutorial was brought to you by DexLab Analytics. DexLab Analytics is a premiere Machine Learning institute in Gurgaon.
The COVID-19 pandemic has hit us hard as a people and forced us to bow down to the vagaries of nature. As of April 29, 2020, the number of persons infected stands at 31,39,523 while the number of persons dead stands at 2,18,024 globally.
This essay is on the phenomenon of detecting geographical variations in the mortality rate of the COVID-19 epidemic. This essay explores a specific range of latitudes along which a rapid spread of the infection has been detected with the help of data sets on Kaggle. The findings are Dexlab Analytics’ own. Dexlab Analytics is a premiere institute that trains professionals in python for data analysis.
For the code sheet and data used in this study, click below.
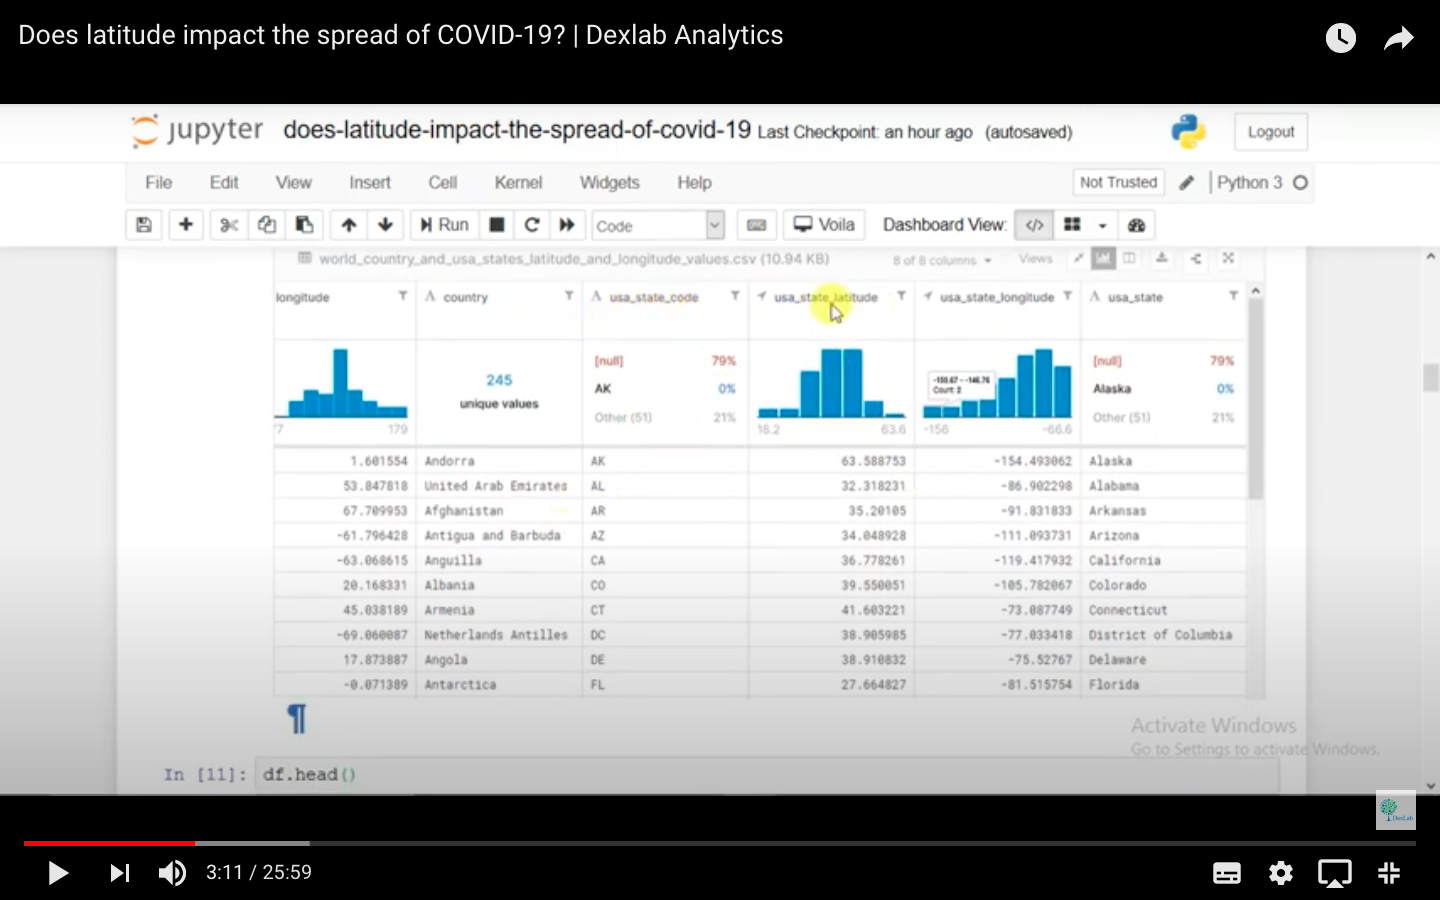
The instructor has imported all Python libraries and the visualisation of data hosted on Kaggle has been done through a heat map. The data is listed on the basis of country codes and their latitudes and there is a separate data set based on the figures from the USA alone.
Fig. 1.
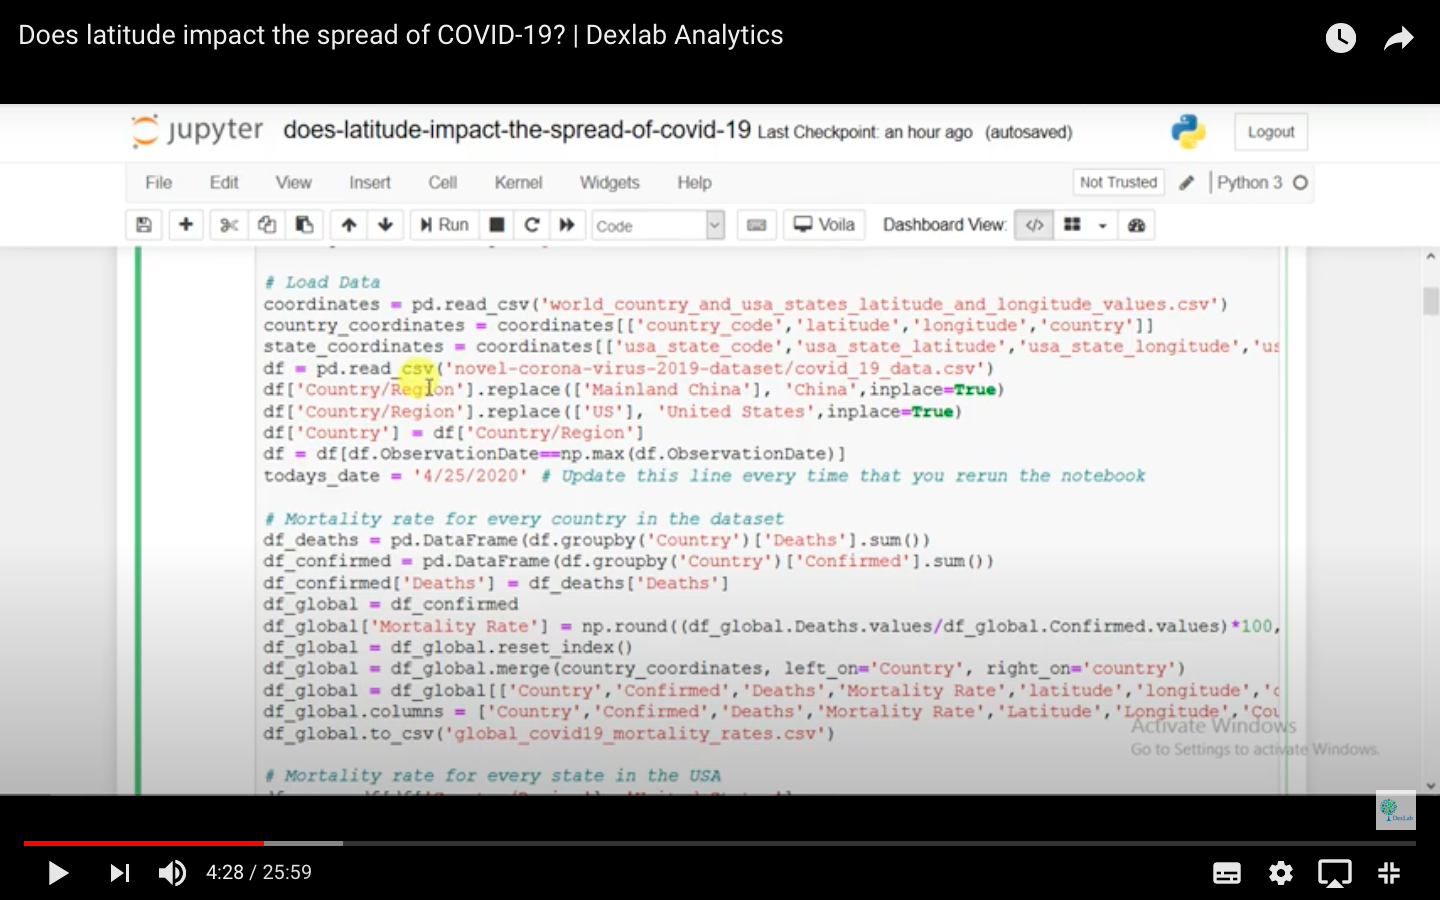
The instructor has compared data from amongst the countries in one scenario and among states in the USA in another scenario. Data has been prepared and structured under these two heads.
Fig. 2.
The instructor has prepared the data according to the mortality rate of each country and it is updated to the very day of working on the data, i.e. the latest updated figures are presented in the study. When the instructor runs the program, a heat map is produced.
For more on this, do go through the half-an-hour long program video attached herewith. The rest of the essay will be featured in subsequent parts of this series of articles.
Python has become one of the leading coding languages across the globe and for more reasons than one. In this article, we evaluate why Python is beneficial in the use of Machine Learning and Artificial Intelligence applications.
Artificial intelligence and Machine Learning are profoundly shaping the world we live in, with new applications mushrooming by the day. Competent designers are choosing Python as their go-to programming language for designing AI and ML programs.
Artificial Intelligence enables music platforms like Spotify to prescribe melodies to users and streaming platforms like Netflix to understand what shows viewers would like to watch based on their tastes and preferences. The science is widely being used to power organizations with worker efficiency and self-administration.
Machine-driven intelligence ventures are different from traditional programming languages in that they have innovation stack and the ability to accommodate an AI-based experiment. Python has these features and more. It is a steady programming language, it is adaptable and has accessible instruments.
Here are some features of Python that enable AI engineers to build gainful products.
An exemplary library environment
“An extraordinary selection of libraries is one of the primary reasons Python is the most mainstream programming language utilized for AI”, a report says. Python libraries are very extensive in nature and enable designers to perform useful activities without the need to code them from scratch.
Machine Learning demands incessant information preparation, and Python’s libraries allows you to access, deal with and change information. These are libraries can be used for ML and AI: Pandas, Keras, TensorFlow, Matplotlib, NLTK, Scikit-picture, PyBrain, Caffe, Stats models and in the PyPI storehouse, you can find and look at more Python libraries.
Basic and predictable
Python has on offer short and decipherable code. Python’s effortless built allows engineers to make and design robust frameworks. Designers can straightway concentrate on tackling an ML issue rather concentrating on the subtleties of the programming language.
Moreover, Python is easy to learn and therefore being adopted by more and more designers who can easily construct models for AI. Also, many software engineers feel Python is more intuitive than other programming languages.
A low entry barrier
Working in the ML and AI industry means an engineer will have to manage tons of information in a prodigious way. The low section hindrance or low entry barrier allows more information researchers to rapidly understand Python and begin using it for AI advancement without wasting time or energy learning the language.
Moreover, Python programming language is in simple English with a straightforward syntax which makes it very readable and easy to understand.
Conclusion
Thus, we have seen how advantageous Python is as a programming language which can be used to build AI models with ease and agility. It has a broad choice of AI explicit libraries and its basic grammar and readability make the language accessible to non-developers.
Python has become the lingua franca of the computing world. It has come to become the most sought after programming language for deep learning, machine learning and artificial intelligence. It is a favourite with programmers because it is easy to understand and learn and it achieves a lot more in terms of productivity as compared to other languages.
Python is a dynamic, high-level, general-purpose programming language that is useful for developing desktop, web and mobile applications that can also be used for complex scientific and numeric applications, data science, AI etc. Python focuses a lot on code readability.
From web and game development to machine learning, from AI to scientific computing and academic research, Data science and analysis, python is regarded as the real deal. Python is useful in domains like finance, social media, biotech etc. Developing large software applications in Python is also simpler due to its large amount of available libraries.
The Python developer usually deals with backend components, apps connection with third-party web services and giving support to frontend developers in web applications. Of course, one might create applications with use of different languages but pretty often Python is the language chosen for it – and there are several reasons for that.
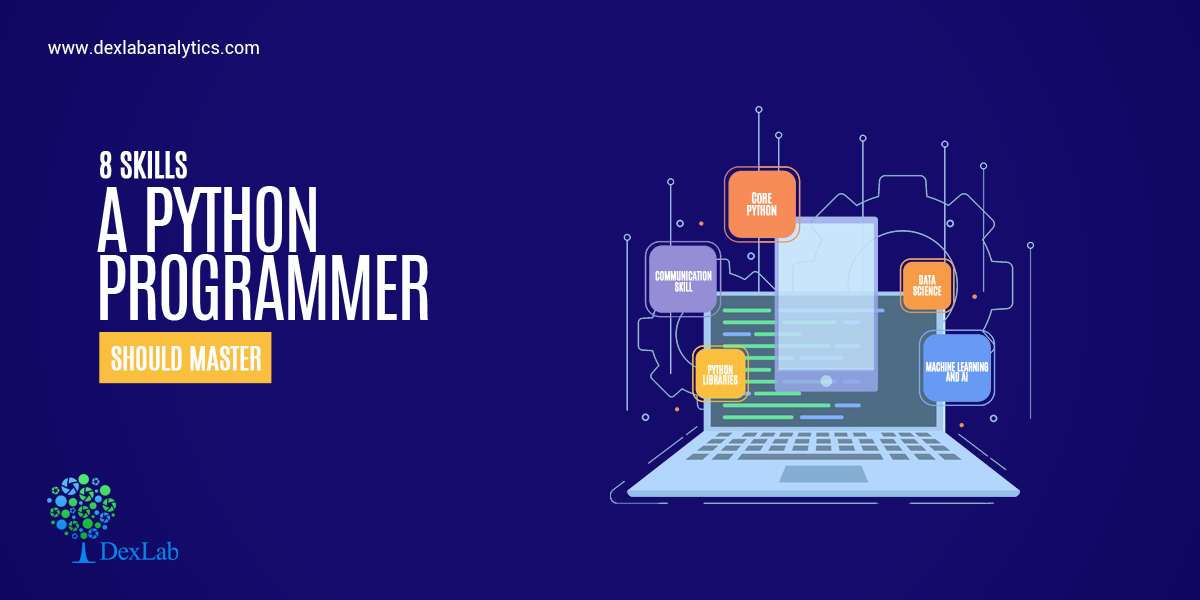
In this article, we will walk through a structured approach to top 8 skills required to become a Python Developer. These skills are:
Core Python
Good grasp of Web Frameworks
Front-End Technologies
Data Science
Machine Learning and AI
Python Libraries
Multi-Process Architecture
Communication Skills
Core Python
This is the foundation of any Python developer. If one wants to achieve success in this career, he/she needs to understand the core python concepts. These include the following:
Iterators
Data Structures
Generators
OOPs concepts
Exception Handling
File handling concepts
Variables and data types
However, learning the core language (as mentioned above) is only the first step in mastering this language and becoming a successful Python developer.
Good grasp of Web Frameworks
By automating the implementation of redundant tasks, frameworks cut development time and enable developers to focus greatly on application logic rather than routine elements.
Because it is one of the leading programming languages, there is no scarcity of frameworks for Python. Different frameworks have their own set of advantages and issues. Hence, the selection needs to be made on the basis of project requirements and developer preference. There are primarily three types of Python frameworks, namely full-stack, micro-framework, and asynchronous.
A good Python web developer has incredible honing over either of the two web frameworks Django or Flask or both. Django is a high-level Python Web Framework that encourages a good, clean and pragmatic design and Flask is also widely used Python micro web framework.
Front-End Technologies (JavaScript, CSS3, HTML5)
Sometimes, Python developers must work with the frontend team to match together the server-side and the client-side. This means Python developers need a basic understanding of how the frontend works, what’s possible and what’s not, and how the application will appear.
While there is likely a UX team, SCRUM master, and project or product manager to coordinate the workflow, it’s still good to have a basic understanding of front-end tasks.
Data Science
Data science offers a world of new opportunities. Being a Python developer, there are several prerequisites you need to know starting with things you learn in high school mathematics, such as statistics, probability, etc. Some of the other parts of data science you need to understand, and use include SQL knowledge; the use of Python packages, data wrangling and data cleanup, analysis of data, and visualization of data.
Artificial Intelligence and Machine Learning
Artificial Intelligence and Machine Learning (as well as Deep Learning) are constantly growing. Python is the perfect programming language which is used in all the frameworks of Machine Learning and Deep Learning. This will be a huge plus for someone if he/she knows about this domain. If someone is into data science, then definitely digging in the Machine Learning topic would be a great idea.
Python Libraries
Python libraries certainly deserve a place in every Python Developer’s toolbox. Python has a massive collection of libraries, both native and third-party libraries. With so many Python libraries out there, though, it’s no surprise that some don’t get all the attention they deserve. Plus, programmers who work exclusively in one domain don’t always know about the goodies available to them for other kinds of work.
Python libraries are extensively used in simplifying everything from file system access, database programming, and working with cloud services to building lightweight web apps, creating GUIs, and working with images, ebooks, and Word files—and much more.
Multiprocessing Architecture
Multiprocessing refers to the ability of a system to support more than one processor at the same time. Applications in a multiprocessing system are broken to smaller routines that run independently. The operating system allocates these threads to the processors improving performance of the system. As a Python-Developer one should definitely know about the MVC (Model View Controller) and MVT (Model View Template) Architecture. Once you understand the Multi-Processing Architecture you can solve issues related to the core framework etc.
Communication Skills
In best software development firms the teams are made out of amazing programmers which work together to achieve the final goal – no matter if it means to finish the project, to create a new app or maybe to help a startup. However, working in a team means that a developer has to communicate well – not only to get the stuff done but also to keep the documentation clear so others can easily read and follow the thinking path to fully understand the idea.
Conclusion
In this write-up, we have elaborated on the top skills one needs to have to be a successful Python Developer. One must have a working knowledge of Core Python and a good grasp of Web Frameworks, Front-End Technologies, Data Science, Machine Learning and AI, Python Libraries, Multi-Process Architecture and Communication skills. Though there are a few more skills not listed in this blog, one can achieve success in developing large software applications by mastering all the above skills only.
As delineated in the article, Python is the new rage in the computing world. And it is no surprise then that more and more professionals are opting to take up courses teaching Machine learning using Python and python for data analysis.
Interested in a career in Data Analyst?
To learn more about Data Analyst with Advanced excel course – Enrol Now. To learn more about Data Analyst with R Course – Enrol Now. To learn more about Big Data Course – Enrol Now.
To learn more about Machine Learning Using Python and Spark – Enrol Now. To learn more about Data Analyst with SAS Course – Enrol Now. To learn more about Data Analyst with Apache Spark Course – Enrol Now. To learn more about Data Analyst with Market Risk Analytics and Modelling Course – Enrol Now.
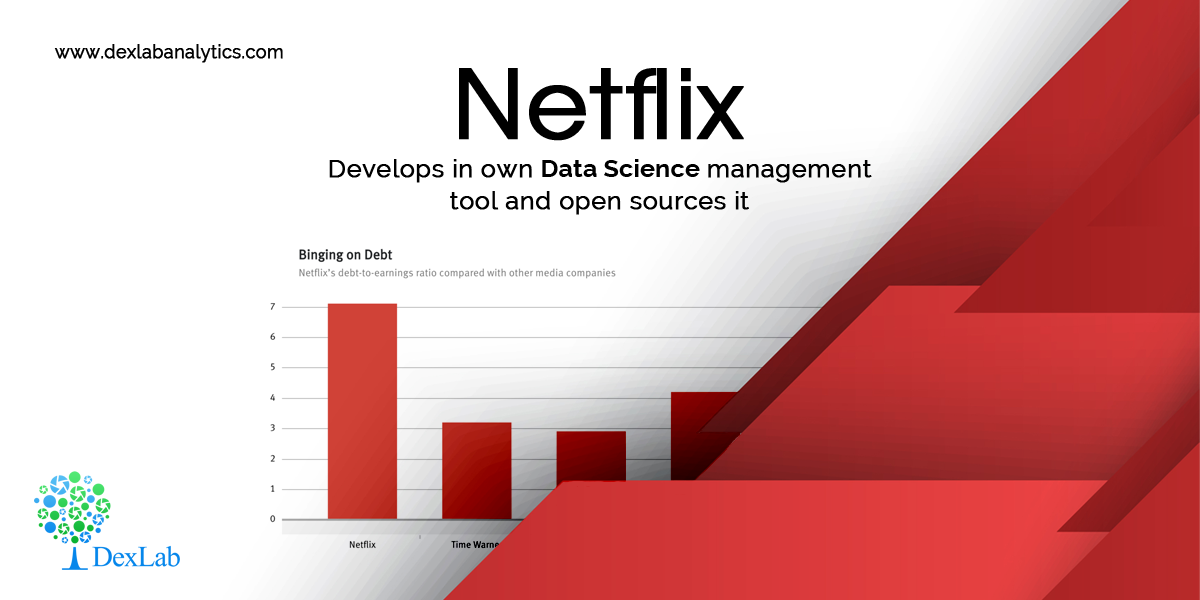
Netflix in December last year introduced its own python framework called Metaflow. It was developed to apply to data science with a vision to make scalability a seamless proposition. Metaflow’s biggest strength is that it makes running the pipeline (constructed as a series of steps in a graph) easily movable from a stationary machine to cloud platforms (currently only the Amazon Web Services (AWS)).
What does Metaflow really do? Well, it primarily “provides a layer of abstraction” on computing resources. What it translates to is the fact that a programmer can concentrate on writing/working code while Metaflow will handle the aspect which ensures the code runs on machines.
Metaflow manages and oversees Python data science projects addressing the entire data science workflow (from prototype to model deployment), works with various machine learning libraries and amalgamates with AWS.
Machine learning and data science projects require systems to follow and track the trajectory and development of the code, data, and models. Doing this task manually is prone to mistakes and errors. Moreover, source code management tools like Git are not at all well-suited to doing these tasks.
Metaflow provides Python Application Programming Interfaces (APIs) to the entire stack of technologies in a data science workflow, from access to the data, versioning, model training, scheduling, and model deployment, says a report.
Netflix built Metaflow to provide its own data scientists and developers with “a unified API to the infrastructure stack that is required to execute data science projects, from prototype to production,” and to “focus on the widest variety of ML use cases, many of which are small or medium-sized, which many companies face on a day to day basis”, Metaflow’s introductory documentation says.
Metaflow is not biased. It does not favor any one machine learning framework or data science library over another. The video-streaming giant deploys machine learning across all aspects of its business, from screenplay analysis, to optimizing production schedules and pricing. It is bent on using Python to the best limits the programming language can stretch. For the best Data Science Courses in Gurgaon or Python training institute in Delhi, you can check out the Dexlab Analytics courses online.
Interested in a career in Data Analyst?
To learn more about Data Analyst with Advanced excel course – Enrol Now. To learn more about Data Analyst with R Course – Enrol Now. To learn more about Big Data Course – Enrol Now.
To learn more about Machine Learning Using Python and Spark – Enrol Now. To learn more about Data Analyst with SAS Course – Enrol Now. To learn more about Data Analyst with Apache Spark Course – Enrol Now. To learn more about Data Analyst with Market Risk Analytics and Modelling Course – Enrol Now.
In general, a data type defines the format, sets the upper & lower bounds of the data so that a program could use it appropriately. Data types are the classification or categorization of data items which describes the character of a variable. The most used data types are numeric, non-numeric and Boolean (true/false).
Python has the following standard Data Types:
Booleans
Numbers
String
List
Tuple
Set
Dictionary
Mutable and Immutable Objects
Data objects of the above types are stored in a computer’s memory for processing. Some of these values can be modified during processing, but the contents of the others can’t be altered once they are created in the memory.
Number values, strings, and tuple are immutable, which means their contents can’t be altered after creation.
On the other hand, the collection of items in a List or Dictionary object can be modified. It is possible to add, delete, insert, and rearrange items in a list or dictionary. Hence, they are mutable objects.
Booleans
A Boolean is such a data type that almost every programming language has, and so does Python. Boolean in Python can have two values – True or False. These values can be used for assigning and comparison.
Numbers
Numbers are one of the most prominent Python data types. In Numbers, there are mainly 3 types which include Integer, Float, and Complex.
String
A sequence of one or more characters enclosed within either single quotes ‘or double quotes” is considered as String in Python. Any letter, a number or a symbol could be a part of the string. Multi-line strings can be represented using triple quotes,”’ or “””.
List
Python list is an array-like construct which stores a heterogeneous collection of items of varied data typed objects in an ordered sequence. It is very flexible and does not have a fixed size. The Index in a list begins with a zero in Python.
Tuple
A tuple is a sequence of Python objects separated by commas. Tuples are immutable, which means tuples once created cannot be modified. Tuples are defined using parentheses ().
Set
A set is an unordered collection of items. Set is defined by values separated by a comma inside braces { }. Amongst all the Python data types, the set is one which supports mathematical operations like union, intersection, symmetric difference etc. Since the set derives its implementation from the “Set” in mathematics, so it can’t have multiple occurrences of the same element.
Dictionary
A dictionary in Python is an unordered collection of key-value pairs. It’s a built-in mapping type in Python where keys map to values. These key-value pairs provide an intuitive way to store data. To retrieve the value we must know the key. In Python, dictionaries are defined within braces {}.
This article is about one specific data type, which is a string. The String is a sequence of characters enclosed in single (”) or double quotation (“”) marks.
Here are examples of creating strings in Python.
Counting Number of Characters Using LEN () Function
The LEN () built-in function counts the number of characters in the string.
Creating Empty Strings
Although variables S3 and S4 do not contain any characters they are still valid strings. S3 and S4 both represent empty strings here.
We can verify this fact by using the type () function.
String Concatenation
String concatenation means joining one or more strings together. To concatenate strings in Python we use + operator.
String Repetition Operator (*)
Just like in numbers, * operator can also be used with strings. When used with strings * operator repeats the string n number of times. Its general format is: 1 string * n,
where n is a number of type int.
Membership Operators – in and not in
The in or not in operators are used to check the existence of a string inside another string. For example:
Indexing in a String
In Python, characters in a string are stored in a sequence. We can access individual characters inside a string by using an index.
An index refers to the position of a character inside a string. In Python, strings are 0 indexed. This means that the first character is at index 0; the second character is at index 1 and so on. The index position of the last character is one less than the length of the string.
To access the individual characters inside a string we type the name of the variable, followed by the index number of the character inside the square brackets [].
Instead of manually counting the index position of the last character in the string, we can use the LEN () function to calculate the string and then subtract 1 from it to get the index position of the last character.
We can also use negative indexes. A negative index allows us to access characters from the end of the string. Negative index starts from -1, so the index position of the last character is -1, for the second last character it is -2 and so on.
Slicing Strings
String slicing allows us to get a slice of characters from the string. To get a slice of string we use the slicing operator. Its syntax is:
str_name[start_index:end_index]
str_name[start_index:end_index] returns a slice of string starting from index start_index to the end_index. The character at the end_index will not be included in the slice. If end_index is greater than the length of the string then the slice operator returns a slice of string starting from start_index to the end of the string. The start_index and end_index are optional. If start_index is not specified then slicing begins at the beginning of the string and if end_index is not specified then it goes on to the end of the string. For example:
Apart from these functionalities, there are so many built-in methods for strings which make the string as the useful data type of Python. Some of the common built-in methods are as follows: –
capitalize ()
Capitalizes the first letter of the string
join (seq)
Merges (concatenates) the string representations of elements in sequence seq into a string, with separator string.
lower ()
Converts all the letters in a string that are in uppercase to lowercase.
max (str)
Returns the max alphabetical character from the string str.
min (str)
Returns the min alphabetical character from the string str.
replace (old, new [, max])
Replaces all the occurrences of old in a string with new or at most max occurrences if max gave.
split (str=””, num=string.count(str))
Splits string according to delimiter str (space if not provided) and returns list of substrings; split into at most num substrings if given.
upper()
Converts lowercase letters in a string to uppercase.
Conclusion
So in this article, firstly, we have seen a brief introduction of all the data types of python. Later in this article, we focused on the strings. We have seen several Python operations on strings as well as the most common useful built-in methods of strings.
To learn more about Data Analyst with Advanced excel course – Enrol Now. To learn more about Data Analyst with R Course – Enrol Now. To learn more about Big Data Course – Enrol Now.
To learn more about Machine Learning Using Python and Spark – Enrol Now. To learn more about Data Analyst with SAS Course – Enrol Now. To learn more about Data Analyst with Apache Spark Course – Enrol Now. To learn more about Data Analyst with Market Risk Analytics and Modelling Course – Enrol Now.
Statistics is a branch of mathematics which deals with the collection, analysis, interpretation and presentation of masses of numerical data. Statistics is a tool used to communicate our understanding of data. It helps us understand the world better, make assertions, and communicate our confidence in the statements we are making.
Two main statistical methods are used in data analysis:
Descriptive statistics: This method is used to summarize data from a sample using measures such as the mean or standard deviation
Inferential statistics: With this method, you can conclude data that are subject to random variation (e.g., observational errors, sampling variation).
This article is about the descriptive statistics which are used to describe and summarize the datasets. We are also going to see the available Python libraries to get those numerical quantities.
This whole topic will be covered in a series of two blogs. This first blog is about the types of measures in descriptive statistics. Furthermore, we will also see the built-in Python “Statistics” library, which has a relatively small number of the most important statistics functions.
Descriptive statistics can be defined as the measures that summarize a given data, and these measures can be broken down further into the measures of central tendency and the measures of dispersion. Measures of central tendency include mean, median, and the mode, while the measures of dispersion include standard deviation and variance.
We will cover the following topics in descriptive statistics:
The arithmetic mean is the sum of data divided by the number of data-points. It is a measure of the central location of data in a set of values that vary in range. In Python, we usually do this by dividing the sum of given numbers with the count of the number present. Python mean function can be used to calculate the mean/average of the given list of numbers. It returns the mean of the data set passed as parameters.
mean( ): Arithmetic mean (“average”) of data.
harmonic_mean( ): It is the reciprocal of the arithmetic mean of the reciprocals of the data (say for three numbers a, b and c, 1/mean = 3/(1/a + 1/b + 1/c)).
Median
median( ): Median or middle value of data is calculated as the mean of middle two. When the number of data points is odd, the middle data point is returned. The median is a robust measure of a central location and is less affected by the presence of outliers in your data compared to the mean.
median_low( ): Low median of data is calculated when the number of data points is odd. Here the middle value is usually returned. When it is even, the smaller of the two middle values is returned.
median_high( ): High median of data is calculated when the number of data points is odd. Here, the middle value is usually returned. When it is even, the larger of the two middle values is returned.
Mode
mode( ): Mode (most common value) of discrete data. The mode (when it exists) is the most typical value and is a robust measure of central location.
Measures of Dispersion
Measures of dispersion are statistics that describe how data varies, usually relative to the typical value. While measures of centre give us an idea of the typical value, measures of spread give us a sense of how much the data tends to diverge from the typical value.
These following functions (from the statistics module in python) calculate a measure of how much the population or sample tends to deviate from the typical or average values.
Population Variance
pvariance( ): Returns the population variance of data. Use this function to calculate the variance from the entire population. To estimate the variance from a sample, the variance ( ) function is usually a better choice. When called with the entire population, this gives the population variance σ². When called on a sample instead, this is the biased sample variance s², also known as variance with N degrees of freedom.
Population Standard Deviation
pstdev( ): Return the population standard deviation (the square root of the population variance)
Sample Variance
variance ( ): Returns the sample variance of data, an iterable of at least two real-valued numbers. Variance, or second moment about the mean, is a measure of the variability (spread or dispersion) of data. A large variance indicates that the data is spread out; a small variance indicates it is clustered closely around the mean. If the optional second argument is given to the function, it should be the mean of data. This is the sample variance s² with Bessel’s correction, also known as variance with N-1 degrees of freedom.
Sample Standard Deviation
stdev( ): Returns the sample standard deviation (the square root of the sample variance)
Conclusion
So, this article focuses on describing and summarizing the datasets, also helping you to calculate numerical quantities in Python. It’s possible to get descriptive statistics with pure Python code, but that’s rarely necessary. In the next series of this blog we will see the Python statistics libraries which are comprehensive, popular, and widely used especially for this purpose.
Interested in a career in Data Analyst?
To learn more about Data Analyst with Advanced excel course – Enrol Now. To learn more about Data Analyst with R Course – Enrol Now. To learn more about Big Data Course – Enrol Now.
To learn more about Machine Learning Using Python and Spark – Enrol Now. To learn more about Data Analyst with SAS Course – Enrol Now. To learn more about Data Analyst with Apache Spark Course – Enrol Now. To learn more about Data Analyst with Market Risk Analytics and Modelling Course – Enrol Now.