python data science course Archives - Page 6 of 6 - DexLab Analytics | Big Data Hadoop SAS R Analytics Predictive Modeling & Excel VBA

Calculating Geometric Mean Using R and Python

Calculating Geometric Mean Using R and Python

In this blog, we are going to discuss the Geometric Mean and its application using Python and R.

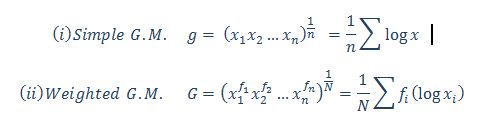
Geometric Mean of group of ‘n’ observations is the nth root of their product. It is defined only when all observations have the same sign and none of them is zero.

Application:

Calculate the Geometric Mean of the salary increment of 12 employees. From the following table, calculate the average salary increment of the year (2019-2020):-


Name

Salary Increment in

Percentage (%)

Ritesh

10.09%

Heena

15.45%

Kritika

9%

Anuradha

13.06%

Gaurav

20%

Prakash

14%

Aarti

16%

Meena

6.25%

Utkarsh

12.85%

Chirag

10%

Neha

18%

Smrita

21.36%


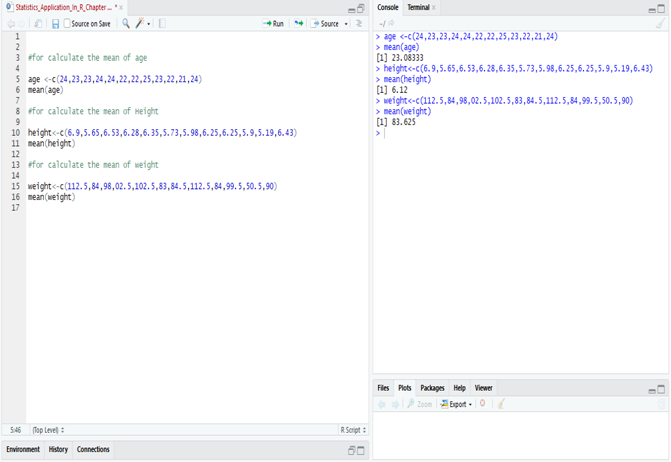
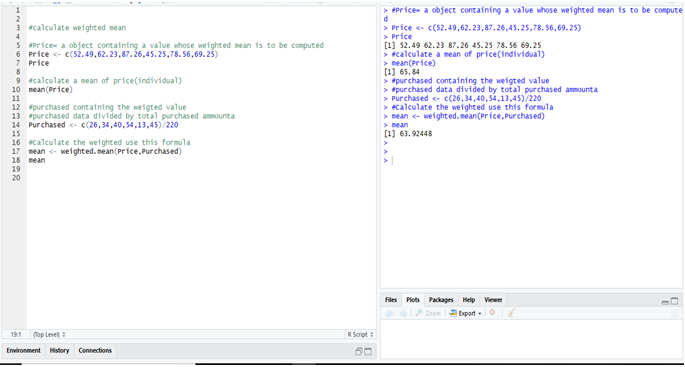
Calculate the Geometric Mean in R:

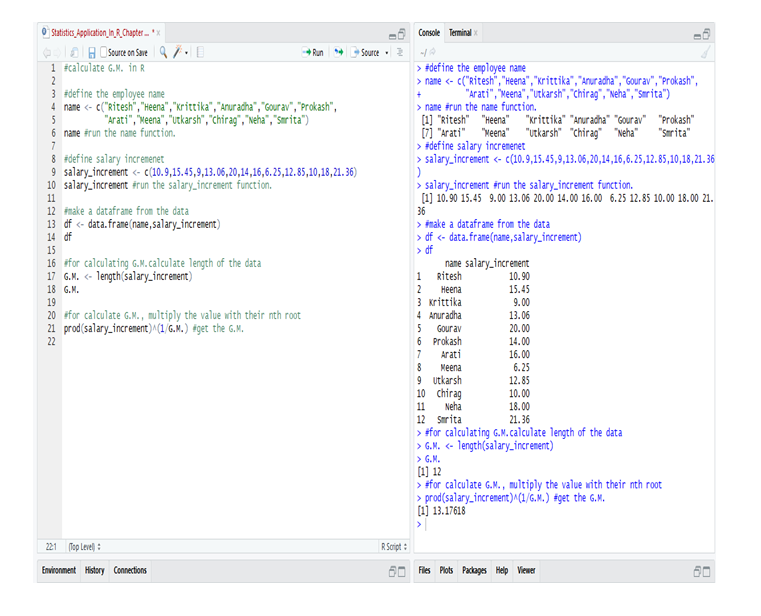
So, from the data of the employee’s in R we calculate the G.M. and get that the average salary increment in the year (2019-2020) = 13.17618 or 13.18% (approx).

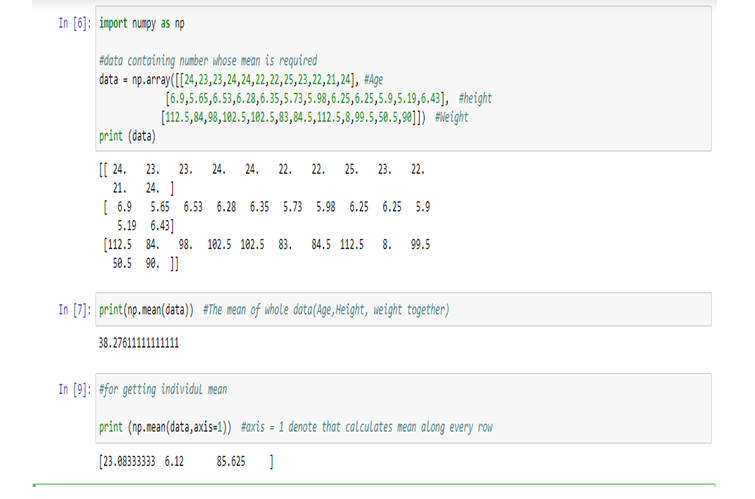
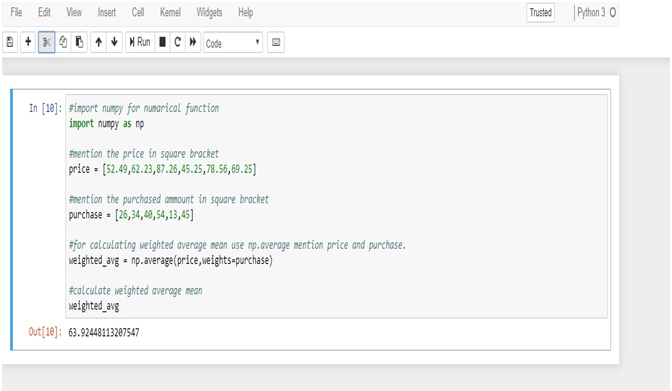
Calculate the Geometric Mean in Python:

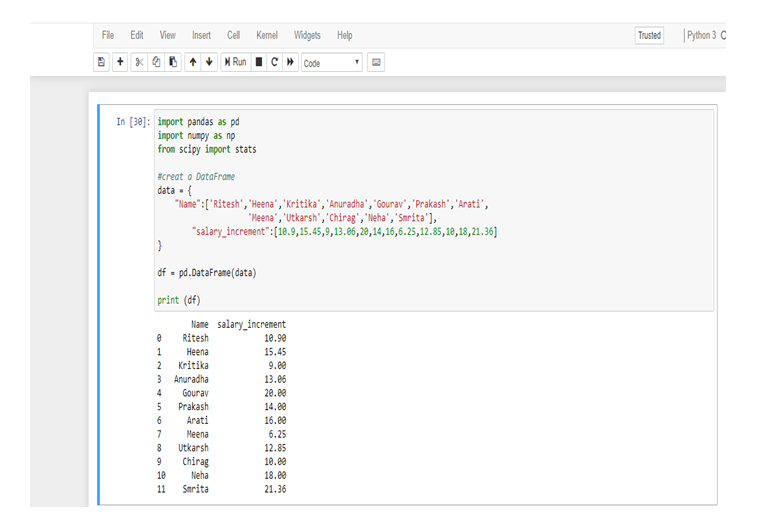
First, make a data frame in Python from the following table.

Now, calculate the Geometric Mean from the data-frame.

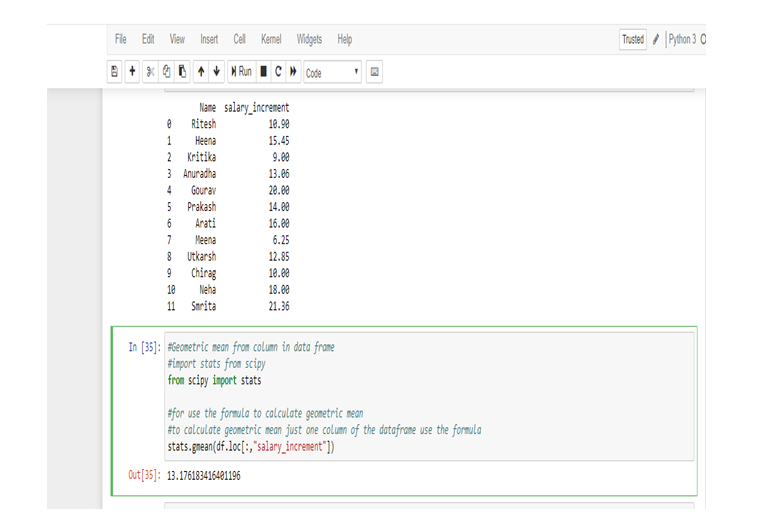
So, from the data of the employee’s in Python we calculate the G.M. and get that the average salary increment in the year (2019-2020) = 13.176183416401196 or 13.18% (approx).

We use Geometric Mean for calculating ratios, rates and percentages. And it is not affected by the extreme value or outlier. In this particular problem, we use Geometric Mean because an average of the salary increment of the employee’s not affected by the extreme highest or extreme lowest value, that’s why the salary increment rates of Meena and Smrita do not have any effect on the total average rate.

Geometric Mean gives small value than Arithmetic Mean.

2

Note: This is a continuation of the blog: Statistical Application in R & Python: Chapter 1 – Measure of Central Tendency. It would be better to go through the first installment and then read this one. More blogs are to be followed, so stay tuned.

DexLab Analytics is a premier Python training institute in Delhi. Our industry-relevant courses are carefully crafted by experts. Follow us on Facebook and Instagram.


Interested in a career in Data Analyst?

To learn more about Data Analyst with Advanced excel course – Enrol Now.
To learn more about Data Analyst with R Course – Enrol Now.
To learn more about Big Data Course – Enrol Now.

To learn more about Machine Learning Using Python and Spark – Enrol Now.
To learn more about Data Analyst with SAS Course – Enrol Now.
To learn more about Data Analyst with Apache Spark Course – Enrol Now.
To learn more about Data Analyst with Market Risk Analytics and Modelling Course – Enrol Now.

Statistical Application In R & Python: Chapter 1 – Measure Of Central Tendency

Statistical Applcation In R & Python: Chapter 1 – Measure Of Central Tendency

Statistical analysis helps explore data relationship and develop high-end models to frame better decisions. It’s an intricate process of collecting and evaluating data to define the nature of data that has to be analyzed.

Below, we dig into the basics of statistical application in R and Python using the measure of central tendency.

  • Introduction:-

As body methods for the study of numerical data, if some rows or columns are too long, in such cases, it becomes necessary to summarize data in an easily manageable form. The purpose is to serve by classifying the data in the form of frequency distribution and various graphs. When data relate to a variable, the process of summarization can be taken a step further by using certain descriptive measures. The dim is to focus on certain features that are central frequency and description.

2

  • Central Tendency :

In a set of data, they have a tendency, notwithstanding their variability, to cluster-around a central value and the tendency of the quantitative statistical observations is called central tendency.

The three measures of the central tendency are commonly used is:-

  • Mean
  • Median
  • Mode

The description of these 3 estimators start below:-

  • Mean:-

Mean is the average of central tendency and is the most commonly used measures.

The concept of mean is divided into three parts:-

  • Arithmetic mean.
  • Geometric mean.
  • Harmonic mean.

Mainly the mean refers to an arithmetic mean.

  • Arithmetic Mean (A.M.):-

The arithmetic mean of a set of observations is defined to be their sum, divided by the number of observations.

For n numbers of observation (x1,x2,… ,xn )

  • Weighted A.M.

For frequency distribution where  have  frequencies. (i=1,2,3…)

  • Application of A.M.:-

Let’s, calculate the mean of Age, Height & Weight from the given data.

NameSexAgeHeightWeight
RiteshM246.9112.5
HeenaF235.6584
KritikaF236.5398
AnuradhaF246.28102.5
GauravM246.35102.5
PrakashM225.7383
AartiF225.9884.5
MeenaF256.25112.5
UtkarshM236.2584
ChiragM225.999.5
NehaF215.1350.5
SmritaF246.4390

Calculating Mean in Python:

Therefore,

Age (Mean) = 23.08333333, Height (Mean) = 6.12, weight(Mean) = 85.625

Calculating Mean in R:

  • Application of Weighted A.M.:-

The weighted mean is denoted that the mean with frequency.

Data to solve:

Calculate the average price per ton of coal purchased by the industry for the half-year.

Month

Price Per TonTons Purchased

January

Rs. 52.4926

February

Rs. 62.2334
MarchRs. 87.26

40

AprilRs. 45.25

54

MayRs. 78.56

13

June

Rs. 69.25

45

Data to solve:

Month

Price (Rs)

Per Ton

(x)

Tons

Purchased

(f)

fx=y

(Main Data)

January

 52.49261364.74

February

 62.2334

2115.82

March

 87.2640

3490.4

April

45.2554

2443.5

May

 78.5613

1021.28

June

69.2545

3116.25

Total395.04N=212

13551.99


The price is denoted as x (52.49, 62.23, 87.26, 45.25, 78.56, 69.25 [in Rs.])=395.04

The amount of purchased (frequency) is denoted by f (26, 34, 40, 54, 13, 45) = 212 (N)

Then multiply the x and f and we get the total amount which is denoted by y, fx(y) = 13551.99

Calculate Weighted Mean in R:

Calculate Weighted Mean in Python:

To calculate the weighted mean from R & Python we get the same result = 63.9244811.

Want to know more about the nature of data? Keen to perform high-end statistical analysis using Python and R? Follow DexLab Analytics, an excellent Python training center in Gurgaon, India. Our team of consultants will help you learn the basics of R and Python in the easiest manner possible.


Interested in a career in Data Analyst?

To learn more about Data Analyst with Advanced excel course – Enrol Now.
To learn more about Data Analyst with R Course – Enrol Now.
To learn more about Big Data Course – Enrol Now.

To learn more about Machine Learning Using Python and Spark – Enrol Now.
To learn more about Data Analyst with SAS Course – Enrol Now.
To learn more about Data Analyst with Apache Spark Course – Enrol Now.
To learn more about Data Analyst with Market Risk Analytics and Modelling Course – Enrol Now.

Demand for Data Analysts is Skyrocketing – Explained

Demand for Data Analysts is Skyrocketing - Explained

The salary of analytics professionals outnumbers that of software engineers by more than 26%. The wave of big data analytics is taking the world by storm. If you follow the latest studies, you will discover that there has been a prominent growth in median salary over several experience levels in the past three years (2016 to 2018). In 2019, the average analytics salary has been capped at 12.6 lakh per annum.

The key takeaway is that the salary structure of analytics professionals continues to beat other tech-related job roles. In fact, data analysts are found out-earning their Java correspondents by nearly 50% in India alone. A latest survey provides an encompassing view of base and compensation salaries in data science along with median salaries followed across diverse job categories, regions, education profiles, experience, tools and skills.

In this regard, a spokesperson of a prominent data analytics learning institute was found saying, “The demand for AI skills is expected to increase rapidly, which is also reflected by the fact that AI engineers command a higher salary than peers.” She further added, “Many of our clients have realized that investing in data-driven skills at the leadership level is a determining factor for the success of digital and AI initiatives in the organization. With the increasing adoption of digital technologies, we expect an enduring growth of Data Science and AI initiatives to offer exciting and lucrative career options to new age professionals,”

Over time, we are witnessing how markets are evolving while the demand for skilled data scientists is following an upward trend. It is not only the technology firms that are posting job offers, but the change is also evident across industries, like retail, medical, retail and CPG amongst others. These sectors are enhancing their analytical capabilities implying an automatic increase in the number of data-centric jobs and recruitment of data scientists.

Points to Consider:

  • In the beginning, nearly 76% of data analysts earn 6-lakh figure per annum.
  • The average analytics salary observed in 2018-19 is 12.6 lakh.
  • In terms of analytics career, Mumbai offers the highest compensation of 13.7 lakh yearly, followed by Bangalore at 13 lakh.
  • Mid-level professionals proficient in data analytics are more in demand.
  • Knowing Python is an added advantage; Python Programming training will help you earn more. Expect a package of 15.1 lakh.
  • Nevertheless, we often see a pay disparity for female data scientists against their male counterparts. While women’s take-home salary is 9.2 lakh, male from the same designation and profession earns 13.7 lakh per annum.

2

As endnotes, the demand for data science skills is skyrocketing. If you want to enter into this flourishing job market, this is the best time! Enroll in a good data analyst course in Delhi and mould your career in the shape of success! DexLab Analytics is a top-notch data analyst training institute that offers a plethora of in-demand skill training courses. Reach us for more.


This article has been sourced fromwww.tribuneindia.com/news/jobs-careers/data-analytics-professionals-ride-the-big-data-wave/759602.html


Interested in a career in Data Analyst?

To learn more about Data Analyst with Advanced excel course – Enrol Now.
To learn more about Data Analyst with R Course – Enrol Now.
To learn more about Big Data Course – Enrol Now.

To learn more about Machine Learning Using Python and Spark – Enrol Now.
To learn more about Data Analyst with SAS Course – Enrol Now.
To learn more about Data Analyst with Apache Spark Course – Enrol Now.
To learn more about Data Analyst with Market Risk Analytics and Modelling Course – Enrol Now.

Top 4 Python Industrial Use-Cases: Explained

Top 4 Python Industrial Use-Cases: Explained

Dexlab ____ YOutube subscriber

Python is one of the fastest-growing and most popular coding languages in the world; a large number of developers use it on daily basis and why not, it works brilliantly for a plethora of developer job roles and data science positions – starting from scripting solution for sysadmins to supporting machine learning algorithms to fueling web development, Python can work wonders across myriad platforms!

Below, we’ve rounded up 4 amazing Python industrial use-cases; scroll ahead:

Insurance

Widely used in generating business insights; courtesy machine learning.

Case Study:

Smaller firms driven by machine learning gave stiff competition to a US multinational finance and insurance corporation. In return, the insurer formed teams and devised a new set of services and applications based on ML algorithms to enjoy a competitive edge. However, the challenge was that with so many data science tools, numerous versions of Python came into the picture and gave rise to compatibility issues. As a result, the company finalized only one version of Python, which was then used in line with machine learning algorithms and tools to derive specific results.

Data Science Machine Learning Certification

Finance

Data mining helps determine cross-sell opportunities.

Case Study:

Another US MNC dealing in financial services showed interest in mining complex customer behavioral data. Using Python, the company launched a series of ML and data science initiatives to dig into its structured data that it has been gathering for years and correlated it with an army of unstructured data, gathered from social media and web to enhance cross-selling and retrieve resources.

Aerospace

Python helps in meeting system deadlines and ensured utmost confidentiality.

Case Study:

Recently, the International Space Station struck a deal with an American MNC dealing in military, defense and aerospace technology; the latter has been asked to provide a series of systems to the ISS. The critical safety systems were mostly written in languages, like Ada; they didn’t fare well in terms of scripting tasks, data science analysis or GUI creation. That’s why Python was chosen; it offered bigger contract value and minimum exposure.

Retail Banking

Enjoy flexible data manipulation and transformation – all with Python!

Case Study:

A top-notch US department store chain equipped with an in-store banking division gathered data and stored it in a warehouse. The main aim of the company was to share the information with multiple platforms to fulfill its supply chain, analytics, retail banking and reporting needs. Though the company chose Python for on-point data manipulation, each division came up with their own versions of Python, resulting in a new array of issues. In the end, the company decided to keep a standard Python; this initiative not only resulted in amplifying engineering speed but also reduced support costs.

As end notes, Python is the next go-to language and is growing each day. If you have dreams of becoming an aspiring programmer, you need to book the best Python Certification Training in Delhi. DexLab Analytics is a premier Python training institute in Delhi; besides Python, it offers in-demand skill development courses for interested candidates.


The blog has been sourced from www.techrepublic.com/article/python-5-use-cases-for-programmers


Interested in a career in Data Analyst?

To learn more about Data Analyst with Advanced excel course – Enrol Now.
To learn more about Data Analyst with R Course – Enrol Now.
To learn more about Big Data Course – Enrol Now.

To learn more about Machine Learning Using Python and Spark – Enrol Now.
To learn more about Data Analyst with SAS Course – Enrol Now.
To learn more about Data Analyst with Apache Spark Course – Enrol Now.
To learn more about Data Analyst with Market Risk Analytics and Modelling Course – Enrol Now.

Now Machine Learning Can Predict Premature Death, Says Research

Now Machine Learning Can Predict Premature Death, Says Research

Machine Learning yet again added another feather in its cap; a team of researchers tried and tested a suave machine learning system that can now predict early death. Yes, premature death can now be estimated, courtesy a robust technology and an outstanding panel of researchers from the University of Nottingham! At first, it may sound weird and something straight out of a science fiction novel, but fret not – machine learning has proved itself in improving the status of preventive healthcare and now it’s ready to venture into new unexplored medical territories.

Prediction at Its Best

Published in PLOS ONE in one of their special editions of Machine Learning in Health and Biomedicine, the study delves into how myriad AI and ML tools can be leveraged across diverse healthcare fields. The technology of ML is already reaping benefits in cancer detection, thanks to its sophisticated quantitative power. These new age algorithms are well-equipped to predict death risks of chronic diseases way ahead of time from a widely distributed middle-aged population.

To draw clear conclusions, the team collected data of more than half a million people falling within the age group of 40 and 69 from the UK Biobank. The data collection is from the period 2006-2010, followed up till 2016. With this data in tow, the experts analyze biometric, demographic, lifestyle and clinical factors in each individual subject. Robust machine learning models are used in the process.

Adding in, the team observed dietary consumption of vegetables, fruits and meat per day of each subject. Later, the team from Nottingham University proceeded to predict the mortality of these individuals.

“We mapped the resulting predictions to mortality data from the cohort, using Office of National Statistics death records, the UK cancer registry and ‘hospital episodes’ statistics,” says Dr. Stephen Weng, assistant professor of Epidemiology and Data Science.  “We found machine-learned algorithms were significantly more accurate in predicting death than the standard prediction models developed by a human expert.”

Accuracy and Outcome

The researchers involved in this ambitious project are excited to the bones. They are eager about the outcomes. They are in fact looking forward to a time where medical professionals would be able to distinguish potential health hazards in patients with on-point accuracy and evaluate the following steps that would lead the way towards prevention. “We believe that by clearly reporting these methods in a transparent way, this could help with scientific verification and future development of this exciting field for health care”, shares Dr. Stephen Weng.

As closing thoughts, the research is expected to build the foundation of enhanced medicine capabilities and deliver customized healthcare facilities tailoring risk management for each individual patient. The Nottingham research draws inspiration from a similar study where machine learning techniques were used to predict cardiovascular diseases.

Data Science Machine Learning Certification

In case, you are interested in Machine Learning Using Python training course, DexLab Analytics is the place to be. With a volley of in-demand skill training courses, including Python certification training and AI training, we are one of the best in town. For details, check out our official website RN.

 
The blog has been sourced from
interestingengineering.com/machine-learning-algorithms-are-now-able-to-predict-premature-death


.

General Python Guide 2019: Learning Data Analytics with Python

General Python Guide 2019: Learning Data Analytics with Python

Python and data analytics are possibly three of the most commonly heard words these days. In today’s burgeoning tech scene, being skillful in these two subjects can prove very profitable. Over the years, we have seen the importance of Python education in the field of data science skyrocketing.

So here we present a general guide to help start off your Python learning:

Reasons to Choose Python:

  • Popularity

With over 40% data scientists preferring Python, it is clearly one of the most widely used tools in data analysis. It has risen in popularity above SAS and SQL, only lagging behind R.

  • General Purpose Language

There might be many other great tools in the market for analyzing data, like SAS and R, but Python is the only trustworthy general-purpose language valid across a number of application domains.

2

Step 1: Setup Python Environment

Setting up Python environment is uncomplicated, but a primary step. Downloading the free Anaconda Python package is recommended. Besides core Python language, it includes all the essential libraries, such as Pandas, SciPy, NumPy and IPython, and graphical installer also. Post installation, a package containing several programs is launched, most important one being iPython also known as Jupyter notebook. After launching the notebook, the terminal opens and a notebook is started in the browser. This browser works as the coding platform and there’s no need for internet connection even.

Step 2: Knowing Python Fundamentals

Getting familiar with the basics of Python can happen online. Active participation in free online courses, where video tutorials, practice exercises are plentiful, can help you grasp the fundamentals quickly. However, if you are seeking expert guidance, you must explore our Python data science courses.

Step 3: Know Key Python Packages used for Data Analysis

Since it is a general purpose language, Python’s utility stretches beyond data science. But there are plentiful Python libraries useful in data functionalities.

Numpy – essential for scientific computing

Matplotib – handy for visualization and plotting

Pandas – used in data operations

Skikit-learn – library meant to help with data mining and machine learning activities

StatsModels – applied for statistical analysis and modeling

Scipy-SciPy – the Numpy extension of Python; it is a set of math functions and algorithms

Theano – package defining multi-dimensional arrays.

Step 4: Load Sample Data for Practice

Working with sample datasets is a great way of getting familiar with a programming language. Through this kind of practice, candidates can try out different methods, apply novel techniques and also pinpoint areas of strength and in need of improvement.

Python library StatModels contains preloaded datasets for practice. Users can also download dataset from CSV files or other sources on web.

Step 5: Data Operations

Data administration is a key skill that helps extract information from raw data. Majority of times, we get access to crude data that cannot be analyzed straightaway; it needs to be manipulated before analyzing. Python has several tools for formatting, manipulating and cleaning data before it is examined.

Step 6: Efficient Data Visualization

Visuals are very valuable for investigative data analysis and also explaining results lucidly. The common Python library used for visualization is Matplotlib.

Step 7: Data Analytics

Formatting data and designing graphs and plots are important in data analysis. But the foundation of analytics is in statistical modeling, data mining and machine learning algorithms. Having libraries like StatsModels and Scikit-learn, Python provides all necessary tools essential for performing core analyzing functions.

Concluding

As mentioned before, the key to learning data analytics with Python is practicing with imported data sets. So without delay, start experimenting with old operations and new techniques on data sets.

For more useful blogs on data science, follow DexLab Analytics – we help you stay updated with all the latest happenings in the data world! Also, check our excellent Python courses in Delhi NCR.


Interested in a career in Data Analyst?

To learn more about Data Analyst with Advanced excel course – Enrol Now.
To learn more about Data Analyst with R Course – Enrol Now.
To learn more about Big Data Course – Enrol Now.

To learn more about Machine Learning Using Python and Spark – Enrol Now.
To learn more about Data Analyst with SAS Course – Enrol Now.
To learn more about Data Analyst with Apache Spark Course – Enrol Now.
To learn more about Data Analyst with Market Risk Analytics and Modelling Course – Enrol Now.

5 Big Challenges That Data Scientists Face Each Day

5 Big Challenges That Data Scientists Face Each Day

Data is lucrative; the world is revolving around how we churn out data. As a result, there’s been a high demand for data scientists. But of course, as rightfully said there’s no gain without pain – the promising field of data science is laden with many challenges, which needs to be overcome by expert consultants under needful guidance and with deft expertise.

Below, we’ve mentioned top 5 data science challenges, and how to handle them well…

Address the Specifics

Successful data scientists don’t try to do everything on their own. Instead, they individually focus on a single specific area. “I would encourage new professionals to understand that data science is a bit like medicine—it’s a vast and vague term that encapsulates wildly different practices under one roof,” said Tal Kedar, CTO at Optimove. “Data scientists [can have] very different engineering skill sets [and be] experienced with very different platforms and tools.”

For data science certification, look no further. DexLab Analytics is a prime data science training institute catering to the needs of enthusiast students. 

2

Be Guided By Your Intuition

Being a data scientist not only exposes you to the question of ‘how’, but also ‘why’. No longer do you just sift through data to make connections, instead you have to use your comprehensive knowledge to develop ‘mental model’, which can be accepted or rejected by your data.

Cross-Department Expertise is Appreciable

“The best data scientists are not just statisticians or machine learning experts; they are also an authority in the field or business where they are applying those skills,” said Kedar. It’s no hard fact, data scientists are arguably the best bridge between technical and non-technical teams. Quite naturally, whichever career they chose next, their skills will be treated as an asset to the next company in question.

Seamless Flow of Communication

Communication amongst the data teams is crucial – data scientists need to explain technical concepts to audiences from other departments, including executives and stakeholders, who might not belong from technical backgrounds. “It can be exciting to share all of the technical complexities that got you to your conclusions,” said Andrew Seitz, senior data analyst at Snowflake. “But what your stakeholders need are the key findings and action items. Save the details for the appendix (or Q&A).”

Raw Data Play

The biggest challenge for data scientists is to find ways of using the data – how the process of data extraction, data cleaning, data analysis and data modeling are carried out. Data scientists need to possess broad domain expertise in all programming languages, such as Python, R and SQL.

The work life of a data scientist revolves around creating clean data sets loaded with useful information on which machine learning algorithms can be applied. This kind of job is mostly treated as an art instead of science, because a majority of hard work and effort goes unnoticed when observing the final product, just like an artist’s craft.

The scope and capability of data science is encompassing, so are the challenges. But, of course, most of the challenges can be mitigated with considerable preparation and communication. How? With an intensive Python data science course – from the expert consultants of DexLab Analytics.


The blog has been sourced fromwww.forbes.com/sites/laurencebradford/2018/09/06/8-real-challenges-data-scientists-face/#8adbc206d999


Interested in a career in Data Analyst?

To learn more about Data Analyst with Advanced excel course – Enrol Now.
To learn more about Data Analyst with R Course – Enrol Now.
To learn more about Big Data Course – Enrol Now.

To learn more about Machine Learning Using Python and Spark – Enrol Now.
To learn more about Data Analyst with SAS Course – Enrol Now.
To learn more about Data Analyst with Apache Spark Course – Enrol Now.
To learn more about Data Analyst with Market Risk Analytics and Modelling Course – Enrol Now.

Python Language for Embedded Applications

Python Language for Embedded Applications

Python is the need of the hour – not only for fueling websites but also for embedded applications.

Though C and C++ are still dominant programming languages for embedded applications, new age competitors, such as Python and Javascript are fast picking up pace. Especially Python: it’s gaining accolades for driving websites and Stack Overflow’s recent research has showcased the steady increase of popularity.

In terms of machine learning, Python is nowadays used with recommended platforms, such as TensorFlow and Caffe. It’s even used for fortifying neural networks.

The reason for such spiking popularity is it’s easy to download attribute – open source Python programming language can be downloaded for diverse platforms, including Windows and Linux. Moreover, several integrated development environments (IDEs) already exists for Python; some of the popular multiplatform tools are Microsoft’s Visual Studio and Eclipse (PyDev).

On the other hand, Python is reckoned as an embedded scripting language by wide motley of technical experts and consultants. Autodesk’s 3D animation program, Maya is programmed using Python. Similarly, Blender is also run on Python.

VDC Research highlighted spiked up interest in Python in IoT devices, “The embedded engineering community is embracing the use of scripting languages,” shares Chris Rommel, EVP of IoT & Embedded Technology research at VDC. “What began primarily isolated as a tool in the QA domain has quickly expanded within the software development ranks, with Python, in particular, showing incredible growth in the past few years,” he further adds.

For Python Course in Delhi NCR, DexLab Analytics is the go-to destination.

Python Graphics and User Interfaces

Python is loaded with a multitude of user-interface and graphics options. Developers, newbie and seasoned take advantage of Matplotlib: it’s a 2-D plotting library that offers a MATLAB-inspired interface. An open source KIVY framework is also used extensively. It can be run on a versatile range of platforms, such as Android,Linux, iOS, Windows, OS X, and the Raspberry Pi.

Qt is another very effective user-interface framework that’s high on popularity drive for over 25 years. Javascript, C++ and Python, all of them have relied on Qt for good. It specializes in handling graphics and different other multimedia formats as well as cameras and radios.

The Rise of Pythons for Embedded Systems

Python opens a world of opportunity, including providing support to numerous programming platforms and readable and manageable code. It eradicates the need to use brackets common to languages, such as C++, C and Java. Along with that, it enables an independent, interactive test-driven development approach.

All this sounds too alluring, isn’t it?

But wait, like all programming languages, Python too is bogged down by a few technical glitches. Running the application can sometimes become a bit tricky. Also, at times, Python may not be the perfect language for all embedded applications. Nevertheless, we cannot ignore the perks it ensures us: the benefits we derive from its dynamic nature, simplistic functions, flexibility and widespread support is incredible.

Data Science Machine Learning Certification

Of late, Python Data Science course in India is becoming increasingly popular. Join the bandwagon and get Python certified today!


The blog has been sourced from:

www.electronicdesign.com/embedded-revolution/python-s-big-push-embedded-space


Interested in a career in Data Analyst?

To learn more about Data Analyst with Advanced excel course – Enrol Now.
To learn more about Data Analyst with R Course – Enrol Now.
To learn more about Big Data Course – Enrol Now.

To learn more about Machine Learning Using Python and Spark – Enrol Now.
To learn more about Data Analyst with SAS Course – Enrol Now.
To learn more about Data Analyst with Apache Spark Course – Enrol Now.
To learn more about Data Analyst with Market Risk Analytics and Modelling Course – Enrol Now.

Call us to know more