python data science course Archives - Page 5 of 6 - DexLab Analytics | Big Data Hadoop SAS R Analytics Predictive Modeling & Excel VBA

Retail 4.0: How Trending Technologies Are Influencing the Retail Industry?

Retail 4.0: How Trending Technologies Are Influencing the Retail Industry?

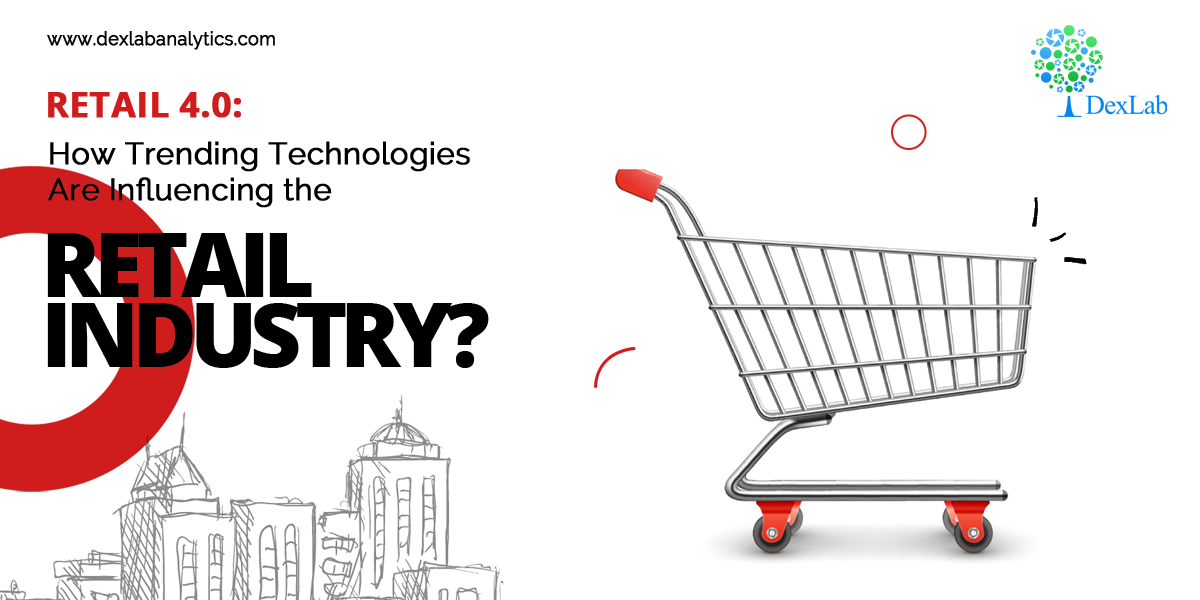
The retail industry is undergoing unprecedented changes: courtesy Retail 4.0! It is the term used to denote the transformation that’s taking place at a rapid pace. Technological advancements and customer expectation are key driving factors behind the evolution.

Customers are the bedrock of the retail industry. They are fickle and demanding. With higher spending power and low brand loyalty, they are redefining the consumer trends and forcing retailers to harness the power of big data to ensure a seamless, positive customer experience coupled more secure payment methods and easier online store formats.

2

Data is Power

For years, retailers have been working on consumer’s behavior and how to serve them well. Today, amidst increasing competition, data explosion and advanced technological implementations, they seem to lose their erstwhile charm. Data is the answer. In a digital-enabled landscape, retail industry players need to leverage several emerging technologies, such as augmented reality, virtual reality, mixed reality, AI and Internet of Things and draw clear actionable insights.

Gone are the days when retailers relied on their instincts and formulated marketing strategies. Today, predictive analytics is used to boost informed decision-making and conclude the future success of an enterprise. Put simply, retail analytics using Python is the tool to drive optimization, follow corrective measures and reduce revenue leakage. With data at the forefront, retail analytics and its diverse platforms are providing customers with relevant products, superior service and the facility to experience the products even before purchase.

How Does It Work?

Retail analytics targets customer acquisition and focuses on customer study. Through data analysis, the retailers ascertain buying patterns and curated customer engagement strategies. For that, deep insights are generated based on their search criteria, purchase records and frequency of shopping.

Also, retailers can now predict demand precisely. Based on a customer’s historical data, they anticipate when he/she is likely to make a purchase decision and within what duration of time. They can also predict the products the customers are going to re-purchase with the help of AI. Robust machine learning algorithms deliver insights that specify accurate customer recommendations, which help increase retailers’ profit margin.

Deep Learning and AI using Python

Understanding the nuances of consumer behavior is of utmost importance. This is why IoT and AI are combined and used in monitoring customer-store interactions – resulting in better service engagements and higher revenue. Social media has added to the effect. Extracting user information from social media platforms has become a piece of cake. Retail market players can now leverage the social media data, influence customer purchase decisions and enjoy a certain edge against the tailing rivals.

As endnotes, retailers need to embrace the digital transformation and create fresh, enhanced experiences to entice the consumers. After all, the future belongs to the data-inspired companies. So, just stay ahead of the curve using data as the power tool.


Interested in a career in Data Analyst?

To learn more about Data Analyst with Advanced excel course – Enrol Now.
To learn more about Data Analyst with R Course – Enrol Now.
To learn more about Big Data Course – Enrol Now.

To learn more about Machine Learning Using Python and Spark – Enrol Now.
To learn more about Data Analyst with SAS Course – Enrol Now.
To learn more about Data Analyst with Apache Spark Course – Enrol Now.
To learn more about Data Analyst with Market Risk Analytics and Modelling Course – Enrol Now.

Most Demanding Programming Languages for Machine Learning: A Knowhow

Most Demanding Programming Languages for Machine Learning: A Knowhow

Machine Learning is among a handful of technologies which we can see going on for long. It is a process or a technology which applies Artificial Intelligence (AI) to enable the machines/computers to learn things all by them and continue improving them subsequently.

Andrew Ng, a computer scientist from Stanford University, describes Machine Learning as the science which helps the computers to act without any explicit programming.

2

This new stream, as we are seeing it now, was originally conceived in the 1950s, however, it was not until the 21st century that Machine Learning started to revolutionise the world.

Several industries have already adopted this ground-breaking technology successfully to ensure the growth of their business. Moreover, this new technology has also boosted the demand for advanced programming languages, which were only rarely pursued earlier.

Here are some of the programming languages which seem quite promising with the rise of Machine Learning:

Python

This high-level programming language dates back to the early 1990s and has been widely popular since then, for Data Science, back-end development and Deep Learning for computer vision with Python. Python for data analysis is regarded as a powerful tool and is actively used in Big Data Technology.

R

R has been developed in the 1990s along with Python and was a part of the GNU project. Ever since it was discovered, R finds its uses extensively in Data Analysis, Machine Learning and the development of Artificial Intelligence. Furthermore, R is revered by the world of statisticians. 

Application to R and Python are effectively used to calculate the Arithmetic mean, Harmonic mean, Geometric Mean, Skewness & Kurtosis. Statistical Application Of R & Python: Know Skewness & Kurtosis And Calculate It Effortlessly shows you the way how.

Deep Learning and AI using Python

JavaScript, C++, Java are some other notable programming languages that are dominant. So, hurry up and join the exclusive computer vision course Python now. With Dexlab Analytics, a formidable institute in the Big Data Analytics industry, you can enroll for our tailor-made Artificial Intelligence course in Delhi with just a click from the comfort of your house.


Interested in a career in Data Analyst?

To learn more about Data Analyst with Advanced excel course – Enrol Now.
To learn more about Data Analyst with R Course – Enrol Now.
To learn more about Big Data Course – Enrol Now.

To learn more about Machine Learning Using Python and Spark – Enrol Now.
To learn more about Data Analyst with SAS Course – Enrol Now.
To learn more about Data Analyst with Apache Spark Course – Enrol Now.
To learn more about Data Analyst with Market Risk Analytics and Modelling Course – Enrol Now.

Straight Out of College? Grasp These Killer Data Science Skills

Straight Out of College? Grasp These Killer Data Science Skills

Data Science is one of the most demanding fields in the present world. Going hand in hand with the Artificial Intelligence, Data Science is showing a colossal growth in the coming years. So, honestly speaking, you should be prepared with all of the cutting-edge tools and up skill yourself accordingly to pace up with the modern world.

According to Derek Steer, CEO of Mode, the world will generate 50 times more data than what we were present in 2011. Moreover, with the data processing power becoming easy and inexpensive for most of the firms, candidates with real skill and a hunger for knowledge would only see their way through till the end, added Steer.

Among various other skills like retail analytics using Python, neural network machine learning Python, which are dominating and/or expected to rule the world of technology in the upcoming years, here we list you some of them:

2

Data Visualization

This is one of the top notch skills that you can find now. It is process of maintaining data with the help of graphical representations. This further makes the interpretation and thereby, the comprehension of data, much easier.

This is an extremely relevant skill which is not to be found among the high schoolers. This makes the undergraduates or post graduates with the knowhow of data visualisation all the more important everywhere.

Data Modelling

Data Modelling is the second most wanted skill that the entire world is seeking for. In a nutshell, Data Modelling is the process of understanding and using data to seek relationships across varied sets of information.

It is, in fact, a skill which is gaining an immense popularity among the fresh graduates. You can also reach Dexlab Analytics to gain an insight of all the industry relevant courses and enrol yourself asap to speed up your career!

Deep Learning and AI using Python

Python

Python is undoubtedly the most demanding language ever in the history of computer science; hence, it enjoys all the attention that it gets.

With its welcoming nature to every other architecture, which is in sharp contradiction to Java and C++, Python is preferred all the way. Secondly, Python is quite a powerful language and effective too, when it comes to bulk data and a need to process them faster.

It is basically an open source program which is easy accessible and largely customised. This is really a gift for upcoming world of Data Science. Thus, Python for data analysis is an invaluable skill that you can develop to make yourself marketable like never before.

We hope you liked our post! You can Take A Deep Look On How Machine Learning Boosts Business Growth! and more such topics on our website.


Interested in a career in Data Analyst?

To learn more about Data Analyst with Advanced excel course – Enrol Now.
To learn more about Data Analyst with R Course – Enrol Now.
To learn more about Big Data Course – Enrol Now.

To learn more about Machine Learning Using Python and Spark – Enrol Now.
To learn more about Data Analyst with SAS Course – Enrol Now.
To learn more about Data Analyst with Apache Spark Course – Enrol Now.
To learn more about Data Analyst with Market Risk Analytics and Modelling Course – Enrol Now.

Statistical Application in R and Python: Calculating Binomial Distribution

Statistical Application in R and Python: Calculating Binomial Distribution

In this blog, we will take a look at the Binomial distribution. This blog is among the series of blogs through which you’ll have a vivid idea of the Statistical Application using R and Python. Statistical Application In R & Python: Chapter 1 – Measure Of Central Tendency is the first of such blogs.

The binomial distribution is an extension of the Bernoulli distribution. In Bernoulli, we have only one parameter, i.e. the probability of success.

Now, consider a case where we have “n” number of trials and we want to predict the probability of success from it. This is the Binomial case.

Binomial distribution has two parameters, i.e.: number of trails (n) AND probability of success (p). The mean of the binomial is a product of its two parameters, i.e. n multiplied by p. It is a discrete probability distribution. Here, each trial is assumed to have only two outcomes, either success or failure.

If X be a discrete random variable (taking only non-negative values), it is said to be following binomial distributions with a probability mass function as:-


Application:

A food shop starts a offer for a festive season, They have 12 different baskets, each basket has 5 combos and only 1 of them is non-veg. Find the probability of having 4 or less non-veg combos, if a consumer tries every combos at random.

Since, only 1 out of 5 combos is non-veg, the probability of choose a non-veg combos by random is 1/5 = 0.2

Calculate Binomial Distribution in R:

In R the probability of one non-veg combos choose by random in 5 is 13.28%, whereas the probability of four or less combos choose by random in a twelve baskets is 92.44%

Calculate Binomial Distribution in Python:

In Python the probability of one non-veg combos choose by random in 5 is 16.66%.

Conclusion:-

Binomial Distribution is the process by which we can calculate the probability of success from “n” number of trails. In Binomial Distribution we can find only two outcomes like “Yes” or “No”.

Dexlab Analytics is a pioneering institute of Data Science, with peerless trainers to help you ease your journey with Python Certification, R Programming Certification and Big Data Certification along with numerous other advanced and/or career oriented courses in Computer Science.


Interested in a career in Data Analyst?

To learn more about Data Analyst with Advanced excel course – Enrol Now.
To learn more about Data Analyst with R Course – Enrol Now.
To learn more about Big Data Course – Enrol Now.

To learn more about Machine Learning Using Python and Spark – Enrol Now.
To learn more about Data Analyst with SAS Course – Enrol Now.
To learn more about Data Analyst with Apache Spark Course – Enrol Now.
To learn more about Data Analyst with Market Risk Analytics and Modelling Course – Enrol Now.

Hacking is Wide and Dangerous in India, CBI Reports

Hacking is Wide and Dangerous in India, CBI Reports

The recent conference organized by the Central Bureau of Investigation on Cyber forensic notes that over 22,000 websites were hacked in India between April 2017 – Jan 2018. Not the best of the news for the nation which is largely counting on their citizens to be tech-savvy.

In the conference, CBI disclosed of its plans to build a cutting edge Centralised Technology Vertical (CTV) to fight crimes, voiced by Minister of State for Personnel, Jitendra Singh. The CTV is a huge project involving around Rs 99 crore, which will not only share the real-time information about the cyber attacks but also of the perpetrators.

From young superintendents of police to top brass of security agencies, police forces, law enforcement officers and the Intelligence attended this conference and discussed about the alarming rise of cybercrimes throughout the country.

2

The Major Issue

Jurisdictional issues were a main problem and hit greatly on the investigation in these cases because most of the incidents of cybercrimes are triggered from foreign lands. Though the total loss of money from the recent cybercrimes weren’t disclosed, some debilitating cases in cybercrimes were dicussed once again, which included the loss of USD 171 million from union Bank of India’s Swift.

To End it

To lessen the magnitude of the cybercrimes, the CBI is on their way towards reinforcing them with the state of the art technology. Besides, you can also take up courses in PHP, HTML, Python Certification Training in Delhi, to be informed of the trending languages and be future proof.


Interested in a career in Data Analyst?

To learn more about Data Analyst with Advanced excel course – Enrol Now.
To learn more about Data Analyst with R Course – Enrol Now.
To learn more about Big Data Course – Enrol Now.

To learn more about Machine Learning Using Python and Spark – Enrol Now.
To learn more about Data Analyst with SAS Course – Enrol Now.
To learn more about Data Analyst with Apache Spark Course – Enrol Now.
To learn more about Data Analyst with Market Risk Analytics and Modelling Course – Enrol Now.

Take a Deep Look on How Machine Learning Boosts Business Growth!

Take a Deep Look on How Machine Learning Boosts Business Growth!

Machine Learning is the technology of the future and the rise of it is, well, shocking! Numerous businesses have already started adopting Machine Learning into their business strategy which is ultimately culminating towards their growth. You can also get the most of Machine Learning by going for the best Machine Learning course in India without wasting hours on the internet.

This new and improving technology is showing marked results in making a particular business more efficient, enhancing customer relationships and driving more sales than ever. You can get right on to Machine Learning Significantly Aids in Improving the Business Performance: Learn the Hows and learn about Machine Learning and its rising curve.

Here we have decided to discuss in details about the ways how Machine Learning is helping business touch great heights:

2

Natural Language

One of the major setbacks in the industry of computer science was the inability of computers to comprehend our natural language or the way we speak in our everyday life. This is slowly changing with the rapid growth and considerable research and development on Machine Learning. 

It looks like we have come a long way from the crude search terms that we used to generate the results that we wanted. The AI-driven programs of now, with the help of Machine Learning, can figure out the essence of our conversations and also capitalizing largely on the nuances of our language. Most importantly, they learn from past experiences, which is highly progressive.

Logistics

The retail industry and that of logistics are largely relying on Python for Data Analysis and this in turn, is making them future-proof.

Retail giants like Amazon are encouraging the use of Machine Learning to sharpen the efficiency of their company with new features and technology like “anticipatory shopping” protocol. Retail analytics using Python is becoming formidable.

Even in the field of logistics, the inclusion of Machine Learning is proving a boon!

Manufacturing Industry

Innumerable manufacturing companies are adopting the budding technology of Machine Learning and utilizing it in almost every stage of production, simply because the AI-driven technology reduces unnecessary expenses. 

Companies like Seebo, are taking up Python seriously to build accurate data analytics software. Moreover, machine learning is estimated to cut down on the delivery times by 30% and surprisingly save fuel by 12%. According to the reports, the programs fed on AI would even reduce the maintenance costs by 20 – 30%.

Deep Learning and AI using Python

Consumer Data

We have already seen a world of data collection which has been on a rise for years. Now, finally, with the rise of machine learning, the companies are looking forward to making some use of all these data that they have accumulated. In the coming years, we will see AI improving powered by Machine Learning to make the world productive and smart all the more.

You can take a look at A DISCUSSION ABOUT ARTIFICIAL INTELLIGENCE: KNOWING AI CLOSELY if you are interested in AI. Stay glued to our website for more updates and information from the world of technology!


Interested in a career in Data Analyst?

To learn more about Data Analyst with Advanced excel course – Enrol Now.
To learn more about Data Analyst with R Course – Enrol Now.
To learn more about Big Data Course – Enrol Now.

To learn more about Machine Learning Using Python and Spark – Enrol Now.
To learn more about Data Analyst with SAS Course – Enrol Now.
To learn more about Data Analyst with Apache Spark Course – Enrol Now.
To learn more about Data Analyst with Market Risk Analytics and Modelling Course – Enrol Now.

Calculating the Standard Deviation Using R & Python

Calculating the Standard Deviation Using R & Python

When it comes to summarizing the data, standard deviation (σ) is the value which tells us about the spread of the data. More specifically, it gives information about the dispersion of each observation from the mean of the data. Now, if you are interested in understanding Mean and knowing how to calculate it, then we have shown you in CALCULATING GEOMETRIC MEAN USING R AND PYTHON And APPLICATION OF HARMONIC MEAN USING R AND PYTHON.

Thus, in essence standard deviation gives us valuable information about the robustness of the mean. The deviation is in both positive and negative direction of the mean.

Therefore, it is desirable for the standard deviation to be a low value in comparison to the mean. This would indicate a smaller spread.

Mathematically speaking, standard deviation is known as the second moment about Mean. Variance is standard deviation squared. The variance does not have any mathematical significance on its own. Think of the variance as a mere mathematical maneuver.

The formula for the Variance is:

Application:

An investor wants to calculate the Standard Deviation experience by his investment portfolio in last 12 months (Year 2017-2018).  The returns are:-

Month (Year 2017-18)

Returns (%)

April

12%

May

10%

June

-8%

July

4%

August

12.25%

September

18%

October

13%

November

-9%

December

-4%

January

3%

February

9%

March

11.05%

Calculate Standard Deviation in R:

Examining the Standard Deviation of the investment portfolio returns of a year in R, we get the deviation = 8.803533 or, 8.81% (Approx).

Calculate Standard Deviation in Python:

First, create a Data Frame in Python.

Now, calculate Standard Deviation of the returns,

Examining the Standard Deviation of the investment portfolio returns of a year in Python, we get the deviation = 8.803533209439092 or, 8.81% (Approx)

Standard Deviation is a key part of calculating margins of errors.

Standard deviation shows the variation from the mean. A low standard deviation indicates that the observations (series of number) are very close to the mean. A high standard deviation indicates that the observations (series of numbers) are spread out over a large range.

In this data the mean of the returns is 5.95%, and standard deviation is 8.81% which is close to the mean. So, the deviation of the data is low.

Thus, the investor now knows that the returns of his portfolio fluctuate by approximately 8.81% month-over-month. The information can be used to modify the portfolio to better the investor’s attitude towards risk. If the investor is risk-loving and is comfortable with investing in higher-risk, higher-return securities and can tolerate a higher standard deviation, he/she may consider adding in some small-cap stocks or high-yield bonds. Conversely, an investor who is more risk-averse may not be comfortable with this standard deviation and would want to add in safer investments such as large-cap stocks or mutual funds.

Endnotes

This article will surely help you to figure out the standard deviation with R and Python. However, if you want to have a general idea about Central tendency, about Mean, Median and Mode, then go through our blog on STATISTICAL APPLICATION IN R & PYTHON: CHAPTER 1 – MEASURE OF CENTRAL TENDENCY.

For all other information about us and our courses, Dexlab Analytics is there with you. You can also follow us on Facebook and LinkedIn and go through our blogs to stay updated always.


Interested in a career in Data Analyst?

To learn more about Data Analyst with Advanced excel course – Enrol Now.
To learn more about Data Analyst with R Course – Enrol Now.
To learn more about Big Data Course – Enrol Now.

To learn more about Machine Learning Using Python and Spark – Enrol Now.
To learn more about Data Analyst with SAS Course – Enrol Now.
To learn more about Data Analyst with Apache Spark Course – Enrol Now.
To learn more about Data Analyst with Market Risk Analytics and Modelling Course – Enrol Now.

Application of Harmonic Mean using R and Python

Application of Harmonic Mean using R and Python

Harmonic mean, for a set of observations is the number of observations divided by the sum of the reciprocals of the values and it cannot be defined if some of the values are zero.

This blog is in continuation with STATISTICAL APPLICATION IN R & PYTHON: CHAPTER 1 – MEASURE OF CENTRAL TENDENCY. However, here we will discover Harmonic mean and its application using Python and R.

2

Application:

A milk company sold milk at the rates of 10,16.5,5,13.07,15.23,14.56,12.5,12,30,32, 15.5, 16 rupees per liter in twelve different months (January-December), If an equal amount of money is spent on milk by a family in the ten months. Calculate the average price in rupees per month.

Table for the problem:

Month

Rates (Rupees/Liter)

January

10

February

16.5

March

5

April

13.07

May

15.23

June

14.56

July

12.5

August

12

September

30

October

32

November

15.5

December

16

Calculate Harmonic Mean in R:-

So, the average rate of the milk in rupees/liter is 12.95349 = 13 Rs/liter (Approx)

We get this answer from the Harmonic Mean, calculated in R.

Calculate Harmonic Mean in Python:-

First, make a data frame of the available data in Python.

Now, calculate the Harmonic mean from the following data frame.

So, the average rate of the milk in rupees/liter is 12.953491609077956 = 13 Rs/Liter (Approx)

We get this answer from Harmonic mean, calculated in Python.

Summing it Up:

In this data, we have a few large values which are putting an effect on the average value, if we calculate the average in Arithmetic mean, but in Harmonic mean, we get a perfect average from the data, and also for calculating the average rate.

Use of Harmonic mean is very limited. Harmonic mean gives the largest value to the smallest item and smallest value to the largest item.

Where there are a few extremely large or small values, Harmonic mean is preferable to Arithmetic mean as an average.

The Harmonic mean is mainly useful in averages involving time, rate & price.

Deep Learning and AI using Python

Note – If you want to learn the calculation of Geometric Mean, you can check our post on CALCULATING GEOMETRIC MEAN USING R AND PYTHON.

Dexlab Analytics is a peerless institute for Python Certification Training in Delhi. Therefore, for tailor-made courses in Python, Deep Learning, Machine Learning, Neural Networks, reach us ASAP!

You can even follow us on Social Media. We are available both in Facebook and Instagram.


Interested in a career in Data Analyst?

To learn more about Data Analyst with Advanced excel course – Enrol Now.
To learn more about Data Analyst with R Course – Enrol Now.
To learn more about Big Data Course – Enrol Now.

To learn more about Machine Learning Using Python and Spark – Enrol Now.
To learn more about Data Analyst with SAS Course – Enrol Now.
To learn more about Data Analyst with Apache Spark Course – Enrol Now.
To learn more about Data Analyst with Market Risk Analytics and Modelling Course – Enrol Now.

Python is the Leader in Data Science: Know Why

Python is the Leader in Data Science: Know Why

From being simple and effective to being updated and thereby, solving almost everything that the booming industry of Data Science of today can look up to, Python boasts of it all.

It’s not a shock that Python is finding its uses in an array of industries. It is, in fact, the language that the Data Scientists rely on. Thus, our tailored courses of Python Certification Training in Delhi would be helpful for all in this digital age.

Let’s see some more of the advantages for which Python stands distinguished among the other programming languages:

Handling Data without a Hassle

The field of Data Science is entrusted with the handling of incredibly large amounts of data which is found to be intricate to compute. However, with Python, it is now simpler than ever. Any of the other high-level programming languages would make it rather difficult and messy compared to the peerless Python, if we talk about analytical and quantitative computing.

Open Source Programming Language

Python is an open-source programming language. Wonder why this programming language is the most preferred still?

It truly opens a whole lot of opportunities that the language can build upon, being open-source in nature. Furthermore, there is not a single restriction regarding Python. Thus, you can be as creative as you wish on this programming language.

It is Powerful and Easy to Use

Python is an easy language right from the start for which it has become so popular. Any of the beginners with just the rudimentary knowledge can start fine with Python. Besides, once you are on with this programming language, you can start progressing with it day by day at your own pace.

The implementation of the code has a slower approach in the languages: Java, C and C#, but if you try Python, you would discover that it is fast to debug and effective to perform. The prompt results in coding would aid with an added boost in your work.

In the Library of Python

Python is an all-absorbing language that even supports the cutting edge technologies of Machine Learning and Artificial Intelligence. And on top of it, Python also offers its users a colossal database of libraries. Therefore, you can simply check in the libraries, import them and then implement all of them in your day to day coding.

It is Highly Scalable

In the parameter of scalability, Python superbly stands out. The programming languages: R and Java certainly falls short in this factor. Thus, with the ease of scalability and quicker turnaround times, data scientists and nearly all of the organisations exploring Data Science, are choosing Python over any other existing languages.

Data Science Machine Learning Certification

It is Peerless in Visualisation and Graphics

As the smooth rendering of quality graphics and visualisation is the demand of the age, Python fits in quite comfortably here. With an exhaustive range of options for visualisation, which are simple and efficient, the world of Data Science is rooting for Python.

With all the benefits that you can reap, Python for data analysis is a must, if you want to be absorbed in the industry of Data Science.


.

Call us to know more