Python courses Archives - Page 9 of 9 - DexLab Analytics | Big Data Hadoop SAS R Analytics Predictive Modeling & Excel VBA

R Programming, Python or Scala: Which is the Best Big Data Programming Language?

R Programming, Python or Scala: Which is the Best Big Data Programming Language?

For data science and big data, R, Python and Scala are the 3 most important languages to master. It’s a widely-known notion, organizations of varying sizes relies on massive structured and unstructured data to predict trends, patterns and correlations. They are of expectation that such a robust analysis will lead to better business decisions and individual behavior predictions.

In 2017, the adoption of Big Data analytics has spiked up to 53% in companies – says Forbes.

The story of evolution

To start with, big data is just data, after all. The entire game-play depends on its analysis – how well the data is analyzed so as to churn out valuable business intelligence. With years, data burgeoned, and it’s still expanding. The evolution of big data mostly happened because traditional database structures couldn’t cope with such multiplying data – scaling data became an important issue.

For that, here we have some popular big data programming languages. Dive down:

R Programming

R Programming is mainly used for statistical analysis. A set of packages are available for R named Programming with Big Data in R (pbdR), which encourages big data analysis, across multiple systems via R code.

R is robust and flexible; it can be run on almost every OS. To top that, it boasts of excellent graphical capabilities, which comes handy when trying to visualize models, patterns and associations within big data structures.

According to industry standards, the average pay of R Programmers is $115,531 per year.

For R language training, drop by DexLab Analytics.

Python

Compared to R, Python is more of a general-purpose programming language. Developers adore it, because it’s easy to learn, a huge number of tutorials are available online and is perfect for data analysis, which requires integration with web applications.

Python gives excellent performance and high scalability for a series of complicated data science tasks. It is used with high-in-function big data engines, like Apache Spark through available Python APIs.

Their Machine Learning Using Python courses are of highest quality and extremely student-friendly.

Let’s Take Your Data Dreams to the Next Level

Scala

Last but not the least, Scala is a general-purpose programming language developed mainly to address some of the challenges of Java language. It is used to write Apache Spark cluster computing solution. Hence, Scala has been a popular programming language in the field of data science and big data analysis, in particular.

There was a time when Scala was mandatory to work on Spark, but with the proliferation of many API endpoints approachable with other languages, this problem has been addressed. Nevertheless, it’s still the most significant and popular language for several big data tools, including Finagle. Also Scala houses amazing concurrency support, which parallelizes a whole many processes for huge data sets.

The average annual salary for a data scientist with Scala skills is $102,980.

In the end, you can never go wrong with selecting any one of the big data programming languages. All of them are equally good, productive and easy to excel on. However, Python is probably the best one to start off with.

For more updates or information on big data courses, visit DexLab Analytics.

The original article is here at – http://www.i-programmer.info/news/197-data-mining/11622-top-3-languages-for-big-data-programming.html


Interested in a career in Data Analyst?

To learn more about Machine Learning Using Python and Spark – click here.

To learn more about Data Analyst with Advanced excel course – click here.
To learn more about Data Analyst with SAS Course – click here.
To learn more about Data Analyst with R Course – click here.
To learn more about Big Data Course – click here.

Periscope Data Adds Python, R and SQL on A Single Platform for Better, Powerful Data Analysis

Periscope Data Adds Python, R and SQL on A Single Platform for Better, Powerful Data Analysis

Recently, a veteran data analytics software provider, Periscope Data announced some brand new developments while updating their Unified Data Platform for Python, R programming and Structured Query Language. This new Unified Data Platform will enable data professionals to work in sync with 3 key skills all on a single platform.  Far more better analysis will be conducted using less time by altering data in SQL, executing complex statistical analyses in Python or R, followed by improved visualization, collaboration and reporting of results – all performed on Periscope’s dynamic analytics platform.

A massive data explosion is taking place around the world around us. More than 90% of the world’s data has been created in the past two years, and the numbers are still on the rise. To this, new levels of sophistication needs to be added to analyze the complexity of data – “The addition of Python and R support to our Unified Data Platform gives our customers a unique combination of tools – from machine learning to natural language processing to predictive analytics, analysts will be able to answer new questions that have yet to be explored,” says Harry Glaser, co-founder and CEO of Periscope Data.

The inclusion of Python and R support in Periscope framework comes with ample benefits, and some of them are highlighted below:

2

All data at a single place

Instead of relying on several data sources, Periscope Data prefers to combine data together collected from various databases to bring them to a single platform, where nothing but a single source of truth for data is established. The data collected is updated and in crisp format.

Predictive analytics

It’s time to leverage Python and R libraries and move beyond the conventional historical reporting for the sake of modeling predictions. With lead scoring and churning prediction, businesses are now in a better position to derive significant insights about a future of a company.

No more switching between tools

Seamlessly, users can switch between querying data in SQL and analyzing data in R or Python, all at the same time on a same platform. Data professionals will be able to modify their datasets, enhance the performance of their models and update visualizations from a single location.

Mitigate data security concerns

The integration of R, Python and SQL by Periscope Data ensures the data professionals can run and share all sorts of models securely and in full compliance with all the norms, instead of seeking open source tools. Periscope Data is SOC2 and HIPAA compliant. It performs regular internal audits to check compliance requirements and safety issues.

Efficient collaboration with teams

As all the analysis takes place in a central location, be sure all your insights will be thoroughly consistent, secure and free of any version-control issues. Also, Periscope Data allows you and your team members the right to read and write access when required.

Easy visualization of analysis

To develop powerful visualizations that reach one’s heart and mind, leverage Periscope’s resources to the optimum levels. Data teams allow users to easily visualize through R packages and Python libraries so as to nudge users to explore the better horizons of data.

To learn more about R programming or Python, opt for Python & Spark training by DexLab Analytics. R language certification in Delhi NCR empowers students and professionals to collaborate and derive better insights faster and efficiently.


Interested in a career in Data Analyst?

To learn more about Data Analyst with Advanced excel course – Enrol Now.
To learn more about Data Analyst with R Course – Enrol Now.
To learn more about Big Data Course – Enrol Now.

To learn more about Machine Learning Using Python and Spark – Enrol Now.
To learn more about Data Analyst with SAS Course – Enrol Now.
To learn more about Data Analyst with Apache Spark Course – Enrol Now.
To learn more about Data Analyst with Market Risk Analytics and Modelling Course – Enrol Now.

Diverse and Scientifically Overpowering, Python is the Holy Grail for Tech Nerds, Here’s Why

Diverse and Scientifically Overpowering, Python is the Holy Grail for Tech Nerds, Here’s Why

Python? What comes to your mind – the venomous snake or the multifaceted programming language?

For data freaks, of course it’s the latter.

If you are thinking of imbibing some cool skills this New Year, consider Data Science with Python Training from DexLab Analytics. Python is open source, 100% free and easily available online. Also, it’s a general-purpose programming language, which is versatile in every way and can be used for a plethora of purposes – video games, websites, business tools, and lot more.

2

For first-time coders, Python is EPIC

To get started with Python, you just have to install it in your computer, open a notepad app and begin coding. Python is designed immaculately to generate cleaner, easy to gauge lines of code. The code is easy to read and write, and somehow closely resembles English. In terms of readability, words like ‘not’ and ‘in’ are deliberately used to make the language superfluous and not sound like any arcane language.

Moreover, the Python web framework Django is a game-changer. What once used to take hours in PHP could now be completed in minutes in Python. No doubts, codes compiled here will be a lot faster, effective and stable.

s3-news-tmp-116055-s3-news-tmp-116020-code-1839406_1920-2x1-940_0--2x1--940

Python is productive yet dangerous

It turns complex tasks into a piece of cake. Almost all the programming tasks are made easier with Python than its other counterparts. And this is known as Rapid Application Development. But of course, as it’s said with great power come great responsibility. You have to devise prudent ways of how to use this power to do something good, and not evil. Because, everything comes at a cost.

Python is a scripting language

The programs are furnished into Python’s interpreter, which eventually runs them directly so as to avoid compiling. It happens with some other programming languages too. But in here, the execution is faster and easier. Also, you receive feedback on your python code, like finding errors quickly, which is an added advantage. All this makes programming fun!!

Python is cross platform

Linux, Windows, Mac – Python can run on any computer operating system, large or small. Whether its large company servers or tiny PCs like Raspberry Pi, the cross platform feature poses no problem. In fact, Python programs can be run on iOS and Android devices.

Free and open-source

This means you can use Python without paying a single penny –just download and run python, and make any program your own once you write it with Python and also share if you feel like. The source code of Python is open to all, if you ever want to know how the Python developers drafted their code, take a peep into the code. It will help, trust me (though the code is written in a different programming language).

dexlab

Who uses Python?

Python has become indispensable. It’s everywhere now. These are the fields in which Python is applied:

  • Space
  • Astronomy
  • Movies
  • Laboratories
  • Medicine
  • Games
  • Music
  • Video
  • Doorbell
  • OS

Now, that you know a lot of things about Python software, how do you start?

Take up Python programming tutorial, it’s bound to make an incredible impact on your future, so hope you master it well. And for that, DexLab Analytics is here.


Interested in a career in Data Analyst?

To learn more about Data Analyst with Advanced excel course – Enrol Now.
To learn more about Data Analyst with R Course – Enrol Now.
To learn more about Big Data Course – Enrol Now.

To learn more about Machine Learning Using Python and Spark – Enrol Now.
To learn more about Data Analyst with SAS Course – Enrol Now.
To learn more about Data Analyst with Apache Spark Course – Enrol Now.
To learn more about Data Analyst with Market Risk Analytics and Modelling Course – Enrol Now.

Stories of Success: Molecular Modeling Toolkit (MMTK), Open Source Python Library

Stories of Success: Molecular Modeling Toolkit (MMTK), Open Source Python Library

Welcome again!! We are back here to take up another thrilling topic and dissect it inside out to see what compelling contents are hidden within. And this time we will take up our newly launched Python Programming Training Module – Python, invented by Guido Van Rossum is a very simple, well-interpreted and goal-specific intensive programming language.

Programmers love Python. Since there is zero compilation step, debugging Python programs is a mean feat. In this blog, we will chew over The Molecular Modeling Toolkit (MMTK) – it’s an open source Python library for molecular modeling and simulation. Composed of Python and C, MMTK eyes on bio-molecular systems with its conventional standard techniques and schemes, like Molecular Dynamics coupled with new techniques based on a platform of low-level operations.

Get a Python certification today from DexLab Analytics – a premier data science with python training institute in Delhi NCR.

It was 1996, when the officials from Python Org, including Konrad Hinsen (He was then involved in the Numerical Python project, but currently working as a researcher in theoretical physics at the French Centre National de la Recherche Scientifique (CNRS). He is also the author of ScientificPython, a general-purpose library of scientific Python code) started developing MMTK. They initially had a brush off with mainstream simulation packages for biomolecules penned down by Fortran, but those packages were too clumsy to implement and especially modify and extend. In order to develop MMTK, modifiability was a crucial criterion undoubtedly and they gave it utmost attention.

groel_deformation-web

The language chosen

The selection of language took time. The combination of Python and C was an intuitive decision. The pundits of Python were convinced that only a concoction of a high-level interpreted language and a CPU-efficient compiled language could serve their purpose well, and nothing short of that.

For the high-level segment, Tcl was rejected because it won’t be able to tackle such complex data structures of MMTK. Perl was also turned down because it was made of unfriendly syntax and an ugly integrated OO mechanism. Contrary to this, Python ranked high in terms of library support, readability, OO support and integration with other compiled languages. On top of that, numerical Python was just released during that time and it turned out to be a go-to option.

Now, for the low-level segment, Fortran 77 was turned down owing to its ancient character, portability issues and low quality memory management. Next, C++ was considered, but finally it was also rejected because of portability issues between compilers in those days.


The architecture of library

The entire architecture of MMTK is Python-centric. For any user, it will exude the vibes of a pure Python library. Numerical Python, LAPACK, and the netCDF library functions are observed extensively throughout MMTK. Also, MMTK offers multi-threading support for MPI-based parallelization for distributed memory machines and shared memory parallel machines.

The most important constituent of MMTK is a bundle of classes that identify atoms and molecules and control a database of fragments and molecules. Take a note – biomolecules (mostly RNA, DNA and proteins) are administered by subclasses of the generic Molecule class.

Extendibility and modularity are two pillars on which Python MMTK model is based. Without going under any modification of MMTK code, several energy terms, data type specializations and algorithms can be added anytime. Because, the design element of MMTK is that of a library, and not some close program, making it easier to run applications.

Note Bene: MMTK at present includes 18,000 lines of Python code, 12,000 lines of hand-written C code, and several machine-generated C codes. Most of the codes were formulated by one person during eight years as part of a research activity. The user community provided two modules, few functions and many ideas.

For more information, peruse through Python Training Courses Noida, offered by DexLab Analytics Delhi. They are affordable, as well as program-centric.


This article is sourced from –  www.python.org/about/success/mmtk


Interested in a career in Data Analyst?

To learn more about Data Analyst with Advanced excel course – Enrol Now.
To learn more about Data Analyst with R Course – Enrol Now.
To learn more about Big Data Course – Enrol Now.

To learn more about Machine Learning Using Python and Spark – Enrol Now.
To learn more about Data Analyst with SAS Course – Enrol Now.
To learn more about Data Analyst with Apache Spark Course – Enrol Now.
To learn more about Data Analyst with Market Risk Analytics and Modelling Course – Enrol Now.

Text Adventure – Using Control Flow In Python

Python wascreated by Guido van Rossum and first released in 1991.Python, as a programming platform, has gained a huge popularity within a short span of time because of its flexibility and the user-friendly interface. The software can be deployed easily for developing statistical models and machine learning algorithms

 
Text Adventure- Using Control Flow In Python
 

In fact, due to the advent of AI and ML, Python has a language has had a certain kind of rebirth as far as industrial use is concerned. Today, however, the focus is going to be on a particular section of the language, namely the control flow to create a basic system in Python.

Continue reading “Text Adventure – Using Control Flow In Python”

Open a World of Opportunities: Web Scraping Using PHP and Python

Open a World of Opportunities: Web Scraping Using PHP and Python

The latest estimates says, the total number of websites has crossed one billion mark; everyday a new site is being added and removed, but the record stays.

Having said that, just imagine how much data is floating around the web. The amount is so huge that it would be impossible for even hundreds of humans to digest all the information in a lifetime. To tackle such large amounts of data, you not only need to have easy access to all the information but should also process some scalable way to gather data in order to organize and analyze it. And that’s exactly where web data scraping comes into picture.

Web scraping, data mining, web data extraction, web harvesting or screen scraping – they all means the same thing – a technique in which a computer program fetches huge piles of data from a website and saves them in your computer, spreadsheet or database in a normal format for easy analysis.

2

Web Scraping with Python and BeautifulSoup

In case, you are not satisfied with the internet sources of web scraping, you are most likely to develop your very own data scraping tools, which is quite easier. In this blog we will show you how to frame a web scraper with Python and very simple yet dynamic BeautifulSoup Library:

First, import the libraries we will use: requests and BeautifulSoup:

# Import libraries
import requests
from bs4 import BeautifulSoup

Secondly, point out the variable for the URL using request.get method and gain access to the HTML content right from this page:

import requests
URL = "http://www.values.com/inspirational-quotes"
r = requests.get(URL)
print(r.content)

Next, we will parse a webpage, and for that, we need to create a BeautifulSoup object:

import requests 
from bs4 import BeautifulSoup
URL = "http://www.values.com/inspirational-quotes"
r = requests.get(URL)

 # Create a BeautifulSoup object
soup = BeautifulSoup(r.content, 'html5lib')
print(soup.prettify())

Now, let’s extract some meaningful information from HTML content. Look at the HTML content of the webpage, which was printed using the soup.pretify()method..

table = soup.find('div', attrs = {'id':'container'})

Here, you will find each quote inside a div container, belonging to the class quote.

We will repeat the process with each div container, belonging to the class quote. For that, we will use findAll()method and repeat the process with each quote using variable row.

After which, we will create a dictionary, in which all the data about the quote will be saved in a list, and is called ‘quotes’.

    quote['lines'] = row.h6.text

Now, coming to the final step – write down the data to a CSV file, but how?

See below:

filename = 'inspirational_quotes.csv'
with open(filename, 'wb') as f:
    w = csv.DictWriter(f,['theme','url','img','lines','author'])
    w.writeheader()
    for quote in quotes:
        w.writerow(quote)

This type of web scraping is used on a small-scale; for larger scale, you can consider:

Scraping Websites with PHP and Curl

To connect to a large number of servers and protocols, and download pictures, videos and graphics from several websites, consider Scraping Websites with PHP and cURL.

<?php

function curl_download($Url){

    if (!function_exists('curl_init')){
        die('cURL is not installed. Install and try again.');
    }

    $ch = curl_init();
    curl_setopt($ch, CURLOPT_URL, $Url);
    curl_setopt($ch, CURLOPT_RETURNTRANSFER, true);
    $output = curl_exec($ch);
    curl_close($ch);

    return $output;

print curl_download('http://www.gutenberg.org/browse/scores/top');

?>

In a nutshell, the scopes of using web scraping for analyzing content and applying it to your content marketing strategies are vast like the horizon. Armed by endless types of data analysis, web scraping technology has proved to be a valuable tool for the content producers. So, when are you feeding yourself with web scraping technology?

Discover the perfect platform for excellent R programming using Python courses. For more information on R programming training institute drop by DexLab Analytics.

 
This post originally appeared ondzone.com/articles/be-leading-content-provider-using-web-scraping-php
 

Interested in a career in Data Analyst?

To learn more about Data Analyst with Advanced excel course – Enrol Now.
To learn more about Data Analyst with R Course – Enrol Now.
To learn more about Big Data Course – Enrol Now.

To learn more about Machine Learning Using Python and Spark – Enrol Now.
To learn more about Data Analyst with SAS Course – Enrol Now.
To learn more about Data Analyst with Apache Spark Course – Enrol Now.
To learn more about Data Analyst with Market Risk Analytics and Modelling Course – Enrol Now.

The Timeline of Artificial Intelligence and Robotics

The Timeline of Artificial Intelligence and Robotics

Cities have been constructed sprawling over the miles, heaven-piercing skyscrapers have been built, mountains have been cut across to make way for tunnels, and rivers have been redirected to erect massive dams – in less than 250 years, we propelled from primitive horse-drawn carts to autonomous cars run on highly integrated GPS systems, all because of state-of-the-art technological innovation. The internet has transformed all our lives, forever. Be it artificial intelligence or Internet of Things, they have shaped our society and amplified the pace of high-tech breakthroughs.

One of the most significant and influential developments in the field of technology is the notion of artificial intelligence. Dating back to the 5th century BC, when Greek myths of Hephaestus incorporate the idea of robots, though it couldn’t be executed till the Second World War II, artificial intelligence has indeed come a long way.


Come and take a look at this infographic blog to view the timeline of Artificial Intelligence:


Evolution of Artificial Intelligence Over the Ages from Infographics


In the near future, AI will become a massive sector brimming with promising financial opportunities and unabashed technological superiority. To find out more about AI and how it is going to impact our lives, read our blogs published at DexLab Analytics. We offer excellent Machine Learning training in Gurgaon for aspiring candidates, who want to know more about Machine Learning using Python.


Interested in a career in Data Analyst?

To learn more about Data Analyst with Advanced excel course – Enrol Now.
To learn more about Data Analyst with R Course – Enrol Now.
To learn more about Big Data Course – Enrol Now.

To learn more about Machine Learning Using Python and Spark – Enrol Now.
To learn more about Data Analyst with SAS Course – Enrol Now.
To learn more about Data Analyst with Apache Spark Course – Enrol Now.
To learn more about Data Analyst with Market Risk Analytics and Modelling Course – Enrol Now.

Let’s Make Visualizations Better In Python with Matplotlib

Let’s Make Visualizations Better In Python with Matplotlib

Learn the basics of effective graphic designing and create pretty-looking plots, using matplotlib. In fact, not only matplotlib, I will try to give meaningful insights about R/ggplot2, Matlab, Excel, and any other graphing tool you use, that will help you grasp the concepts of graphic designing better.

Simplicity is the ultimate sophistication

To begin with, make sure you remember– less is more, when it is about plotting. Neophyte graphic designers sometimes think that by adding a visually appealing semi-related picture on the background of data visualization, they will make the presentation look better but eventually they are wrong. If not this, then they may also fall prey to less-influential graphic designing flaws, like using a little more of chartjunk.


Data always look better naked. Try to strip it down, instead of adorning it.

Have a look at the following GIF:

“Perfection is achieved not when there is nothing more to add, but when there is nothing left to take away.” – Antoine de Saint-Exupery explained it the best.

Color rules the world

The default color configuration of Matlab is quite awful. Matlab/matplotlib stalwarts may find the colors not that ugly, but it’s undeniable that Tableau’s default color configuration is way better than Matplotlib’s.

Get Tableau certification Pune today! DexLab Analytics offers Tableau BI training courses to the aspiring candidates.

Make use of established default color schemes from leading software that is famous for offering gorgeous plots. Tableau is here with its incredible set of color schemes, right from grayscale and colored to colorblind friendly.

A plenty of graphic designers forget paying heed to the issue of color blindness, which encompasses over 5% of the graphic viewers. For example, if a person suffers from red-green color blindness, it will be completely indecipherable for him to understand the difference between the two categories depicted by red and green plots. So, how will he work then?


For them, it is better to rely upon colorblind friendly color configurations, like Tableau’s “Color Blind 10”.


To run the codes, you need to install the following Python libraries:


  1. Matplotlib
  2. Pandas


Now that we are done with the fundamentals, let’s get started with the coding.
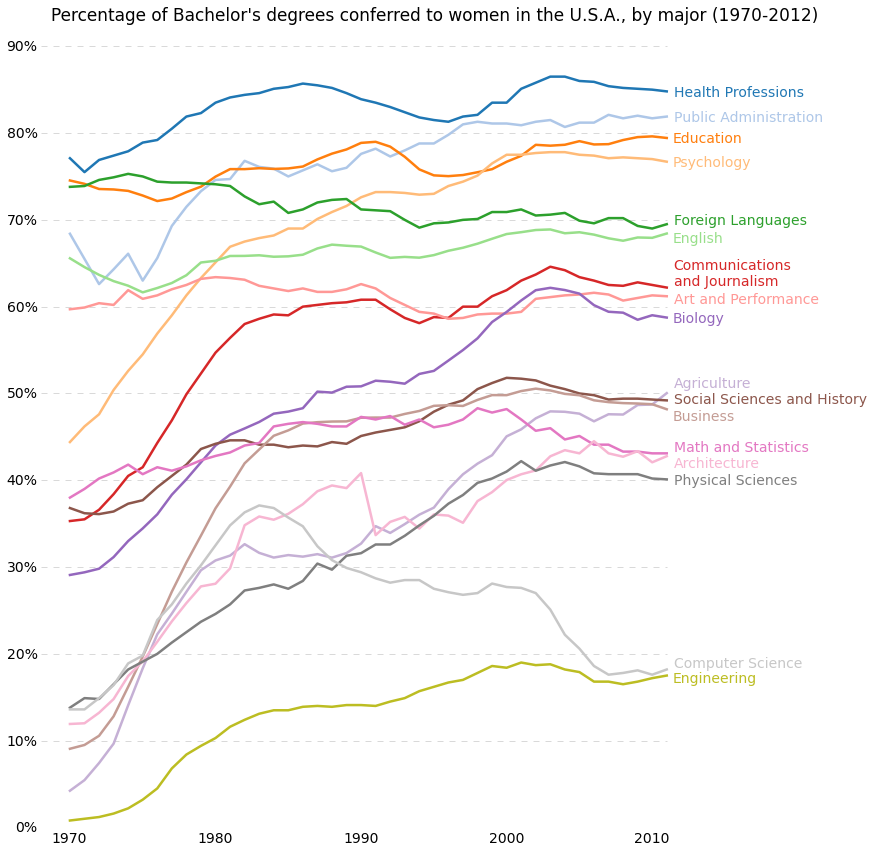
 

percent-bachelors-degrees-women-usa


import matplotlib.pyplot as plt
import pandas as pd

# Read the data into a pandas DataFrame.  
gender_degree_data = pd.read_csv("http://www.randalolson.com/wp-content/uploads/percent-bachelors-degrees-women-usa.csv")  

# These are the "Tableau 20" colors as RGB.  
tableau20 = [(31, 119, 180), (174, 199, 232), (255, 127, 14), (255, 187, 120),  
             (44, 160, 44), (152, 223, 138), (214, 39, 40), (255, 152, 150),  
             (148, 103, 189), (197, 176, 213), (140, 86, 75), (196, 156, 148),  
             (227, 119, 194), (247, 182, 210), (127, 127, 127), (199, 199, 199),  
             (188, 189, 34), (219, 219, 141), (23, 190, 207), (158, 218, 229)]  

# Scale the RGB values to the [0, 1] range, which is the format matplotlib accepts.  
for i in range(len(tableau20)):  
    r, g, b = tableau20[i]  
    tableau20[i] = (r / 255., g / 255., b / 255.)  

# You typically want your plot to be ~1.33x wider than tall. This plot is a rare  
# exception because of the number of lines being plotted on it.  
# Common sizes: (10, 7.5) and (12, 9)  
plt.figure(figsize=(12, 14))  

# Remove the plot frame lines. They are unnecessary chartjunk.  
ax = plt.subplot(111)  
ax.spines["top"].set_visible(False)  
ax.spines["bottom"].set_visible(False)  
ax.spines["right"].set_visible(False)  
ax.spines["left"].set_visible(False)  

# Ensure that the axis ticks only show up on the bottom and left of the plot.  
# Ticks on the right and top of the plot are generally unnecessary chartjunk.  
ax.get_xaxis().tick_bottom()  
ax.get_yaxis().tick_left()  

# Limit the range of the plot to only where the data is.  
# Avoid unnecessary whitespace.  
plt.ylim(0, 90)  
plt.xlim(1968, 2014)  

# Make sure your axis ticks are large enough to be easily read.  
# You don't want your viewers squinting to read your plot.  
plt.yticks(range(0, 91, 10), [str(x) + "%" for x in range(0, 91, 10)], fontsize=14)  
plt.xticks(fontsize=14)  

# Provide tick lines across the plot to help your viewers trace along  
# the axis ticks. Make sure that the lines are light and small so they  
# don't obscure the primary data lines.  
for y in range(10, 91, 10):  
    plt.plot(range(1968, 2012), [y] * len(range(1968, 2012)), "--", lw=0.5, color="black", alpha=0.3)  

# Remove the tick marks; they are unnecessary with the tick lines we just plotted.  
plt.tick_params(axis="both", which="both", bottom="off", top="off",  
                labelbottom="on", left="off", right="off", labelleft="on")  

# Now that the plot is prepared, it's time to actually plot the data!  
# Note that I plotted the majors in order of the highest % in the final year.  
majors = ['Health Professions', 'Public Administration', 'Education', 'Psychology',  
          'Foreign Languages', 'English', 'Communications\nand Journalism',  
          'Art and Performance', 'Biology', 'Agriculture',  
          'Social Sciences and History', 'Business', 'Math and Statistics',  
          'Architecture', 'Physical Sciences', 'Computer Science',  
          'Engineering']  

for rank, column in enumerate(majors):  
    # Plot each line separately with its own color, using the Tableau 20  
    # color set in order.  
    plt.plot(gender_degree_data.Year.values,  
            gender_degree_data[column.replace("\n", " ")].values,  
            lw=2.5, color=tableau20[rank])  

    # Add a text label to the right end of every line. Most of the code below  
    # is adding specific offsets y position because some labels overlapped.  
    y_pos = gender_degree_data[column.replace("\n", " ")].values[-1] - 0.5  
    if column == "Foreign Languages":  
        y_pos += 0.5  
    elif column == "English":  
        y_pos -= 0.5  
    elif column == "Communications\nand Journalism":  
        y_pos += 0.75  
    elif column == "Art and Performance":  
        y_pos -= 0.25  
    elif column == "Agriculture":  
        y_pos += 1.25  
    elif column == "Social Sciences and History":  
        y_pos += 0.25  
    elif column == "Business":  
        y_pos -= 0.75  
    elif column == "Math and Statistics":  
        y_pos += 0.75  
    elif column == "Architecture":  
        y_pos -= 0.75  
    elif column == "Computer Science":  
        y_pos += 0.75  
    elif column == "Engineering":  
        y_pos -= 0.25  

    # Again, make sure that all labels are large enough to be easily read  
    # by the viewer.  
    plt.text(2011.5, y_pos, column, fontsize=14, color=tableau20[rank])  

# matplotlib's title() call centers the title on the plot, but not the graph,  
# so I used the text() call to customize where the title goes.  

# Make the title big enough so it spans the entire plot, but don't make it  
# so big that it requires two lines to show.  

# Note that if the title is descriptive enough, it is unnecessary to include  
# axis labels; they are self-evident, in this plot's case.  
plt.text(1995, 93, "Percentage of Bachelor's degrees conferred to women in the U.S.A."  
       ", by major (1970-2012)", fontsize=17, ha="center")  

# Always include your data source(s) and copyright notice! And for your  
# data sources, tell your viewers exactly where the data came from,  
# preferably with a direct link to the data. Just telling your viewers  
# that you used data from the "U.S. Census Bureau" is completely useless:  
# the U.S. Census Bureau provides all kinds of data, so how are your  
# viewers supposed to know which data set you used?  
plt.text(1966, -8, "Data source: nces.ed.gov/programs/digest/2013menu_tables.asp"  
       "\nAuthor: Randy Olson (randalolson.com / @randal_olson)"  
       "\nNote: Some majors are missing because the historical data "  
       "is not available for them", fontsize=10)  

# Finally, save the figure as a PNG.  
# You can also save it as a PDF, JPEG, etc.  
# Just change the file extension in this call.  
# bbox_inches="tight" removes all the extra whitespace on the edges of your plot.  
plt.savefig("percent-bachelors-degrees-women-usa.png", bbox_inches="tight")
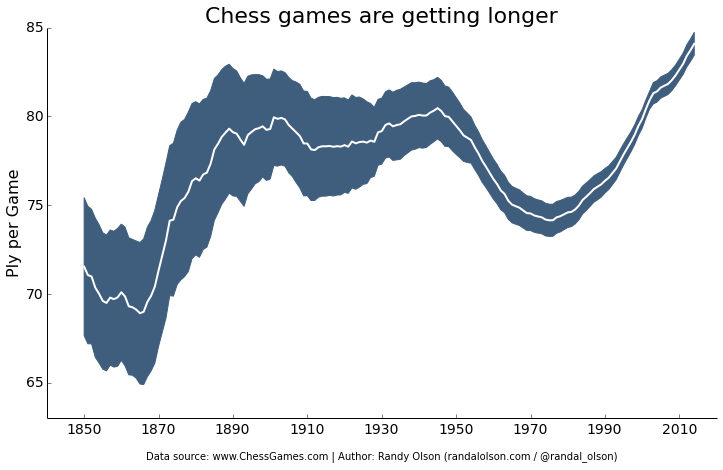
 

chess-number-ply-over-time
 

import pandas as pd
import matplotlib.pyplot as plt
from scipy.stats import sem

# This function takes an array of numbers and smoothes them out.
# Smoothing is useful for making plots a little easier to read.
def sliding_mean(data_array, window=5):
    data_array = array(data_array)
    new_list = []
    for i in range(len(data_array)):
        indices = range(max(i - window + 1, 0),
                        min(i + window + 1, len(data_array)))
        avg = 0
        for j in indices:
            avg += data_array[j]
        avg /= float(len(indices))
        new_list.append(avg)
        
    return array(new_list)

# Due to an agreement with the ChessGames.com admin, I cannot make the data
# for this plot publicly available. This function reads in and parses the
# chess data set into a tabulated pandas DataFrame.
chess_data = read_chess_data()

# These variables are where we put the years (x-axis), means (y-axis), and error bar values.
# We could just as easily replace the means with medians,
# and standard errors (SEMs) with standard deviations (STDs).
years = chess_data.groupby("Year").PlyCount.mean().keys()
mean_PlyCount = sliding_mean(chess_data.groupby("Year").PlyCount.mean().values,
                             window=10)
sem_PlyCount = sliding_mean(chess_data.groupby("Year").PlyCount.apply(sem).mul(1.96).values,
                            window=10)

# You typically want your plot to be ~1.33x wider than tall.
# Common sizes: (10, 7.5) and (12, 9)
plt.figure(figsize=(12, 9))

# Remove the plot frame lines. They are unnecessary chartjunk.
ax = plt.subplot(111)
ax.spines["top"].set_visible(False)
ax.spines["right"].set_visible(False)

# Ensure that the axis ticks only show up on the bottom and left of the plot.
# Ticks on the right and top of the plot are generally unnecessary chartjunk.
ax.get_xaxis().tick_bottom()
ax.get_yaxis().tick_left()

# Limit the range of the plot to only where the data is.
# Avoid unnecessary whitespace.
plt.ylim(63, 85)

# Make sure your axis ticks are large enough to be easily read.
# You don't want your viewers squinting to read your plot.
plt.xticks(range(1850, 2011, 20), fontsize=14)
plt.yticks(range(65, 86, 5), fontsize=14)

# Along the same vein, make sure your axis labels are large
# enough to be easily read as well. Make them slightly larger
# than your axis tick labels so they stand out.
plt.ylabel("Ply per Game", fontsize=16)

# Use matplotlib's fill_between() call to create error bars.
# Use the dark blue "#3F5D7D" as a nice fill color.
plt.fill_between(years, mean_PlyCount - sem_PlyCount,
                 mean_PlyCount + sem_PlyCount, color="#3F5D7D")

# Plot the means as a white line in between the error bars. 
# White stands out best against the dark blue.
plt.plot(years, mean_PlyCount, color="white", lw=2)

# Make the title big enough so it spans the entire plot, but don't make it
# so big that it requires two lines to show.
plt.title("Chess games are getting longer", fontsize=22)

# Always include your data source(s) and copyright notice! And for your
# data sources, tell your viewers exactly where the data came from,
# preferably with a direct link to the data. Just telling your viewers
# that you used data from the "U.S. Census Bureau" is completely useless:
# the U.S. Census Bureau provides all kinds of data, so how are your
# viewers supposed to know which data set you used?
plt.xlabel("\nData source: www.ChessGames.com | "
           "Author: Randy Olson (randalolson.com / @randal_olson)", fontsize=10)

# Finally, save the figure as a PNG.
# You can also save it as a PDF, JPEG, etc.
# Just change the file extension in this call.
# bbox_inches="tight" removes all the extra whitespace on the edges of your plot.
plt.savefig("chess-number-ply-over-time.png", bbox_inches="tight");

Histograms
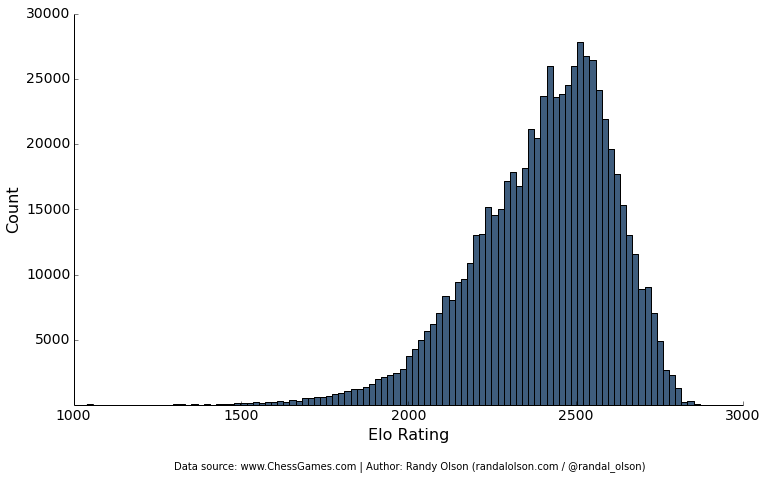
 
chess-elo-rating-distribution


import pandas as pd
import matplotlib.pyplot as plt

# Due to an agreement with the ChessGames.com admin, I cannot make the data
# for this plot publicly available. This function reads in and parses the
# chess data set into a tabulated pandas DataFrame.
chess_data = read_chess_data()

# You typically want your plot to be ~1.33x wider than tall.
# Common sizes: (10, 7.5) and (12, 9)
plt.figure(figsize=(12, 9))

# Remove the plot frame lines. They are unnecessary chartjunk.
ax = plt.subplot(111)
ax.spines["top"].set_visible(False)
ax.spines["right"].set_visible(False)

# Ensure that the axis ticks only show up on the bottom and left of the plot.
# Ticks on the right and top of the plot are generally unnecessary chartjunk.
ax.get_xaxis().tick_bottom()
ax.get_yaxis().tick_left()

# Make sure your axis ticks are large enough to be easily read.
# You don't want your viewers squinting to read your plot.
plt.xticks(fontsize=14)
plt.yticks(range(5000, 30001, 5000), fontsize=14)

# Along the same vein, make sure your axis labels are large
# enough to be easily read as well. Make them slightly larger
# than your axis tick labels so they stand out.
plt.xlabel("Elo Rating", fontsize=16)
plt.ylabel("Count", fontsize=16)

# Plot the histogram. Note that all I'm passing here is a list of numbers.
# matplotlib automatically counts and bins the frequencies for us.
# "#3F5D7D" is the nice dark blue color.
# Make sure the data is sorted into enough bins so you can see the distribution.
plt.hist(list(chess_data.WhiteElo.values) + list(chess_data.BlackElo.values),
         color="#3F5D7D", bins=100)

# Always include your data source(s) and copyright notice! And for your
# data sources, tell your viewers exactly where the data came from,
# preferably with a direct link to the data. Just telling your viewers
# that you used data from the "U.S. Census Bureau" is completely useless:
# the U.S. Census Bureau provides all kinds of data, so how are your
# viewers supposed to know which data set you used?
plt.text(1300, -5000, "Data source: www.ChessGames.com | "
         "Author: Randy Olson (randalolson.com / @randal_olson)", fontsize=10)

# Finally, save the figure as a PNG.
# You can also save it as a PDF, JPEG, etc.
# Just change the file extension in this call.
# bbox_inches="tight" removes all the extra whitespace on the edges of your plot.
plt.savefig("chess-elo-rating-distribution.png", bbox_inches="tight");

Here Goes the Bonus

It takes one more line of code to transform your matplotlib into a phenomenal interactive.


Learn more such tutorials only at DexLab Analytics. We make data visualizations easier by providing excellent Python courses in India. In just few months, you will cover advanced topics and more, which will help you make a career in data analytics.


Interested in a career in Data Analyst?

To learn more about Machine Learning Using Python and Spark – click here.
To learn more about Data Analyst with Advanced excel course – click here.
To learn more about Data Analyst with SAS Course – click here.
To learn more about Data Analyst with R Course – click here.
To learn more about Big Data Course – click here.
Python Vs R- Which You Want To Learn First

Python Vs R- Which You Want To Learn First

If Big Data interests you as a career choice and you are pretty much aware of the skills you need in order to be proficient in this field, in all likelihood you must be aware that R and Python are two leading languages used for analyzing data. And in case you are not really sure as to learn which of the mentioned articles first, this post will help you in making that decision.

2

In the field of analysis of data, R and Python both are free solutions that are easy to install and get started with. And it is normal for the layman to wonder which to learn first. But you may thank the heavens as both are excellent choices.

Let’s Make Visualizations Better In Python with Matplotlib – @Dexlabanalytics.

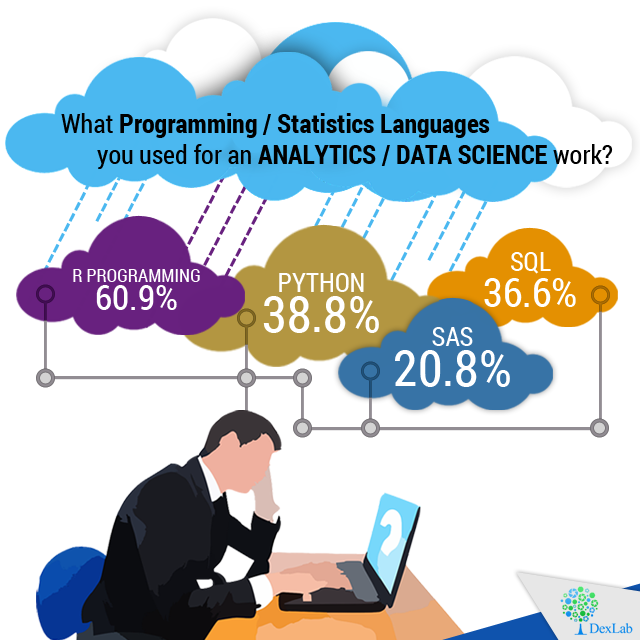
A recent poll on the most widely used programming languages for analytics and data science reveal the following:

Python Vs R- Which You Want To Learn First


Reasons to Choose R

R has an illustrious history that stretches for a considerable period of time. In addition you receive support from an active, dedicated and thriving community. That translates to the fact that you are more likely to be helped in case you are in need of some assistance or have any queries to resolve. In addition another factor that works in the favor of R is the abundance of packages that contribute greatly to increasing its functionality and make it more accessible which put R as one of the front runners to being the data science tool of choice. R works well with computer languages like Java, C and C++.

How to Parse Data with Python – @Dexlabanalytics.

In situations that call for heavy tasks in statistical analysis as well as creating graphics R programming is the tool that you want to turn to. In R, you are able to perform convoluted mathematical operations with surprising ease like matrix multiplication. And the array-centered syntax of the language make the process of translating the math into lines of code far easier which especially true of persons with little or no coding knowledge and experience.

Reasons to Opt for Python

In contrast to the specialized nature of R, Python is a programming language that serves general purposes and is able to perform a variety of tasks like munging data, engineering and wrangling data, building web applications and scraping websites amongst others. It is also the easier one to master among the two especially if you have learned an OOP or object-oriented programming language previously. In addition the Code written in Python is scalable and may be maintained with more robust code than it is possible in case of R.

The Choice Between SAS Vs. R Vs. Python: Which to Learn First? – @Dexlabanalytics.

Though the data packages available are not as large and comprehensive as R, Python when used in conjunction with tools like Numpy, Pandas, Scikit etc it comes pretty close to the comprehensive functionality of R. Python is also being adopted for tasks like statistical work of intermediate and basic complexity as well as machine learning.


Interested in a career in Data Analyst?

To learn more about Data Analyst with Advanced excel course – Enrol Now.
To learn more about Data Analyst with R Course – Enrol Now.
To learn more about Big Data Course – Enrol Now.

To learn more about Machine Learning Using Python and Spark – Enrol Now.
To learn more about Data Analyst with SAS Course – Enrol Now.
To learn more about Data Analyst with Apache Spark Course – Enrol Now.
To learn more about Data Analyst with Market Risk Analytics and Modelling Course – Enrol Now.

Call us to know more