predictive analytics certification Archives - DexLab Analytics | Big Data Hadoop SAS R Analytics Predictive Modeling & Excel VBA

ARIMA (Auto-Regressive Integrated Moving Average)

arima-time series-dexlab analytics

This is another blog added to the series of time series forecasting. In this particular blog  I will be discussing about the basic concepts of ARIMA model.

So what is ARIMA?

ARIMA also known as Autoregressive Integrated Moving Average is a time series forecasting model that helps us predict the future values on the basis of the past values. This model predicts the future values on the basis of the data’s own lags and its lagged errors.

When a  data does not reflect any seasonal changes and plus it does not have a pattern of random white noise or residual then  an ARIMA model can be used for forecasting.

There are three parameters attributed to an ARIMA model p, q and d :-

p :- corresponds to the autoregressive part

q:- corresponds to the moving average part.

d:- corresponds to number of differencing required to make the data stationary.

In our previous blog we have already discussed in detail what is p and q but what we haven’t discussed is what is d and what is the meaning of differencing (a term missing in ARMA model).

Since AR is a linear regression model and works best when the independent variables are not correlated, differencing can be used to make the model stationary which is subtracting the previous value from the current value so that the prediction of any further values can be stabilized .  In case the model is already stationary the value of d=0. Therefore “differencing is the minimum number of deductions required to make the model stationary”. The order of d depends on exactly when your model becomes stationary i.e. in case  the autocorrelation is positive over 10 lags then we can do further differencing otherwise in case autocorrelation is very negative at the first lag then we have an over-differenced series.

The formula for the ARIMA model would be:-

To check if ARIMA model is suited for our dataset i.e. to check the stationary of the data we will apply Dickey Fuller test and depending on the results we will  using differencing.

In my next blog I will be discussing about how to perform time series forecasting using ARIMA model manually and what is Dickey Fuller test and how to apply that, so just keep on following us for more.

So, with that we come to the end of the discussion on the ARIMA Model. Hopefully it helped you understand the topic, for more information you can also watch the video tutorial attached down this blog. The blog is designed and prepared by Niharika Rai, Analytics Consultant, DexLab Analytics DexLab Analytics offers machine learning courses in Gurgaon. To keep on learning more, follow DexLab Analytics blog.


.
ARMA- Time Series Analysis Part 4

ARMA Time series DexLab Analytics

ARMA(p,q) model in time series forecasting is a combination of Autoregressive  Process also known as AR Process and Moving Average (MA) Process where p corresponds to the autoregressive part and q corresponds to the moving average part.


Autoregressive Process (AR) :- When the value of Yt in a time series data is regressed over its own past value then it is called an autoregressive process where p is the order of lag into consideration.

Where,

Yt = observation which we need to find out.

α1= parameter of an autoregressive model

Yt-1= observation in the previous period

ut= error term

The equation above follows the first order of autoregressive process or AR(1) and the value of p is 1. Hence the value of Yt in the period ‘t’ depends upon its previous year value and a random term.

Moving Average (MA) Process :- When the value of Yt  of order q in a time series data depends on the weighted sum of current and the q recent errors i.e. a linear combination of error terms then it is called a moving average process which can be written as :-

yt = observation which we need to find out

α= constant term

βut-q= error over the period q .

ARMA (Autoregressive Moving Average) Process :-

The above equation shows that value of Y in time period ‘t’ can be derived by taking into consideration the order of lag p which in the above case is 1 i.e. previous year’s observation and the weighted average of the error term over a period of time q which in case of the above equation is 1.

How to decide the value of p and q?

Two of the most important methods to obtain the best possible values of p and q are ACF and PACF plots.

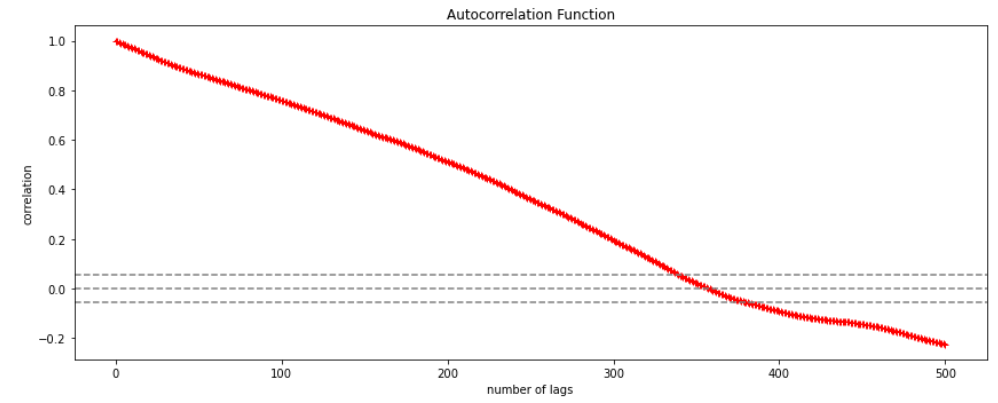
ACF (Auto-correlation function) :- This function calculates the auto-correlation of the complete data on the basis of lagged values which when plotted helps us choose the value of q that is to be considered to find the value of Yt. In simple words how many years residual can help us predict the value of Yt can obtained with the help of ACF, if the value of correlation is above a certain point then that amount of lagged values can be used to predict Yt.

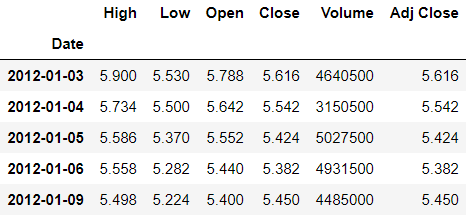
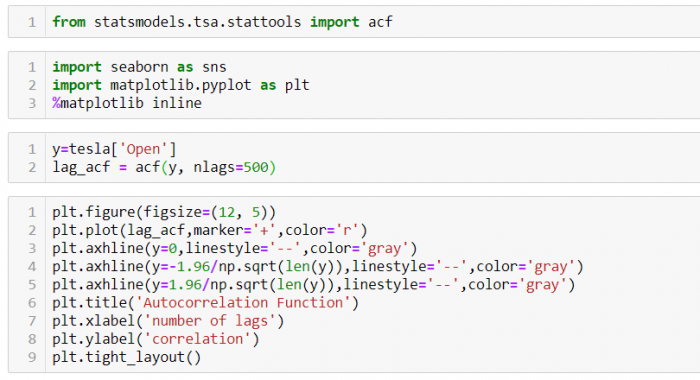
Using the stock price of tesla between the years 2012 and 2017 we can use the .acf() method in python to obtain the value of p.

.DataReader() method is used to extract the data from web.

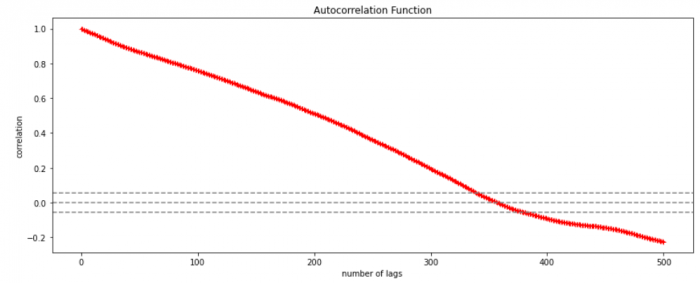
The above graph shows that beyond the lag 350 the correlation moved towards 0 and then negative.

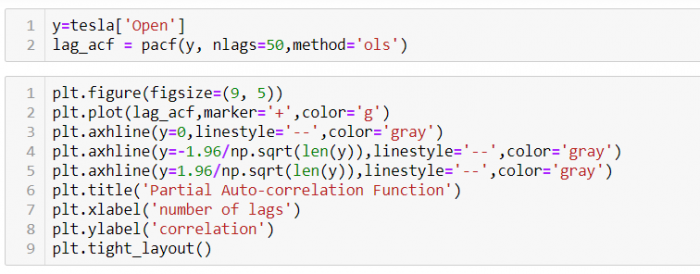
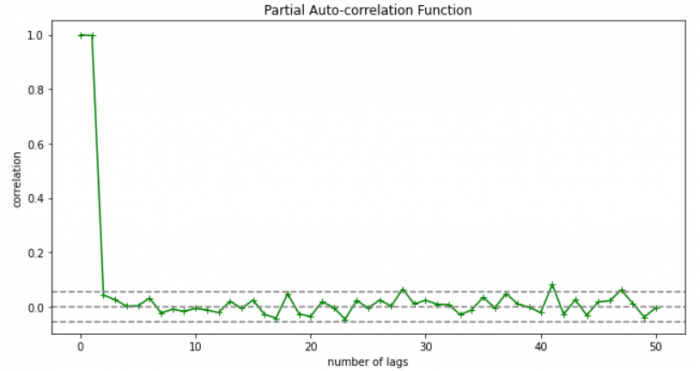
PACF (Partial auto-correlation function) :- Pacf helps find the direct effect of the past lag by removing the residual effect of the lags in between. Pacf helps in obtaining the value of AR where as acf helps in obtaining the value of MA i.e. q. Both the methods together can be use find the optimum value of p and q in a time series data set.

Lets check out how to apply pacf in python.

As you can see in the above graph after the second lag the line moved within the confidence band therefore the value of p will be 2.


So, with that we come to the end of the discussion on the ARMA Model. Hopefully it helped you understand the topic, for more information you can also watch the video tutorial attached down this blog. The blog is designed and prepared by Niharika Rai, Analytics Consultant, DexLab Analytics DexLab Analytics offers machine learning courses in Gurgaon. To keep on learning more, follow DexLab Analytics blog.


.
Time Series Analysis & Modelling with Python (Part II) – Data Smoothing

dexlab_time_series

Data Smoothing is done to better understand the hidden patterns in the data. In the non- stationary processes, it is very hard to forecast the data as the variance over a period of time changes, therefore data smoothing techniques are used to smooth out the irregular roughness to see a clearer signal.

In this segment we will be discussing two of the most important data smoothing techniques :-

  • Moving average smoothing
  • Exponential smoothing

Moving average smoothing

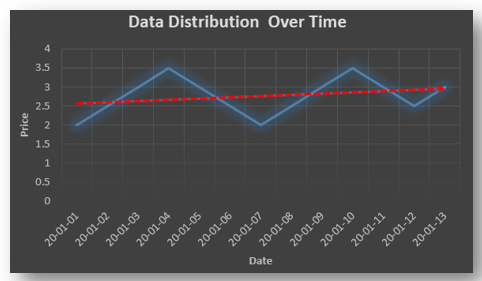
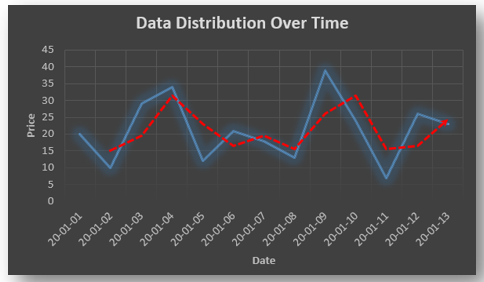
Moving average is a technique where subsets of original data are created and then average of each subset is taken to smooth out the data and find the value in between each subset which better helps to see the trend over a period of time.

Lets take an example to better understand the problem.

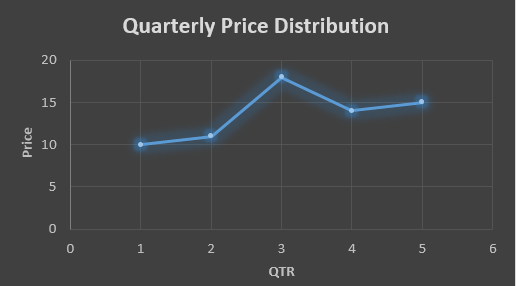
Suppose that we have a data of price observed over a period of time and it is a non-stationary data so that the tend is hard to recognize.

QTR (quarter)Price
110
211
318
414
515
6?


In the above data we don’t know the value of the 6th quarter.

….fig (1)

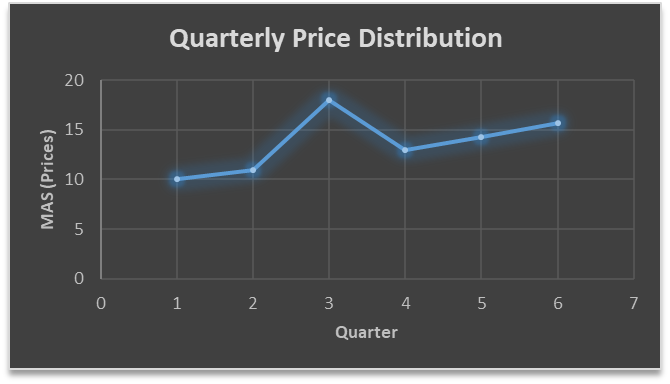
The plot above shows that there is no trend the data is following so to better understand the pattern we calculate the moving average over three quarter at a time so that we get in between values as well as we get the missing value of the 6th quarter.

To find the missing value of 6th quarter we will use previous three quarter’s data i.e.

MAS =  = 15.7

QTR (quarter)Price
110
211
318
414
515
615.7

MAS =  = 13

MAS =  = 14.33

QTR (quarter)PriceMAS (Price)
11010
21111
31818
41413
51514.33
615.715.7


….. fig (2)

In the above graph we can see that after 3rd quarter there is an upward sloping trend in the data.

Exponential Data Smoothing

In this method a larger weight ( ) which lies between 0 & 1 is given to the most recent observations and as the observation grows more distant the weight decreases exponentially.

The weights are decided on the basis how the data is, in case the data has low movement then we will choose the value of  closer to 0 and in case the data has a lot more randomness then in that case we would like to choose the value of  closer to 1.

EMA= Ft= Ft-1 + (At-1 – Ft-1)

Now lets see a practical example.

For this example we will be taking  = 0.5

Taking the same data……

QTR (quarter)Price

(At)

EMS Price(Ft)
11010
211?
318?
414?
515?
6??


To find the value of yellow cell we need to find out the value of all the blue cells and since we do not have the initial value of F1 we will use the value of A1. Now lets do the calculation:-

F2=10+0.5(10 – 10) = 10

F3=10+0.5(11 – 10) = 10.5

F4=10.5+0.5(18 – 10.5) = 14.25

F5=14.25+0.5(14 – 14.25) = 14.13

F6=14.13+0.5(15 – 14.13)= 14.56

QTR (quarter)Price

(At)

EMS Price(Ft)
11010
21110
31810.5
41414.25
51514.13
614.5614.56

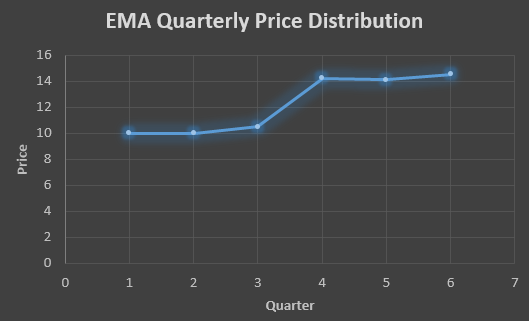
In the above graph we see that there is a trend now where the data is moving in the upward direction.

So, with that we come to the end of the discussion on the Data smoothing method. Hopefully it helped you understand the topic, for more information you can also watch the video tutorial attached down this blog. The blog is designed and prepared by Niharika Rai, Analytics Consultant, DexLab Analytics DexLab Analytics offers machine learning courses in Gurgaon. To keep on learning more, follow DexLab Analytics blog.


.

Time Series Analysis Part I


A time series is a sequence of numerical data in which each item is associated with a particular instant in time. Many sets of data appear as time series: a monthly sequence of the quantity of goods shipped from a factory, a weekly series of the number of road accidents, daily rainfall amounts, hourly observations made on the yield of a chemical process, and so on. Examples of time series abound in such fields as economics, business, engineering, the natural sciences (especially geophysics and meteorology), and the social sciences.

  • Univariate time series analysis- When we have a single sequence of data observed over time then it is called univariate time series analysis.
  • Multivariate time series analysis – When we have several sets of data for the same sequence of time periods to observe then it is called multivariate time series analysis.

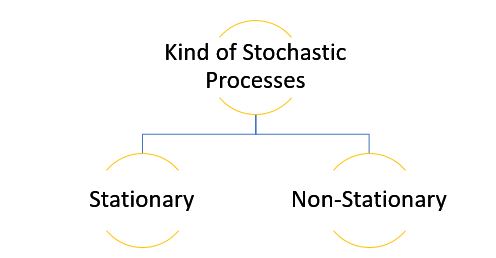
The data used in time series analysis is a random variable (Yt) where t is denoted as time and such a collection of random variables ordered in time is called random or stochastic process.

Stationary: A time series is said to be stationary when all the moments of its probability distribution i.e. mean, variance , covariance etc. are invariant over time. It becomes quite easy forecast data in this kind of situation as the hidden patterns are recognizable which make predictions easy.

Non-stationary: A non-stationary time series will have a time varying mean or time varying variance or both, which makes it impossible to generalize the time series over other time periods.

Non stationary processes can further be explained with the help of a term called Random walk models. This term or theory usually is used in stock market which assumes that stock prices are independent of each other over time. Now there are two types of random walks:
Random walk with drift : When the observation that is to be predicted at a time ‘t’ is equal to last period’s value plus a constant or a drift (α) and the residual term (ε). It can be written as
Yt= α + Yt-1 + εt
The equation shows that Yt drifts upwards or downwards depending upon α being positive or negative and the mean and the variance also increases over time.
Random walk without drift: The random walk without a drift model observes that the values to be predicted at time ‘t’ is equal to last past period’s value plus a random shock.
Yt= Yt-1 + εt
Consider that the effect in one unit shock then the process started at some time 0 with a value of Y0
When t=1
Y1= Y0 + ε1
When t=2
Y2= Y1+ ε2= Y0 + ε1+ ε2
In general,
Yt= Y0+∑ εt
In this case as t increases the variance increases indefinitely whereas the mean value of Y is equal to its initial or starting value. Therefore the random walk model without drift is a non-stationary process.

So, with that we come to the end of the discussion on the Time Series. Hopefully it helped you understand time Series, for more information you can also watch the video tutorial attached down this blog. DexLab Analytics offers machine learning courses in delhi. To keep on learning more, follow DexLab Analytics blog.


.

Top 5 Industry Use Cases of Predictive Analytics

Top 5 Industry Use Cases of Predictive Analytics

Predictive analytics is an effective in-hand tool crafted for data scientists. Thanks to its quick computing and on-point forecasting abilities! Not only data scientists, but also insurance claim analysts, retail managers and healthcare professionals enjoy the perks of predictive analytics modeling – want to know how?

Below, we’ve enumerated a few real-life use cases, existing across industries, threaded with the power of data science and predictive analytics. Ask us, if you have any queries for your next data science project! Our data science courses in Delhi might be of some help.

Customer Retention

Losing customers is awful. For businesses. They have to gain new customers to make up for the loss in revenue. But, it can cost more, winning new customers is usually hailed more costly than retaining older ones.

Predictive analytics is the answer. It can prevent reduction in the customer base. How? By foretelling you the signs of customer dissatisfaction and identifying the customers that are most likely to leave. In this way, you would know how to keep your customers satisfied and content, and control revenue slip offs.

Customer Lifetime Value

Marketing a product is the crux of the matter. Identifying customers willing to spend a large part of their money, consistently for a long period of time is difficult to find. But once cracked, it helps companies optimize their marketing efforts and enhance their customer lifetime value.

2

Quality Control

Quality Control is significant. Over time, shoddy quality control measures will affect customer satisfaction ratio, purchasing behavior, thus impacting revenue generation and market share.

Further, low quality control results in more customer support expenses, repairs and warranty challenges and less systematic manufacturing. Predictive analytics help provide insights on potential quality issues, before they turn into crucial company growth hindrances.  

Risk Modeling

Risk can originate from a plethora of source, and it can be any form. Predictive analytics can address critical aspects of risk – it collects a huge number of data points from many organizations and sort through them to determine the potential areas of concern.

What’s more, the trends in the data hint towards unfavorable circumstances that might impact businesses and bottom line in an adverse way. A concoction of these analytics and a sound risk management approach is what companies truly need to quantify the risk challenges and devise a perfect course of action that’s indeed the need of the hour.

Sentiment Analysis

It’s impossible to be everywhere, especially when being online. Similarly, it’s very difficult to oversee everything that’s said about your company.

Nevertheless, if you amalgamate web search and a few crawling tools with customer feedback and posts, you’d be able to develop analytics that’d present you an overview of the organization’s reputation along with its key market demographics and more. Recommendation system helps!

All hail Predictive Analytics! Now, maneuver beyond fuss-free reactive operations and let predictive analytics help you plan for a successful future, evaluating newer areas of business scopes and capabilities.

Interested in data science certification? Look up to the experts at DexLab Analytics.

The blog has been sourced fromxmpro.com/10-predictive-analytics-use-cases-by-industry

Interested in a career in Data Analyst?

To learn more about Data Analyst with Advanced excel course – Enrol Now.
To learn more about Data Analyst with R Course – Enrol Now.
To learn more about Big Data Course – Enrol Now.

To learn more about Machine Learning Using Python and Spark – Enrol Now.
To learn more about Data Analyst with SAS Course – Enrol Now.
To learn more about Data Analyst with Apache Spark Course – Enrol Now.
To learn more about Data Analyst with Market Risk Analytics and Modelling Course – Enrol Now.

Predictive Analytics: The Key to Enhance the Process of Debt Collection

Predictive Analytics: The Key to Enhance the Process of Debt Collection

A wide array of industries has already engaged in some kind of predictive analytics – numerical analysis of debt collection is relatively a recent addition. Financial analysts are now found harnessing the power of predictive analytics to cull better results out for their clients, and measure the effectiveness of their strategies and collections.

Let’s see how predictive analytics is used in debt collection process:

2

Understanding Client Scoring (Risk Assessment)

Since the late 1980’s, FICO score is regarded as the golden standard for determining creditworthiness and loan application. But, however, machine learning, particularly predictive analytics can replace it, and develop an encompassing portrait of a client, taking into effect more than his mere credit history and present debts. It can also include his social media feeds and spending trajectory.

Evaluating Payment Patterns

The survival models evaluate each client’s probability of becoming a potential loss. If the account shows a continuous downward trend, then it should be regarded soon as a potential risk. Predictive analytics can help identify spending patterns, indicating the struggles of each client. A system can be developed which self-triggers whenever any unwanted pattern transpires. It could ask the client if they need any help or if they are going through a financial distress, so that it can help before the situation turns beyond repairs.

For R predictive modeling training courses, visit DexLab Analytics.

Cash Flow Predictions

Businesses are keen to know about future cash flows – what they can expect! Financial institutions are no different. Predictive analytics helps in making more appropriate predictions, especially when it comes to receivables.

Debt collector’s business models are subject to the ability to forecast the success of collection operations, and ascertaining results at the end of each month, before the billing cycle initiates. As a result, the workforce of the company is able to shift their focus from the potential payers to those who would not be able to meet their obligations. This shift in focus helps!

Better Client Relationship

Predictive analytics weave wonders; not only it has the ability to point which clients are the highest risks for your company, but also predict the best time to contact them to reap maximum results. What you need to do is just visit the logs of past conversations.

Challenges

Last, but not the least, all big data models face a common challenge – data cleaning. As it’s a process of wastage in and out, before starting with prediction, company should deal with this problem at first to construct a pipeline, for feeding in the data, clean it and use it for neural network training.

In a concluding statement, predictive analytics is the best bet for debt and revenue collection – it boosts conversion rates at the right time with the right people. If you want to study more about predictive analytics, and its varying uses in different segments of industry, enroll in R Predictive Modelling Certification training at DexLab Analytics. They provide superior knowledge-intensive training to interested individuals with added benefit of placement assistance. For more, visit their website.


The blog has been sourced fromdataconomy.com/2018/09/improving-debt-collection-with-predictive-models


Interested in a career in Data Analyst?

To learn more about Data Analyst with Advanced excel course – Enrol Now.
To learn more about Data Analyst with R Course – Enrol Now.
To learn more about Big Data Course – Enrol Now.

To learn more about Machine Learning Using Python and Spark – Enrol Now.
To learn more about Data Analyst with SAS Course – Enrol Now.
To learn more about Data Analyst with Apache Spark Course – Enrol Now.
To learn more about Data Analyst with Market Risk Analytics and Modelling Course – Enrol Now.

Call us to know more