Online ms excel certification Archives - DexLab Analytics | Big Data Hadoop SAS R Analytics Predictive Modeling & Excel VBA

Master the Art and Science of MS Excel with These Cool Tips and Tricks

Spreadsheets are savior. In majority of industries, they have become a necessity. With ample filling rows and columns inundated with data points, Excel is the need of the hour. It is a top notch application for creating and managing spreadsheets.

Master the Art and Science of MS Excel with These Cool Tips and Tricks

But, remember the bigger the Excel gets, the uglier it starts to get, and that’s the time when you need to use a set of tricks and features to keep a tab on the data compilation. Here we’ve compiled a set of tips on Excel to help enhance your productivity.

Read on.

Select All

For selecting a specific grid of cell, no worries; simply click and drag. But what happens, when you want to select the entire lot? In cases like such, you can either use a keyboard shortcut Ctrl + “A” in Windows 10 and Command + “A” in MacOS or directly go up to the smaller cell in the upper-left corner and hit it.

Hiding or Unhiding Rows

Want to hide rows or columns of data? It mostly happens when you want to print copies of any event, where the audience needs to see only the important parts. Fortunately, it’s quite easy to hide rows and columns in Excel. Right click it, and Hide. That’s all.

Note: When you’re unhiding rows and columns, both, you have to unhide one axis at a time.


Drop Down List

Drop down menu is the best option when you want to restrict the stream of options a user puts into a cell. You can easily create one that provides users a comprehensive list of options to choose from. Just, choose a cell, go to the data tab and click on Validate.

Use of VLOOKUP

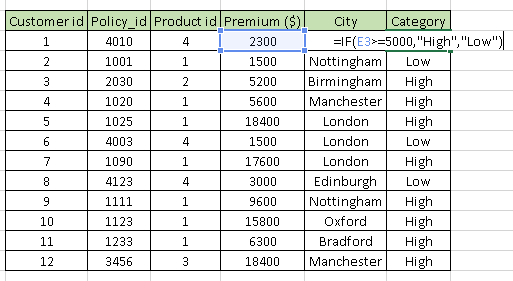
Want to retrieve information from a specified cell? For an instance, suppose you possess an inventory of a store, and want to check the price of any single item. You can use Excel’s VLOOKUP function. It lets you select a range of columns consisting relevant data, a particular column to pick out the output and a cell to deliver output at.

Shading Every Other Row

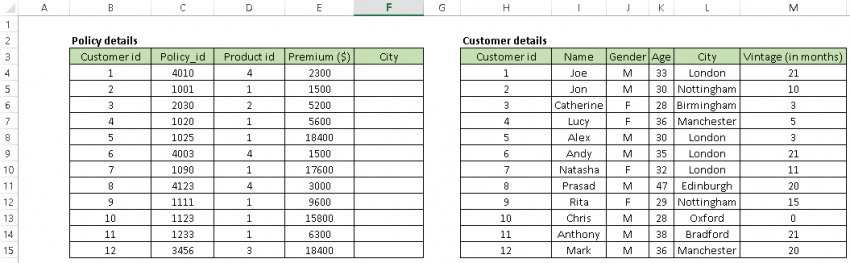
Spreadsheets can be really boring, and if you’ve got lots of data, the chances of reader’s eyes drifting here and there get high. Hence, adding a dash of color on the spreadsheet will try to fix the gaze of the viewers. So try shading rows of importance. It will make them more visible and prompt to the eyes.

To color the entire spreadsheet, select all. And if you want to color any particular area, apply effects only on that region.

Concatenate

If you want to reorganize data and integrate information from different cells all into a single field, use concatenate function.

Wrap Text

What happens when a lot of text gets accumulated in a single cell? Obviously, the text spills over into adjacent cells, which doesn’t look nice visually.

Luckily, it’s easy to wrap a text within a cell. Just select the cell with more text, right-click and select Format Cells.

Now, get ready to master Excel!

Let’s Take Your Data Dreams to the Next Level

DexLab Analytics is a top notch Excel institute in Delhi that caters to the needs of MS Excel aspirants. Their Advanced Excel course in Gurgaon is assembled by the experts and curated to perfection!

The blog has been sourced from – https://www.digitaltrends.com/computing/microsoft-excel-tips-and-tricks


Interested in a career in Data Analyst?

To learn more about Machine Learning Using Python and Spark – click here.

To learn more about Data Analyst with Advanced excel course – click here.
To learn more about Data Analyst with SAS Course – click here.
To learn more about Data Analyst with R Course – click here.
To learn more about Big Data Course – click here.

Microsoft Excel is Revamping Itself and We Can’t be Happier

Good News: Your favorite Microsoft Excel is about to get a lot smarter, and tech-savvy.

 
Microsoft Excel is Revamping Itself and We Can’t be Happier
 

How? Thanks to machine learning and improved connection with the outside world.


Recently, Microsoft’s general manager for Office, Jared Spataro and company’s director of Office 365 ecosystem marketing, Rob Howard talked about how Excel is soon going to understand more about the inputs given and drag out additional information from the internet, as and when deemed necessary.

Continue reading “Microsoft Excel is Revamping Itself and We Can’t be Happier”

How Much Excel Excels in Deriving Rich ‘Insights’ from Your Data

For millions, Excel is the ultimate tool to understand data and frame insights. It makes analysis easy as pie and intuitive for all. Those who are well acquainted with Excel might know about Insights – it is the newest artificial intelligence-backed capability that rolled out in preview to Office Insiders last month.

How Much Excel Excels in Deriving Rich ‘Insights’ from Your Data

A quick note on Insights

Insights is a brand new service used to highlight patterns it identifies from your data, aiding you discover and inspect new insights, like outliers, trends and several other relevant visualizations and analyses. It will take special care to find out intriguing trends in your data and offer concise summaries with charts and PivotTables. As it’s powered by machine learning, the capability to churn out advanced analysis tends to increase as usage grows.

Continue reading “How Much Excel Excels in Deriving Rich ‘Insights’ from Your Data”

The Boons of Technology: How Excel Has Changed Workplace Dynamics

Microsoft Excel is a smorgasbord of information – it is a staple technology tool in any business environment. Whether you are crunching business data, organizing client sales inventory or planning an office event, Excel is arguably the most powerful tool entrenched across multiple business domains worldwide.

 
The Boons of Technology: How Excel Has Changed Workplace Dynamics
 

Aspiring professionals contemplating to make an entry into the workplace are required to excel on Excel tricks – Excel Dashboards Training Pune from DexLab Analytics is a promising gateway to your dreams!

Continue reading “The Boons of Technology: How Excel Has Changed Workplace Dynamics”

10 Amazing Excel Templates to Help Maintain an Organized Budget

10 Amazing Excel Templates to Help Maintain an Organized Budget

Managing a proper budget is an essential task. Professionals working in enterprises are somehow involved in performing this task to some degree. Fortunately, a handful number of budgeting Excel templates is available online – check out some of our favorites:

Back to the basics, budget is something more than an educative, future projection of what should happen to a company’s financial position over a specific course of time, based on the latest trends, current data and previous history. The accuracy of the entire forecast depends on the quality of financial data accumulated during the budget period – it is here that a robust set of data collection tools saves the day.

Here’s a roundup of some of the most useful and easy-to-use budget-related MS Excel templates – most of them are available and are for free. Let’s check them out:

Microsoft Office Templates

When it comes to software, Microsoft remains unbeatable. It offers few applaud-worthy customizable office templates that help you become more productive in implementing programs, perform tasks and track financial budgets. Some of them are below:

Business Expense Report

Business travel expense report is one of the most popular budget reporting activities. For reimbursement of travel expenses, the employee needs to present detailed accounts of expenditures. The Excel template in here is easy to fill up, less time-consuming and removes the frustration caused due to tracking expenses in a business trip.

Project Budget

Project Budget template helps you evaluate your project’s design, development and delivery costs so as to monitor actual expenses that occur thereafter.


bfreeexcelbudget

Profit and Loss Statement

An all-inclusive profit and loss statement is fundamental for any enterprise. Whether it’s on a departmental level or encompassing an entire organization, determining profit and loss in the financial statement is important to put into focus the problematic areas of your business. The Excel template helps in calculating both the actual and budget revenues and expenses over a pre-determined period of time.

Balance Sheet

Balance Sheet is an effective financial budgetary document that enlists all the assets and liabilities, while evaluating their budgetary values, depreciation rates and amortization records, and the job gets easier when it’s done on an Excel template.

Activity-based Cost Tracker

The activity-based cost tracker template provides you a visual representation of standard, administrative, direct and indirect costs in relation to production. It also helps in monitoring the cost of each unit, while helping you manipulate your budget plan, if other factors, including costs fluctuate.

Small Business Cash Flow Projection

Managing cash flow is more significant than determining profit and loss and balance sheet and by properly using the Excel template small businesses will do well for themselves anytime.

Simple Invoice

In the business circle, an Excel template on invoice gains a lot of accolades. This kind of Excel template automatically calculates the totals and subtotals so that the businesses don’t have to lose any of its valuable time.

cfreeexcelbudget

Beyond the jurisdiction of Microsoft, here are few other budget-related Excel templates:

Year-round IT Budget Template

From the curators of Tech Pro Research team, this cutting edge Excel template helps you track all your spending, administer unplanned expenditure, classify expenses, and highlight key data, like cost of hiring new recruits, contract end dates and recurring payments.


afreeexcelbudget

Systems Downtime Expense Calculator

Taking care of an enterprise network is the most demanding job role for any IT administrator. Nothing in this wide world will be more traumatic than network downtime. Hence, this Excel template assist you place a dollar amount on your network downtime.

Computer Hardware Depreciation Calculator

This Excel worksheet helps you determine depreciation for your equipment – finding the rate of depreciation is not a piece of cake – there are many methods of deprecation to take into account.

Do you want to know more about how to use MS Excel for better budgeting for your business? Advanced Excel course by DexLab Analytics would be perfect for you. Excel certification in Delhi helps you grow in your career, so enroll today!


Interested in a career in Data Analyst?

To learn more about Data Analyst with Advanced excel course – Enrol Now.
To learn more about Data Analyst with R Course – Enrol Now.
To learn more about Big Data Course – Enrol Now.

To learn more about Machine Learning Using Python and Spark – Enrol Now.
To learn more about Data Analyst with SAS Course – Enrol Now.
To learn more about Data Analyst with Apache Spark Course – Enrol Now.
To learn more about Data Analyst with Market Risk Analytics and Modelling Course – Enrol Now.

Microsoft Excel or Google Sheets: Which is better for Business?

Getting all work done from inside a browser through an internet-enable computer is no mean feat. Just after Google cracked the idea, Microsoft and Apple soon followed the bandwagon and developed online office suites of their own.


Microsoft Excel or Google Sheets: Which is better for Business?


So, do you think Google deserves the tag of top dog or should you give accolades to Microsoft for developing a feature-rich office suite?

Continue reading “Microsoft Excel or Google Sheets: Which is better for Business?”

Analyze Data Using These Easy but Effective MS Excel Tricks

Analyze-Data-Using-These-Easy-but-Effective-MS-Excel-Tricks


Everyone adores MS Excel. The powerful Excel software not only excels in doing basic computations but is also used for various formidable purposes, like financial modeling and business strategies. For novices, employing the skills of MS Excel can open new vistas in the world of data analytics. It is even being said – prior to R or Python, better grab the knowledge about Excel. Excel, with its wide array of functions, visualizations and skills empowers the users to quickly generate insights about data from the data, which would take a great toll otherwise.

Top 5 commonly used functions are highlighted below:

  1. Vlookup(): It works great in search of a value in a table and returns the corresponding value. For better understanding, take a look at the Policy Table.

For mapping the city name from the customer tables, based on a regular “customer id”, use function vlookup()

Vlookup_11-850x263

Syntax: =VLOOKUP(Key to lookup, Source_table, column of source table, are you ok with relative match?)


For this problem, we can type formula in cell “F4” as =VLOOKUP(B4, $H$4:$L$15, 5, 0) and this will return the city name for all the Customer id 1 and after that, copy this formula for all Customer ids.

Tip: Do not forget to lock the range of the second table using “$” sign – a common error when copying this formula down. This is known as relative referencing.

  1. CONCATINATE() – When it comes to combine text from two or more cells into a single cell, use CONCATINATE().

Check out the following table:

Concatenate1Here, we want to create a URL structured on input of host name and request path.

Use formula =concatenate(B3,C3) to solve the issue, and copy it.

Tip: Try to use “&” symbol, as it is shorter than typing a full “concatenate” formula, and does the exactly same thing. The formula can be written as “= B3&C3”.

  1. LEN() – It indicates the length of a cell, consisting the number of characters, including special characters and spaces.


Syntax: =Len(Text)


Example: =Len(B3) = 23


  1. TRIM() – This is a very useful function to wipe off text that has leading and trailing white space. When you get a large chunk of data from any database, the text found is usually padded with blanks. To deal with such problems, use this handy function.


Syntax: =Trim(Text)


  1. If() – It allows you to use conditional formulas to calculate when a certain thing holds true and when not. Move your eyes below on the below table to mark each sales as High and Low.Conditional

Undoubtedly MS Excel is one of the most robust programs ever created, and it still remains to be the golden standard for all business outcomes worldwide. Irrespective of whether you are a fresh blood or a veteran user, there is always some scope to learn new things in Excel, which makes it an all-time-favorite software program.  


To follow such interesting blogs on Excel, SAS, Big Data and other branches of Big Data, reach us at DexLab Analytics. We are the prime advanced Excel institute in Gurgaon and expect nothing but the best from us!

 
This post originally appeared onwww.analyticsvidhya.com/blog/2015/11/excel-tips-tricks-data-analysis
 

Interested in a career in Data Analyst?

To learn more about Data Analyst with Advanced excel course – Enrol Now.
To learn more about Data Analyst with R Course – Enrol Now.
To learn more about Big Data Course – Enrol Now.

To learn more about Machine Learning Using Python and Spark – Enrol Now.
To learn more about Data Analyst with SAS Course – Enrol Now.
To learn more about Data Analyst with Apache Spark Course – Enrol Now.
To learn more about Data Analyst with Market Risk Analytics and Modelling Course – Enrol Now.

ANZ uses R programming for Credit Risk Analysis

ANZ uses R programming for Credit Risk Analysis

At the previous month’s “R user group meeting in Melbourne”, they had a theme going; which was “Experiences with using SAS and R in insurance and banking”. In that convention, Hong Ooi from ANZ (Australia and New Zealand Banking Group) spoke on the “experiences in credit risk analysis with R”. He gave a presentation, which has a great story told through slides about implementing R programming for fiscal analyses at a few major banks.

In the slides he made, one can see the following:

How R is used to fit models for mortgage loss at ANZ

A customized model is made to assess the probability of default for individual’s loans with a heavy tailed T distribution for volatility.

One slide goes on to display how the standard lm function for regression is adapted for a non-Gaussian error distribution — one of the many benefits of having the source code available in R.

A comparison in between R and SAS for fitting such non-standard models

Mr. Ooi also notes that SAS does contain various options for modelling variance like for instance, SAS PROC MIXED, PRIC NLIN. However, none of these are as flexible or powerful as R. The main difference as per Ooi, is that R modelling functions return as object as opposed to returning with a mere textual output. This however, can be later modified and manipulated with to adapt to a new modelling situation and generate summaries, predictions and more. An R programmer can do this manipulation.


Read Also: From dreams to reality: a vision to train the youngsters about big data analytics by the young entrepreneurs:


We can use cohort models to aggregate the point estimates for default into an overall risk portfolio as follows:

A comparison in between R and SAS for fitting such non-standard models
Photo Coutesy of revolution-computing.typepad.com

He revealed how ANZ implemented a stress-testing simulation, which made available to business users via an Excel interface:

The primary analysis is done in r programming within 2 minutes usually, in comparison to SAS versions that actually took 4 hours to run, and frequently kept crashing due to lack of disk space. As the data is stored within SAS; SAS code is often used to create the source data…

While an R script can be used to automate the process of writing, the SAS code can do so with much simplicity around the flexible limitations of SAS.


Read Also: Dexlab Analytics' Workshop on Sentiment Analysis of Twitter Data Using R Programming


Comparison between use of R and SAS’s IML language to implement algorithms:

Mr. Ooi’s R programming code has a neat trick of creating a matrix of R list objects, which is fairly difficult to do with IML’s matrix only data structures.

He also discussed some of the challenges one ma face when trying to deploy open-source R in the commercial organizations, like “who should I yell at if things do now work right”.

And lastly he also discussed a collection of typically useful R resources as well.

For people who work in a bank and need help adopting R in the workflow, may make use of this presentation to get some knowledge about the same. And also feel free to get in touch with our in-house experts in R programming at DexLab Analytics, the premiere R programming training institute in India.


Refhttps://www.r-bloggers.com/how-anz-uses-r-for-credit-risk-analysis/


Interested in a career in Data Analyst?

To learn more about Data Analyst with Advanced excel course – Enrol Now.
To learn more about Data Analyst with R Course – Enrol Now.
To learn more about Big Data Course – Enrol Now.

To learn more about Machine Learning Using Python and Spark – Enrol Now.
To learn more about Data Analyst with SAS Course – Enrol Now.
To learn more about Data Analyst with Apache Spark Course – Enrol Now.
To learn more about Data Analyst with Market Risk Analytics and Modelling Course – Enrol Now.

How to Create a Macro With MS Excel

Did you know that with Excel you can now automate tasks by writing so called programs macros. In this tutorial, we will learn how do so, by learning to create a simple macro, which will executable after clicking a command button. To begin you must first turn on the developer tab:

How to Create a Macro With MS Excel

Developer tab:

Do the following steps to turn the developer tab on:


  1. First right click anywhere on the ribbon, and then click on Customize the Ribbon.


Continue reading “How to Create a Macro With MS Excel”

Call us to know more