Artificial Intelligence projects, applications and platforms are being churned out from every corner of the world. A majority of them now possess the ability to break loose lab life and hit mainstream trends, making an appearance in myriad online tools, open source APIs and mass gadgets.
Though the machines are yet to take over our lives, they are filtrating their way into our lives, influencing day-to-day activities, be it work or entertainment. From personal assistants like Alexa and Siri, to self-driving vehicles powered by predictive modeling and more intense and fundamental machine learning technologies, a wide set of applications of AI are in use of late.
Feed yourself with Machine Learning Using Python technology, only from DexLab Analytics.
We perused through a handful number of AI apps so that we can enlist the ones that are more practical and thus really deserving! Let’s leverage piles of data with these effective applications:
Siri
As per Creative Strategies report, 70% of iPhone users have used Siri at least for once or sometimes, but everyone has tried it at least. We are here to tell you don’t hire a personal assistant, instead implement Siri.
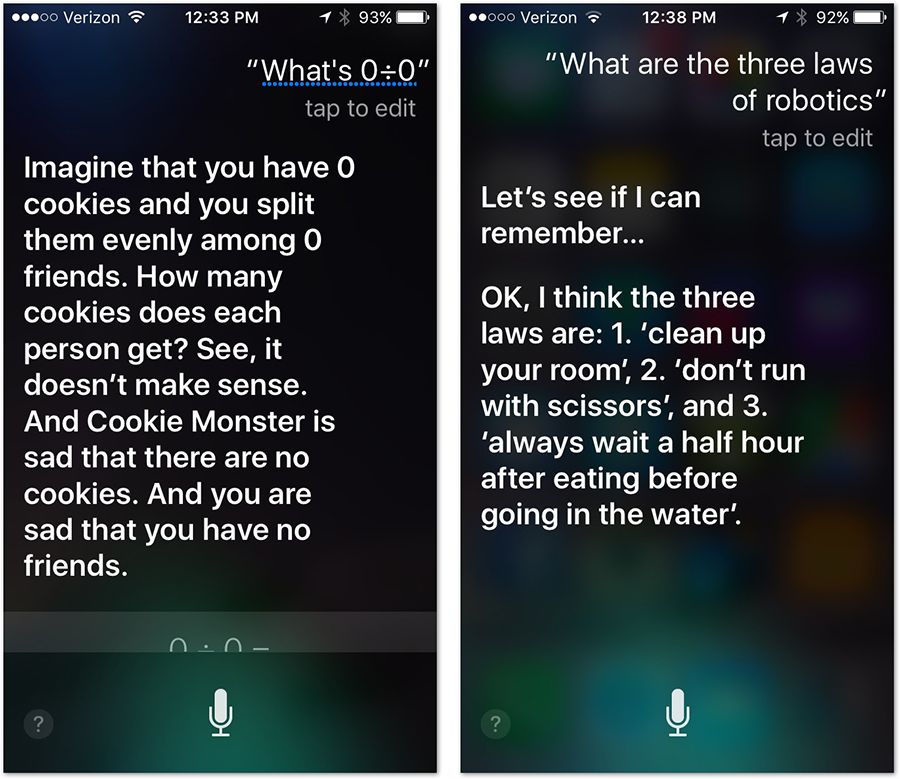
This voice-powered virtual assistant makes business operations smoother and hassle-free, while making your workday more productive. The software is activated by voice, and it is at present available in 20 languages.
Alexa
Developed and powered by Amazon for Amazon Echo intelligent speaker, Alexa, a robust voice service was launched in 2014. It can help you in ordering supplies, translating and controlling office’s vacuum.
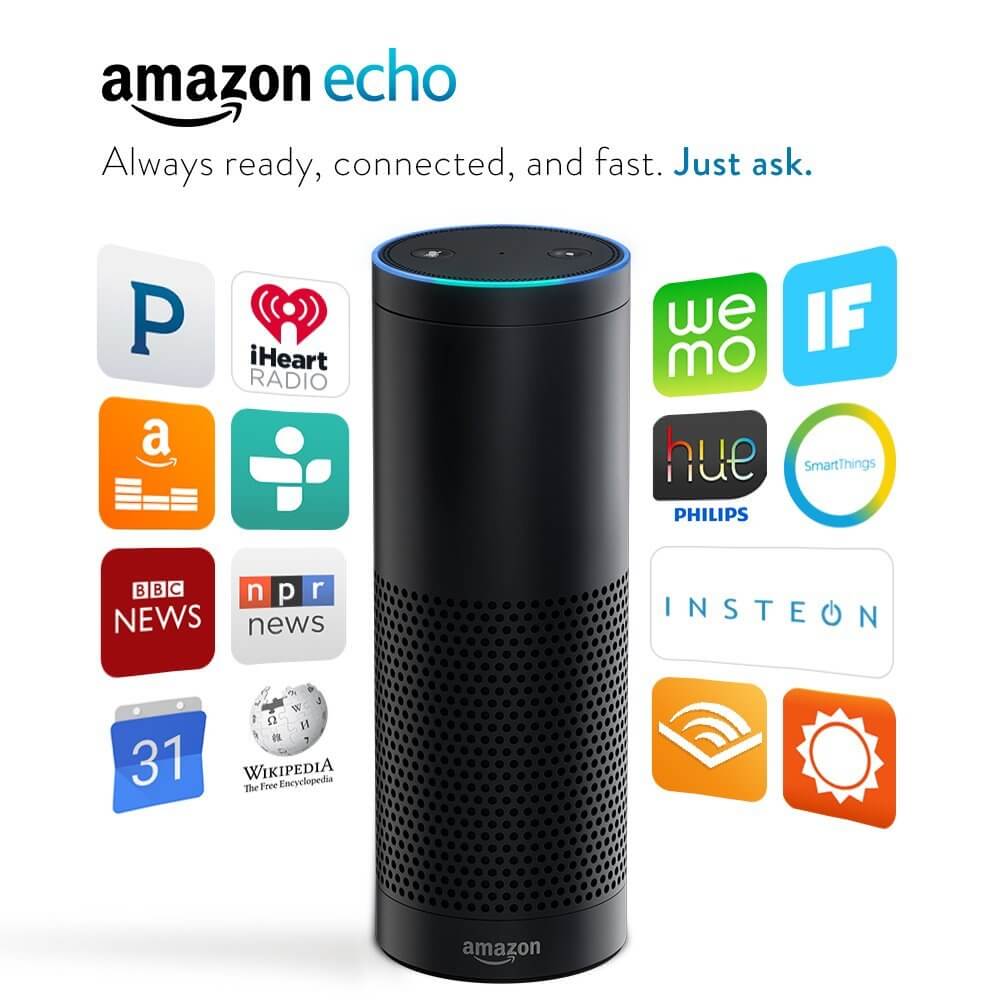
However, connecting your Echo to IFTTT may allow you to coordinate with services that aren’t supported originally by the Echo, while allowing you to integrate multiple actions into a single command to the Echo.
Google Now
This is one of the most popular artificial intelligence applications. Google Now functions by keeping a tab on your calendar, mail, web searches and lot more, along with sending relevant alerts and news on your device as and when detected. It can also carry out tasks, and answer queries, based on voice commands.

The best part of this application is that you don’t have to log in to use it. Just set up alerts that will be sent to the device, and that’s all. At present, it is available in English and is considered a tailing rival of Siri.
Cortana
If you know the exact way to maneuver it, Cortana would be the most effective AI personal assistant. It can perform all sorts of things, right from dictating and sending emails, tracking flights to searching something on the internet or checking weather forecasts. The more time you spent on it, its functionality gets better and better.
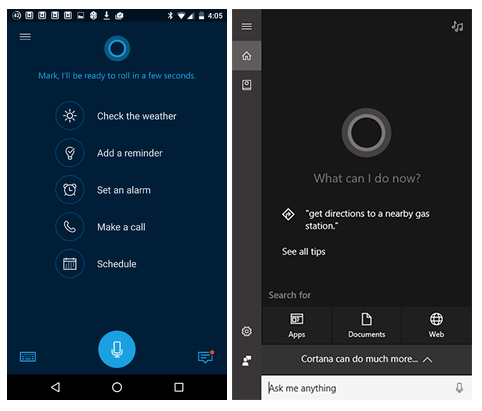
Even, the company is so impressed by its services that it has integrated the service into Power BI, its most intuitive BI tool.
Braina
Brain Artificial, aka Braina is self-regulating software, which enables easy hands-free operation in your computer to perform basic tasks by listening to voice based commands in English language.
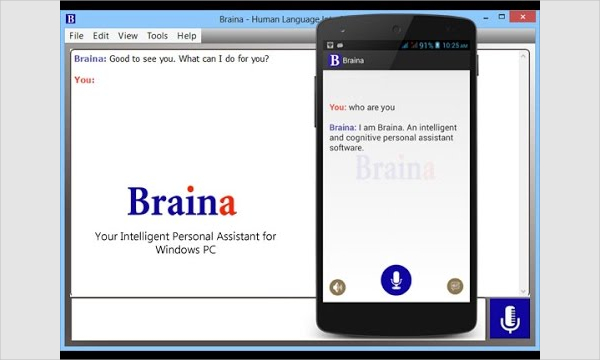
Braina enjoys a certain edger over its run of the mill competitors as it can precisely work with a variety of accents, which is not so common. The pro version is equipped with a bonus of deep learning – it is programmable as well as observes user behavior over time.
Hope, AI applications serves the humanity well!
Check out some more interesting stuff on Machine Learning at DexLab Analytics. We offer world-class machine learning courses in Delhi for all your data aspirations. Come, explore!
Interested in a career in Data Analyst?
To learn more about Data Analyst with Advanced excel course – Enrol Now.
To learn more about Data Analyst with R Course – Enrol Now.
To learn more about Big Data Course – Enrol Now.To learn more about Machine Learning Using Python and Spark – Enrol Now.
To learn more about Data Analyst with SAS Course – Enrol Now.
To learn more about Data Analyst with Apache Spark Course – Enrol Now.
To learn more about Data Analyst with Market Risk Analytics and Modelling Course – Enrol Now.