online courses Archives - Page 3 of 16 - DexLab Analytics | Credit Risk | Market Risk | SAS Python Machine Learning Modeling

10 Amazing Excel Templates to Help Maintain an Organized Budget

10 Amazing Excel Templates to Help Maintain an Organized Budget

Managing a proper budget is an essential task. Professionals working in enterprises are somehow involved in performing this task to some degree. Fortunately, a handful number of budgeting Excel templates is available online – check out some of our favorites:

Back to the basics, budget is something more than an educative, future projection of what should happen to a company’s financial position over a specific course of time, based on the latest trends, current data and previous history. The accuracy of the entire forecast depends on the quality of financial data accumulated during the budget period – it is here that a robust set of data collection tools saves the day.

Here’s a roundup of some of the most useful and easy-to-use budget-related MS Excel templates – most of them are available and are for free. Let’s check them out:

Microsoft Office Templates

When it comes to software, Microsoft remains unbeatable. It offers few applaud-worthy customizable office templates that help you become more productive in implementing programs, perform tasks and track financial budgets. Some of them are below:

Business Expense Report

Business travel expense report is one of the most popular budget reporting activities. For reimbursement of travel expenses, the employee needs to present detailed accounts of expenditures. The Excel template in here is easy to fill up, less time-consuming and removes the frustration caused due to tracking expenses in a business trip.

Project Budget

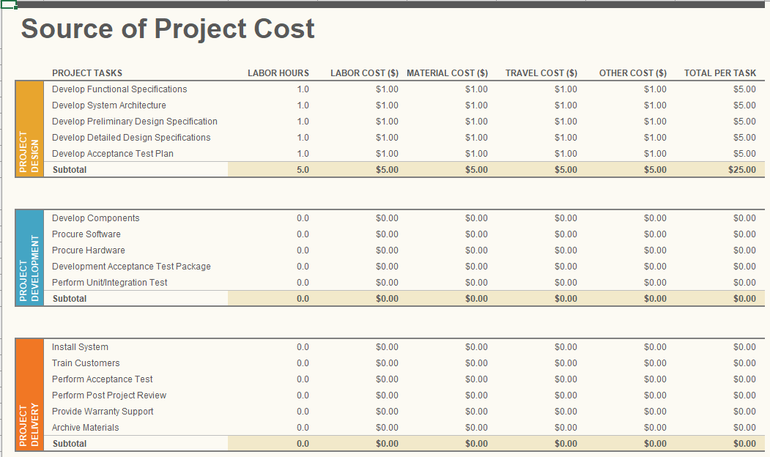
Project Budget template helps you evaluate your project’s design, development and delivery costs so as to monitor actual expenses that occur thereafter.
 

bfreeexcelbudget

Profit and Loss Statement

An all-inclusive profit and loss statement is fundamental for any enterprise. Whether it’s on a departmental level or encompassing an entire organization, determining profit and loss in the financial statement is important to put into focus the problematic areas of your business. The Excel template helps in calculating both the actual and budget revenues and expenses over a pre-determined period of time.

Balance Sheet

Balance Sheet is an effective financial budgetary document that enlists all the assets and liabilities, while evaluating their budgetary values, depreciation rates and amortization records, and the job gets easier when it’s done on an Excel template.

Activity-based Cost Tracker

The activity-based cost tracker template provides you a visual representation of standard, administrative, direct and indirect costs in relation to production. It also helps in monitoring the cost of each unit, while helping you manipulate your budget plan, if other factors, including costs fluctuate.

Small Business Cash Flow Projection

Managing cash flow is more significant than determining profit and loss and balance sheet and by properly using the Excel template small businesses will do well for themselves anytime.

Simple Invoice

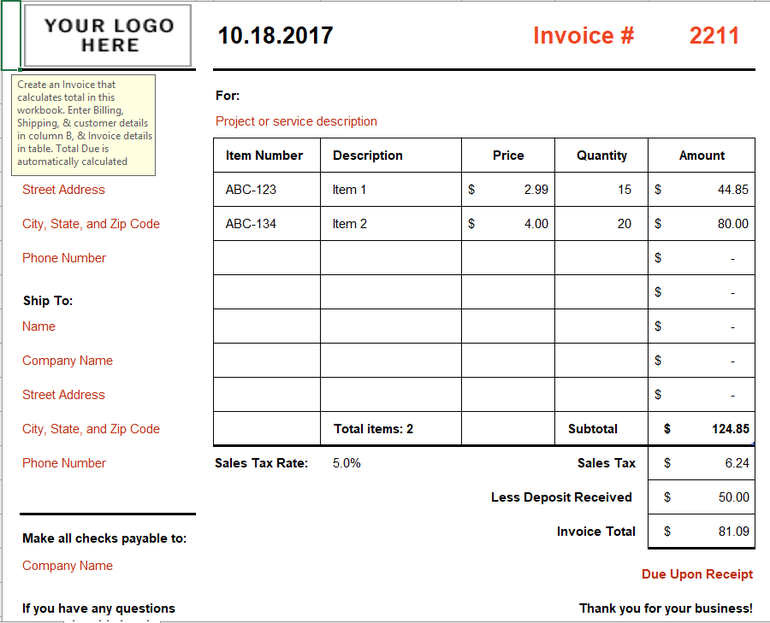
In the business circle, an Excel template on invoice gains a lot of accolades. This kind of Excel template automatically calculates the totals and subtotals so that the businesses don’t have to lose any of its valuable time.
cfreeexcelbudget

Beyond the jurisdiction of Microsoft, here are few other budget-related Excel templates:

Year-round IT Budget Template

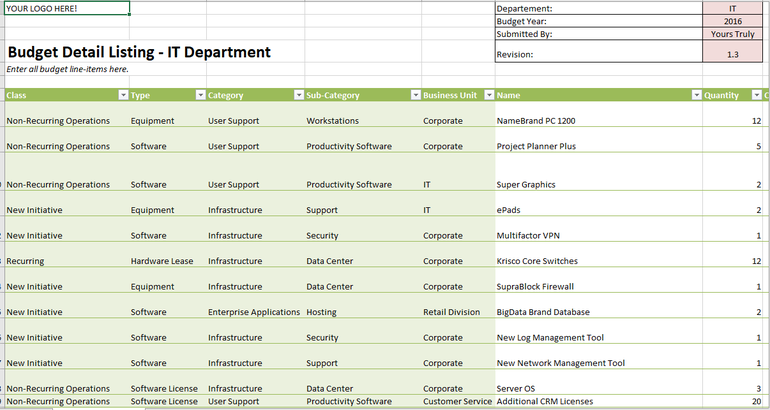
From the curators of Tech Pro Research team, this cutting edge Excel template helps you track all your spending, administer unplanned expenditure, classify expenses, and highlight key data, like cost of hiring new recruits, contract end dates and recurring payments.
 

afreeexcelbudget

Systems Downtime Expense Calculator

Taking care of an enterprise network is the most demanding job role for any IT administrator. Nothing in this wide world will be more traumatic than network downtime. Hence, this Excel template assist you place a dollar amount on your network downtime.

Computer Hardware Depreciation Calculator

This Excel worksheet helps you determine depreciation for your equipment – finding the rate of depreciation is not a piece of cake – there are many methods of deprecation to take into account.

Do you want to know more about how to use MS Excel for better budgeting for your business? Advanced Excel course by DexLab Analytics would be perfect for you. Excel certification in Delhi helps you grow in your career, so enroll today!


Interested in a career in Data Analyst?

To learn more about Data Analyst with Advanced excel course – Enrol Now.
To learn more about Data Analyst with R Course – Enrol Now.
To learn more about Big Data Course – Enrol Now.

To learn more about Machine Learning Using Python and Spark – Enrol Now.
To learn more about Data Analyst with SAS Course – Enrol Now.
To learn more about Data Analyst with Apache Spark Course – Enrol Now.
To learn more about Data Analyst with Market Risk Analytics and Modelling Course – Enrol Now.
The Future of Risk Management: Triggering a Technology Dividend

The Future of Risk Management: Triggering a Technology Dividend

Many factors are constantly shaping and reshaping the structure of risk management today – including global geopolitical inconsistency, macroeconomic headwinds and increasing number of cyber activities – which is extensively damaging and recurring. All this is leading to elevated risk perceptions.

The nature of risks has changed over the years too, as well as the manner of addressing them. Today, to mitigate risk issues, technology plays a crucial role. Headwinds like global and Asian accelerating debt levels, lower projection of productivity growth, increasing levels of policy uncertainty and constant increase of US interest have created a lot of prominent macroeconomic challenges, especially in export-oriented Asian economies. Topping that, budding risks from technological advancements are on the rise, exposing industries to newer challenges like cybersecurity and data fraud.

Explaining the Everlasting Bond between Data and Risk Analytics – @Dexlabanalytics.

As a result, the regulatory scenario of the world is also changing, especially after the global financial crisis. With a wide array of regulations introduced, the issue of risk management has started getting the desired prominence. These increasing regulations have compelled banks to accelerate their compliance activities, while giving increasing pressure on risk-management policymaking. The risk management teams now need to be constantly on a lookout for newer uncertainties – the key to address this concern remains productivity gains, but for that technology needs to be employed to the vast extent.

Cyber Value-at-Risk Model: Quantifying the Value-at-Risk – @Dexlabanalytics.

Hitting a technology dividend

Advanced data analytics, contemporary data and NLP coupled with process digitization offers new robust opportunities for effective market risk management. The technological opportunities can be realized throughout various key functions and levels, but it is the duty of the risk professionals to chalk out a more affordable and fruitful approach to address risk-related issues.

A New Course Alert! DexLab Analytics Launches Market Risk Analytics and Modelling – @Dexlabanalytics.

Check out these 3 principal levers to nab potential opportunities:

Data – Data is the new powerful combat weapon. Financial institutions consist of huge piles of data, where internal and external sources of data continuously pour in at an accelerating rate.  Data, in every form – including transaction, social media, and other sources helps discover real-time customer insights and generate dividends thereafter.

Analytics – Nowadays, machine learning, NLP, advanced analytics and self-learning algorithms are widely available and at achievable prices. The best example to show how advanced analytics is boosting risk management is improving debt collection.

As per conventional debt repayment collection procedure, a lot many calls were asked to make, out of which very few turned out to be successful. But now, with advanced analytics, a set of high-end predictive models are developed to fire up decision-making process. After this, an improved insight about customers can be curated, which can further be developed with better prediction quality.

Processes – With digitization, one gets the opportunity to automate and design risk-monitoring processes to mitigate emerging risks. Nowadays, several financial institutions are implementing machine learning and transaction data to automate monitoring of conduct risk.

Subject to the extent of digitization, the change in factors for risk organization is proposed – in the beginning of digitization, one expects 15-20 percent efficiency gains, while a 60-70% improvement is to be expected in case of a fully digitized risk function, which is quite a show!

Market Risk Analytics: What It is All About – @Dexlabanalytics.

Do you want to know more about market risk modelling techniques? Drop by DexLab Analytics; being a one-stop-destination for Market Risk Modelling using SAS, it boasts of superior training and well-researched study materials.


Interested in a career in Data Analyst?

To learn more about Data Analyst with Advanced excel course – Enrol Now.
To learn more about Data Analyst with R Course – Enrol Now.
To learn more about Big Data Course – Enrol Now.

To learn more about Machine Learning Using Python and Spark – Enrol Now.
To learn more about Data Analyst with SAS Course – Enrol Now.
To learn more about Data Analyst with Apache Spark Course – Enrol Now.
To learn more about Data Analyst with Market Risk Analytics and Modelling Course – Enrol Now.
Cyber Value-at-Risk Model: Quantifying the Value-at-Risk

Cyber Value-at-Risk Model: Quantifying the Value-at-Risk

Cybersecurity attacks are the new potent threat to businesses. Diligent professionals and big mouth board members have started reviewing their company’s cybersecurity frameworks, while establishing better security controls and discerning deeper insights about the business impact of cybersecurity attacks: what kind of risks are they exposed to? Are they expending too much and need to curtail down? What amount of risk can be reduced using the proposed info security budget? Cyber-insurance, will it fetch better results?

What objectives to secure with Cyber value-at-risk models?

This is the epic question that has triggered the development of Value-at-risk models, especially in the domain of information security. Also known as Cyber VaR, these models are a game-changer. They offer a sound base for quantification of information risk coupled with infusing discipline into the whole process.

Market Risk Analytics: What It is All About – @Dexlabanalytics.

The objective of VaR is:

  • To help risk professionals formulate the notion of cyber risk in plain financial language without using any technical jargons.
  • To enable business professionals achieve a standard balance between safeguarding an organization and running the business by making cost-effective decisions.

Enterprises powered by VaR models for cybersecurity make complicated decision-making as easy as pie. They trigger risk-related discussions, where risks become more consistent, and business-goal driven.

A New Course Alert! DexLab Analytics Launches Market Risk Analytics and Modelling – @Dexlabanalytics.

What exactly is cyber VaR?

In the world of finance, value-at-risk modeling is the statistical methodology to appraise the level of financial risk that a firm is exposed to over a specific period of time.

The VaR is ascertained using these three variables:

  • The amount of conjectured loss
  • The probability of that amount of loss
  • The time frame

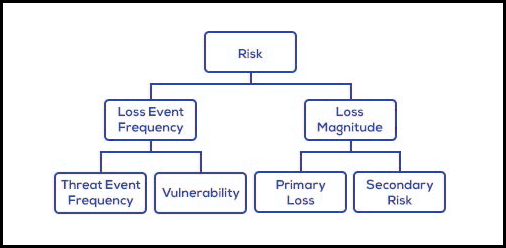
Probabilities are effective to evaluate likely losses from the cyber attacks during a specific time period. Top notch global organizations, like World Economic Forum and several regulatory bodies, like The Open Group are revolutionizing the concept of cyber VaR models.

fi1-2

What is its benefit?

VaR was initially developed in 1990’s to boost the investment banking sector, wherein managers were to identify the risks that popped up daily in multiple market reports. From the name itself, you can understand, it is more likely a measurement tool to analyze the financial impact of risky events within a particular time frame.

The most beneficial effect of VaR is that it not only quantifies risk but also pens it down in economic terms that are easily understood by all. It also assists in mitigating long-term challenges by aggregating cyberrisk with various other operational risks within an enterprise risk management system.

Here’s All You Need to Know about DexLab Analytics’ Market Risk Modelling Live Demo Session – @Dexlabanalytics.

How to determine the value of cyber VaR?

 CISOs, Chief information security officers decipher what exactly VaR offers in terms of cyberrisk management. This hi-tech concept is too good to help with crucial decision-making, like addressing cyberrisk appetite and defining the optimal allocation of cyber risk management resources.

Market risk analytics is a new concept in the make. Many organizations have realized its crucial importance, while many are yet to decipher. For the best enterprise risk management certification, drop by DexLab Analytics. They are a leading economic capital model training institute offering state-of-the-art courses to the candidates.


Interested in a career in Data Analyst?

To learn more about Data Analyst with Advanced excel course – Enrol Now.
To learn more about Data Analyst with R Course – Enrol Now.
To learn more about Big Data Course – Enrol Now.

To learn more about Machine Learning Using Python and Spark – Enrol Now.
To learn more about Data Analyst with SAS Course – Enrol Now.
To learn more about Data Analyst with Apache Spark Course – Enrol Now.
To learn more about Data Analyst with Market Risk Analytics and Modelling Course – Enrol Now.
Incredible Tech Transformation: How Machine Learning is changing the Scope of Business

Incredible Tech Transformation: How Machine Learning is changing the Scope of Business

Machine Learning coupled with data analytics is modifying the norms of how business handles crucial data. Insights into ML and AI is already reaping benefits in transforming vast pools of data – curated by dexterous data pundits into meaningful, relevant analytic results that would have escaped clumsy human analysis, previously.

Today, the combat weapon of Machine Learning has started to influence the entire business world. While many organizations have grasped the bounties of this hi-tech tool of learning, few are left to fathom how it would affect the way they do business. The automation process is a completely data-driven task – ideal to change enterprises into vendors – by turning lessons learnt into advanced algorithm programs worthy of licensing to software and service providers for good money.

2

Nevertheless, a lot of all that depends on how machine learning is going to evolve in the coming five to ten years and what implications it would bring into the hiring or recruitment strategies in the long run. And the best area to start off this discussion is unsupervised machine learning, where intricate frameworks are allotted large datasets and asked to draw patterns without human help to figure out what the software needs. With minimum human interference, the scalability of this mode of ML is the highest.

How to Assess Clustering Tendency: Unsupervised Machine Learning – @Dexlabanalytics.

Supervised or Unsupervised? Which is better?

Supervised ML needs human help to develop large sets of training data and corroborate the results of the training. Speech Recognition is the perfect example of such ML. But it is challenging to procure and classify vast data for supervised training. As a result, unsupervised ML is the key to the future – it reduces such interaction to a large extent. The minimum involvement of human beings suffices to be a boon – but take a note, a data scientist is required to select the data that is to be evaluated.

Unsupervised learning also needs a human touch to assign values to data structures and clusters. Hence, we cannot say for sure they are totally human-error free. Instead, we should focus more to ace up the performance of humans in tackling data for own interests.

In this context, “I think, right now, that people are jumping to automation when they should be focused on augmenting their existing decision process,” says David Dittman, director of business intelligence and analytics services at Procter & Gamble. “Five years from now, we’ll have the proper data assets and then you’ll want more automation and less augmentation. But not yet. Today, there is a lack of usable data for machine learning. It’s not granular enough, not broad enough.”

The Math Behind Machine Learning: How it Works – @Dexlabanalytics.

How to become a vendor from a consumer

A portion of what drives an incessant demand for data scientists is the pressing need for data to turn ML more productive. Mike Gualtieri, Forrester Research’s vice president and principal analyst for advanced analytics and machine learning thinks that some organizations, exactly five years from now might turn into vendors -“Boeing may decide to be that provider of domain-specific machine learning and sell [those modules] to suppliers who could then become customers,” he says. Like him, Dittman also sees the thriving combination of Data and ML code as being a highly sellable product, more so a potent new source of revenue for organizations – “Companies are going to start monetizing their data,” he explains. “The data industry is going to explode. Data is absolutely exploding, but there is a lack of a data strategy. Getting the right data that you need for your business case, that tends to be the challenge.”

Irrespective of what the future holds, technology is grooming to become an extravagant revolving door of striking innovation, and the only way to nab this technology is by making ourselves technology-friendly. For excellent business analytics course in Delhi, DexLab Analytics provides the perfect platform to deliver student-friendly education on data analytics at affordable prices. Dig into our data analyst course by clicking on our homepage.


Interested in a career in Data Analyst?

To learn more about Data Analyst with Advanced excel course – Enrol Now.
To learn more about Data Analyst with R Course – Enrol Now.
To learn more about Big Data Course – Enrol Now.

To learn more about Machine Learning Using Python and Spark – Enrol Now.
To learn more about Data Analyst with SAS Course – Enrol Now.
To learn more about Data Analyst with Apache Spark Course – Enrol Now.
To learn more about Data Analyst with Market Risk Analytics and Modelling Course – Enrol Now.

Discover the Best Industries to Have a Career in Data Science

Discover-the-Best-Industries-to-Have-a-Career-in-Data-Science

Data fires up everything, nowadays. And data science is gaining exceptional traction in the job world, as data analytics, machine learning, big data, and data mining are fetching relevance in the mainstream tech world. By 2025, it is being expected that data science industry will reach $16 billion in value – this is why landing a job in data science domain is the next big thing!

The skills you will imbibe as a data scientist would be incredible, powerful and extremely valuable. You can easily a bag a dream job in corporate moguls, like Coca-Cola, Uber, Ford Motors and IBM, as well as play a significant role in any pro-social or philanthropic endeavors to make this world a better place to live in.

Check out these extremely interesting fields you could start your career in data science:

Biotechnology

No wonder, science and medicine are intricately related to each other. As the technology pushes boundaries, more and more companies are recommitting themselves towards a better public health by nabbing biotechnology. Being a data scientist, you would help in unraveling newer ways of studying large amounts of data – including machine learning, semantic and interactive technologies. Eventually, they would influence treatments, drugs-usage, testing procedures and much more.

Untitled

Energy

Power industry functions on data – and tons of it. Whether it’s about extracting mineral wealth from the earth’s crust or transporting crude oil or planning better storage facilities, the demand for data scientists is on the rise. Just as expanding oil fields ask for humongous amounts of data study, installing and refining cleaner energy production facilities relies on data about the natural environment and ways of modern construction. Data scientists are often given a ring to enhance safety standards and help companies recommit themselves towards better safety and environmental regulations.

Transportation

Recently, transportation is undergoing a robust change. For example, Tesla paved a new road of development and turned countless heads by unveiling a long-haul truck that could drive on its own. Though it’s not the first time, they are prone to lead the change.

Beyond self-driving vehicle technology, the transportation industry is looking for more efficient ways to preserve and transport energy. These advancements in technology works wonders when combined with better battery technology development – in simple terms, every individual field in transportation industry is believed to benefit from a motley team of data scientists.

jpg

Telecommunications

The internet is not only about tubes, but all about data. The future of the internet is here, with ever-increasing networks of satellites and user devices establishing communication through blockchain. Though they are yet to be used on large-scale, they have started making news. In situations like this, it would be difficult not to highlight the importance of data science and data architecture as they are becoming major influencers in the internet world. Whenever there is a dire need to make the public aware of a new product, we rely on user data – hence the role of data scientists is the key to a better future.

Today, data science is an interesting field to explore, and it is going to play an integral role as the stride in technology and globalization keeps expanding its base. If you have a keen eye for numbers, charts, patterns and analytics, this niche is perfectly suitable for you.

DexLab Analytics is a prime Data Science training institute Delhi that excels in offering advanced business analyst training courses in Gurgaon. Visit our official site for more information and make a mark in data analytics!


Interested in a career in Data Analyst?

To learn more about Data Analyst with Advanced excel course – Enrol Now.
To learn more about Data Analyst with R Course – Enrol Now.
To learn more about Big Data Course – Enrol Now.

To learn more about Machine Learning Using Python and Spark – Enrol Now.
To learn more about Data Analyst with SAS Course – Enrol Now.
To learn more about Data Analyst with Apache Spark Course – Enrol Now.
To learn more about Data Analyst with Market Risk Analytics and Modelling Course – Enrol Now.
Microsoft Excel or Google Sheets: Which is better for Business?

Getting all work done from inside a browser through an internet-enable computer is no mean feat. Just after Google cracked the idea, Microsoft and Apple soon followed the bandwagon and developed online office suites of their own.


Microsoft Excel or Google Sheets: Which is better for Business?


So, do you think Google deserves the tag of top dog or should you give accolades to Microsoft for developing a feature-rich office suite?

Continue reading “Microsoft Excel or Google Sheets: Which is better for Business?”

How to create Chart Templates with R Functions

R functions are used to produce chart templates to keep the look and feel of the reports intact.

 
How to create Chart Templates with R Functions
 

In this post you will come across how to create chart templates with R functions – all the R users should be accustomed to the calling functions so as to perform calculations and outline plots accurately. Remember what colors and fonts to use each time: R functions are used as a short-cut for producing customary-looking charts.

Continue reading “How to create Chart Templates with R Functions”

Text Adventure – Using Control Flow In Python

Python wascreated by Guido van Rossum and first released in 1991.Python, as a programming platform, has gained a huge popularity within a short span of time because of its flexibility and the user-friendly interface. The software can be deployed easily for developing statistical models and machine learning algorithms

 
Text Adventure- Using Control Flow In Python
 

In fact, due to the advent of AI and ML, Python has a language has had a certain kind of rebirth as far as industrial use is concerned. Today, however, the focus is going to be on a particular section of the language, namely the control flow to create a basic system in Python.

Continue reading “Text Adventure – Using Control Flow In Python”

5 Popular Uses of MS Excel for Better Business Growth

Microsoft Excel is one of the most significant computer software program making rounds in today’s workplace environment. More and more employees are being asked to hone their Excel skills in order to survive in the highly competitive market.


5 Popular Uses of MS Excel for Better Business Growth


From the employer’s viewpoint, especially those who are associated with IT, the use of Excel is gaining prominence and for all the right reasons. Not only it is being used by business professionals to carry out daily functional tasks but also a large chunk of experts rely on it for decision support.

Continue reading “5 Popular Uses of MS Excel for Better Business Growth”

Call us to know more