online courses Archives - Page 15 of 16 - DexLab Analytics | Credit Risk | Market Risk | SAS Python Machine Learning Modeling

Tutorial for creating a Speedometer dial in MS Excel

 Tutorial for creating a Speedometer dial in MS Excel

Here in this video tutorial we have discussed in detailed steps, how to create a Speedometer chart in MS Excel. A Speedometer chart is often called as a gauge chart and combines two different type of charts, a pie chart and a doughnut chart.

The Speedometer dial is made with the help of using a Doughnut chart and needle is actually a combination of two types of charts, another doughnut chart and a pie chart.

A speedometer chart or a gauge chart can be created in other data visualization software as well, like for instance in Tableau and is usually easier to create due to availability of better controls and features.  It is due to the simplistic nature of these charts which is well adjusted to context of data and is a great use of space in a spreadsheet that charts like these are popular with non-data executives. Usually such non-data personnel do not want to dig deep into the contextual details like an analyst which is why these charts are great for using in a presentation where diverse departmental executives will be participating.

Gauge charts pack in a lot of horsepower and form a sort of ubiquitous symbol when it comes to understanding business metrics from an analytical point of view. So, learn to create these charts with our simple tutorial and for more such interesting lessons on data analysis software, join us every day as we share technical posts based on data on a regular basis.


Interested in a career in Data Analyst?

To learn more about Data Analyst with Advanced excel course – Enrol Now.
To learn more about Data Analyst with R Course – Enrol Now.
To learn more about Big Data Course – Enrol Now.

To learn more about Machine Learning Using Python and Spark – Enrol Now.
To learn more about Data Analyst with SAS Course – Enrol Now.
To learn more about Data Analyst with Apache Spark Course – Enrol Now.
To learn more about Data Analyst with Market Risk Analytics and Modelling Course – Enrol Now.

We Analyzed The Statistics Of Game Of Thrones

Are you a data science enthusiast as well as a fan of Game of Thrones? Then this blog is where you should stick your eyes to and fear not as we will not give you any spoilers.


We Analyzed The Statistics Of Game Of Thrones


Of the zillion of characters in the show, ever imagined which is the main character the show is leading with? Amidst the characters like Tyrion, Bran, Dany and pals who is the main one in the Game of Thrones? Continue reading “We Analyzed The Statistics Of Game Of Thrones”

Most Commonly Asked Tableau Interview Questions

Most Commonly Asked Tableau Interview Questions

In the near future, the world’s data generation will nearly double in amount than what it is now. According to a survey conducted by the IDC (International Data Corporation) by 2020 we will generate 50 times more data than in 2011. Now that such a gargantuan amount of data will be generated which will come with real-world business implications, thus, businesses around the world will require tools which should be capable to analyze this data and gather actionable insights from them. Tableau is a tool that helps organizations do exactly that, i.e. data mining and visualizing business opportunities to take requisite actions for amplifying revenue generation. So, it is understandable that the demand for personnel proficient in Tableau is expected to rise by manifolds in the next few years.

So, we India’s leading Tableau training institute have compiled a list of the most commonly asked interview questions for a position of Tableau operator/executive in this post. If you have more such questions that you have recently come across in an interview and would like to know the answer feel free to drop them in the comments below and our data science training faculty will get to them ASAP. And if you would like to take up a Tableau Certification course or take up an online Tableau training check out our curriculum on Tableau BI Certification.

2

Common interview questions on Tableau:

  • Do you know the difference between Live Data and Extract Data in Tableau?

The best answer to this question: An ‘extract’ connection is a connection with a static database, which is refreshed every day/hour/period. In this case all data are copied from the data source to the Tableau Server. Refreshing the data source will not give you the latest data – you have to refresh the extract to get them.

A live connection will query the underlying data in the data source/database – refreshing the visualization will give you the latest results. In this case no data is copied to Tableau Server for pre-processing.

• Name a few of the different types of filters used in tableau.

The best answer to this question:

The 3 types of Filters in Tableau are:
1) Quick Filter
2) Data Source Filter
3) Context Filter

  • Can you tell me the difference between parameters and filters in Tableau?

The best answer to this question: The difference actually lies in the application. Parameters allow users to insert their values these can be float, integers, string, date that can be used in calculations. However, filters receive only values users choose to ‘filter by’ the list this cannot be used to perform calculations.

Users can dynamically change measures and dimensions in parameter but filters do not support of this feature.

  • How will you view underlying SQL Queries in Tableau?

The best answer to this question: Viewing underlying SQL Queries in Tableau can be done in two ways:

• Create a Performance Recording, to register performance information about the main events you interact with workbook. Users can view the performance metrics in a workbook created by Tableau.

Help> Settings and Performance> Start Performance Recording
Help> Setting and Performance > Stop Performance Recording

• Reviewing the Tableau Desktop Logs located at C:\Users\\My Documents\My Tableau Repository. For live connection to data source, you can check log.txt and tabprotosrv.txt files. For an extract, check tdeserver.txt file.

  • Do you know the difference between .(dot) twb and .(dot) twbx?

The best answer to this question: The .(dot) twb is the most common file extension used in Tableau, which presents an XML format file and comprises all the data present in each dashboard and sheet like what fields are used in the views, styles and formatting that are applied to a sheet and dashboard.

But this workbook does not contain any data. The Packaged Workbook merges the data in a Tableau workbook with the local data available (which is not on server). A. (dot) twbx serves as a zip file this includes custom images if any. Packaged Workbook allows users to share their workbook information with other Tableau Desktop users and let them open it in Tableau Reader.

  • How many maximum tables can you join in Tableau?

The best answer to this question: A maximum number of 32 tables can be joined in Tableau. A table size must also be limited to 255 columns (fields).

Here were the answers to the most commonly asked Tableau interview questions, for more such interesting data analytics news, job updates and discussions follow our daily uploads from DexLab Analytics. We have recently launched our new branch in Pune, so, now Maharashtrians can also get their data analytics certification from DexLab Analytics, we add values to dull data!

Best of luck for your Tableau interview!


Interested in a career in Data Analyst?

To learn more about Data Analyst with Advanced excel course – Enrol Now.
To learn more about Data Analyst with R Course – Enrol Now.
To learn more about Big Data Course – Enrol Now.

To learn more about Machine Learning Using Python and Spark – Enrol Now.
To learn more about Data Analyst with SAS Course – Enrol Now.
To learn more about Data Analyst with Apache Spark Course – Enrol Now.
To learn more about Data Analyst with Market Risk Analytics and Modelling Course – Enrol Now.
The First Sci-Fi Movie Written By An Algorithm!

If you thought algorithms were these boring formulas that have no point, then it is time for you to rethink. Algorithms these days are replacing the need for human intellect altogether (do you smell a hint of irony in there?). As much as this may sound totally unbelievable but it is in fact the truth. The first ever short film has been made that is completely written by an algorithm, and is finally out and it is pretty great. Although the convoluted dialogues of the screenplay needs a few mental gymnastics to be performed by the audience’s brains, but then again isn’t that the best thing about sci-fi movies after all?


The First Sci-Fi Movie Written By An Algorithm!


The story behind this amazing film starts with an aspiring film-maker Oscar Sharp, named appropriately for the movie-making world (Again irony… Get it? Oscar… movies?!). This young screenplay writer wanted to submit a plot for Sci-Fi London’s 48 Hour Film Challenge. So, to create the next big hit in the world of Sci-Fi short films he read all the screenplays he could find, of the best sci-fi movies on the internet. Then the right inspiration struck him and he came up with the idea to feed all these movie plots into an algorithm, starting from movies like Ghostbusters to The X-Flies and movies like Interstellar, The Fifth Element and many more and let the algorithm work up on a script on its own. Ingenious you say or was it a complete idiocy?  Only to be discovered later that it was a great idea only with the right algorithm. Continue reading “The First Sci-Fi Movie Written By An Algorithm!”

The Most Interesting Scientific Fact About Numbers a Data Scientist can Know

Are you a non-data person? Do you think numbers are unnecessarily complex and are better to stay away from? When asked to calculations do you feel a little of sleepiness setting in? Then this would come as a surprise to you that our brains originally think in numbers. To be more precise, our brains actually think in the Logarithm Scale instead of thinking in the additive scale. To put it simply our brains understand better in terms of proportions than in differences.


The most interesting scientific fact about numbers a data scientist can know


So, how would our brains approach differences in numbers? We think almost automatically that the difference between 1 and 2 is greater than the difference between 3 and 2 and so forth.

Continue reading “The Most Interesting Scientific Fact About Numbers a Data Scientist can Know”

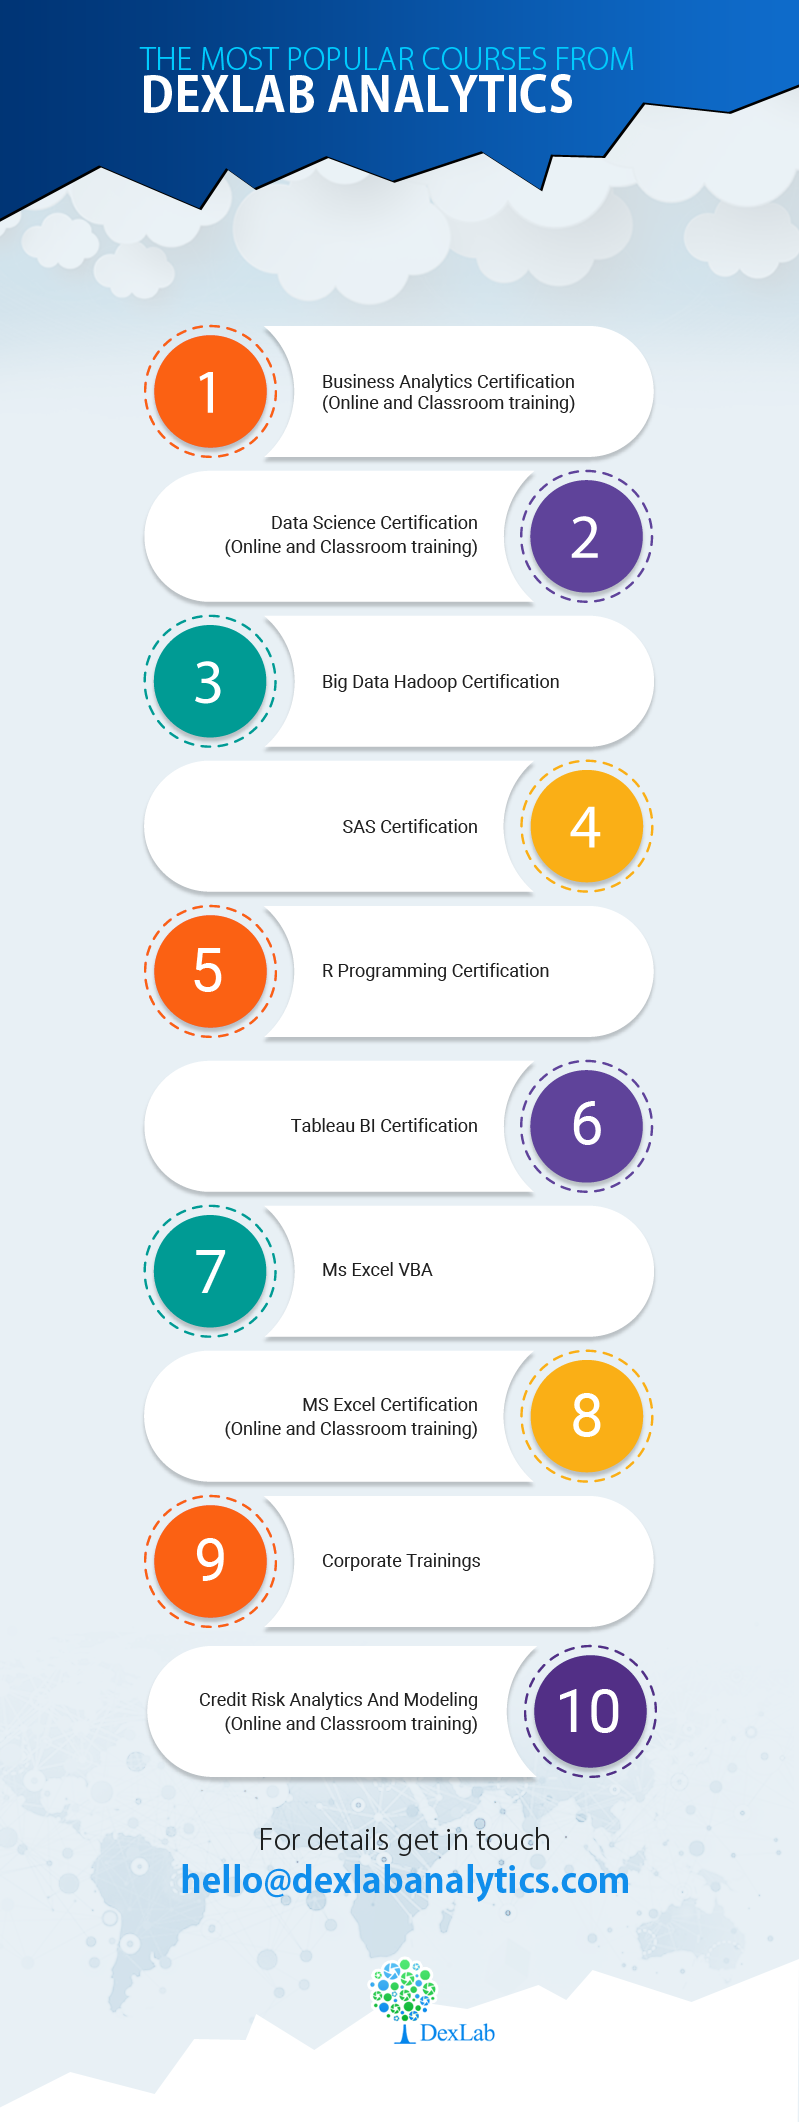
Infographic: List of Our Courses from Dexlab Analytics

infographic6


View our infographic on the list of most in-demand courses among data enthusiasts who want to advance their careers with the top trends in the job market. Come to DexLab Analytics and launch your career in light speed with the requisite skills to harness the power of data.


Our Courses: MS Excel, Data Science, Business Analytics

Are You a Student of Statistics? – You must know these 3 things

Are you a student of statistics?

We a premiere statistical and data analysis training institute offering courses on Big Data Hadoop, Business intelligence and Ai. We asked our faculty to tell us the three most important things that every student of elementary statistics should know.

So, let us get on with it:

  1. The notion that statistics is about numbers, is in the context only: statistics involves a rich treasure trove of numeric and graphical representation of displaying data to quantify them also it is very important to be capable of generating graphs along with numbers. But that is not the half part of statistics and the main interesting aspect is related to making the big leap from numbers and graphs to the realistic worldly interpretations. Uncannily statistics also poses to be a fascinating philosophical tension raising the question and healthy skepticism about we believe in and what we do not.
  2. The analysis part is not the most crucial part of a statistical study, the most important part lies with the when, where and how of gathering the data. We must not forget when we enter each number or data, calculate and plot the strategies we build on our understanding, but many a times at the time of interpretation that each every graph, data or number is a product of a fallible machine, be it organic or mechanical. If we are able to take proper care at the stage of sampling and observation we will be able to obtain great dividends at the final stage of interpretation and analysis of all our statistical efforts.
  3. All statistical functions off all kinds of mathematical sciences are based on a two-way communication system. This communication system should be between the statistician and non-statistician end. The main aim of statistical analysis is to put forward important social, public and scientific questions. A good statistician knows how to communicate with the public especially with those who are by and large not statisticians. Also the public here plays an important role and must possess simple idea of statistical conclusions to grasp what the statisticians have to say to them. This is an important criterion to be incorporated in the K-12 and college curriculum for elementary statistical students.

Data Science Machine Learning Certification

If you agree with our views and would like to discuss further on statistics and its application on data analysis then feel free drop by DexLab Analytics and stay updated on the latest trends in data management and mining.


Interested in a career in Data Analyst?

To learn more about Data Analyst with Advanced excel course – Enrol Now.
To learn more about Data Analyst with R Course – Enrol Now.
To learn more about Big Data Course – Enrol Now.

To learn more about Machine Learning Using Python and Spark – Enrol Now.
To learn more about Data Analyst with SAS Course – Enrol Now.
To learn more about Data Analyst with Apache Spark Course – Enrol Now.
To learn more about Data Analyst with Market Risk Analytics and Modelling Course – Enrol Now.
5 Online Sources to Get Basic Hadoop Introduction

Basic Hadoop Courses

Big data Hadoop courses are hitting it big in the world of business whether it is healthcare, manufacturing, media or marketing. Data is generated everywhere, and Hadoop is a readily available open source Apache software program that can be utilized to crunch and store Big Data sets.

As per reports from the Transparency Market Research the forecast shows a promising growth opportunity from the existing USD 1.5 million back in 2012 to USD 20.8 million within 2018. These promising growth numbers suggest that there will be an increased need for human resources to manage, develop and oversee all the Hadoop implementations.

#BigDataIngestion: DexLab Analytics Offers Exclusive 10% Discount for Students This Summer

DexLab Analytics Presents #BigDataIngestion

Many experts believe that one can learn any new subject by simple self-study if only you invest enough time and sincere predisposition towards a topic. After all self-study is actually what a person does to acquire knowledge about any given topic. Be it how to fix a leaky faucet or learn a new language or learn strum a guitar. Studying is on one’s own in any case. But to be an expert in a given field, you have to study on your own while you also need to invest your energy in the right direction. And to know the right direction, you need a mentor or a guide to lead the way.

But if you want to test the waters, and tinker with Hadoop to understand its basics, you can go through the wide range of documents available at the Apache Hadoop website for your perusal. Also try downloading the Hadoop open source release to get the feel of the program while tinkering with different features.

Here are 5 online sources where you can seek some basic introduction to Hadoop for big data:

  1. IBM’s open sources, Hadoop Big Data for the Impatient is a good option to go through the basics of Hadoop. It also offers a free download of Hadoop image (you might need Cloudera) to help you work with examples of Hadoop-based problems. You will also be able to get an idea of Hive, Oozie, Pig and Sqoop. The course is available in Vietnamese, Chinese, Spanish and Portuguese.
  2. Cloudera offers a Cloudera essentials course for Apache Hadoop. Apache Hadoop chapter wise video tutorials are available with Cloudera essentials. But this course is mainly targeted at administrators and those who are well-acquainted with data science, to update their skills on the subject.
  3. YouTube also offers a long list of videos on Hadoop topics for beginners. Some are good while others may not be so helpful for the Hadoop virgins. Simply type Hadoop and you will find a never-ending list of videos related to Hadoop. Some are quite useful for clarifying simple doubts related to Hadoop.
  4. Udemy is another site where you can get some free videos as well as a few for a fee. Simply put Hadoop free on the search bar at their homepage and see what comes up.
  5. Udacity was developed by Silicon Valley giants like FaceBook, Cadence, Twitter and the likes. They offer a 14-day free trial with free course materials. But you will need to pay for the course if you do not finish the course within 14 days.


Seeking a good and reliable Hadoop training in Delhi? When DexLab Analytics is here, why look further! Being a recognized Big Data Hadoop institute in Gurgaon, the courses are truly interesting.


Interested in a career in Data Analyst?

To learn more about Machine Learning Using Python and Spark – click here.
To learn more about Data Analyst with Advanced excel course – click here.
To learn more about Data Analyst with SAS Course – click here.
To learn more about Data Analyst with R Course – click here.
To learn more about Big Data Course – click here.

Elementary Character Functions in SAS

Basically the number of functions present in the SAS program amount to three. They are Character Functions, Numeric Functions and Date and Time Functions. In this post we are going to take a brief look at Character functions of a basic nature.


Elementary Character Function  in SAS


Character Functions

Suppose that there is this program with the following lines of command:

Data Len_func ; input name $ ; cards; Sandeep Baljeet
Neeta
.
;
run;
data Len_func; set Len_func ; Len=length(name);
Len_N=lengthn(name); Len_C=lengthc(name); run;
proc print; run;

Here,

  • The function called LENGTH returns the character value’s length.
  • The function LENGTHN is more or less identical to the LENGTH function. The sole difference between the two lies in the fact that for a value missing character it returns the length that equals to 0 whereas LENGTH returns a value of 1.
  • The function LENGTHC returns to the program the storage length of particular strings.


The ABC of Summary Statistics and T Tests in SAS – @Dexlabanalytics.


Again let us consider the following lines of code:

Data case ; input name $ ;cards;
sandeep baljeet neeta
;
New_U=upcase(name); New_P=propcase(name); 
run;
proc print; run;


Data Preparation using SAS – @Dexlabanalytics.


Here the following functions are introduced:

  • The function UPCASE converts all of the letters to the uppercase.
  • The function PROPCASE serves to capitalize the first letter of all words and converts the remaining to lowercase.
  • As might be guess from the convention conformed to while naming the function, LOWCASE transforms all letters to their lowercase counterparts.


In the following program commands:

Data AMOUNTS; input NAME $20.; cards;
RAD-HIKA SHARMA RAJARAM PAND-IT SURESH
AA-RT-I
;
RUN;
Data AMOUNTS;
Set AMOUNTS; NAME1=COMPRESS(NAME,'-'); NAME2=COMPBL(NAME);
RUN;
PROC PRINT;
RUN;


Here’s why SAS Analytics Is a Must-Have IT Skill to Possess – @Dexlabanalytics.


Here we can see the following syntax:

  1. Compress (Variable, ”want to remove”);
  2. Compbl (Variable)
  • The function COMPRESS removes blanks by default. It can also remove a particular specified character value as indicated by the code. In the example cited the character value ‘-‘is compressed.
  • On the other hand the COMPBL function serves to result in a single blank from multiple ones.


For expert guidance, you will be well advised to enroll yourself in a SAS course from a reputed SAS Training institute. You may consider DexLab Analytics if you are in the vicinity of Delhi or noida.


Interested in a career in Data Analyst?

To learn more about Machine Learning Using Python and Spark – click here.
To learn more about Data Analyst with Advanced excel course – click here.
To learn more about Data Analyst with SAS Course – click here.
To learn more about Data Analyst with R Course – click here.
To learn more about Big Data Course – click here.

Call us to know more