online courses Archives - Page 14 of 16 - DexLab Analytics | Big Data Hadoop SAS R Analytics Predictive Modeling & Excel VBA

Join Us at a Free Live Demo Session Today, On Credit Risk Modelling With SAS

Learning is almost close to being free with the ascent of the internet era. People keen on learning new things need not go across the world or even migrate to different cities. They can simply open their browser and gather as much knowledge as they want online while watching tutorials, reading articles and guides and watching free demo sessions. This convenience is now available for the challenging field of data analytics as well, as DexLab Analytics the premiere data analytics training institute in the country is offering a free live demo session on Credit Risk Modelling using SAS this Saturday at 5 PM.


Join us at a free live demo session today, on Credit Risk Modelling with SAS


To join our demo session all you have to do is register for the same with an email directly to us at hello@dexlabanalytics.com or even drop in a line showing interested at our contact us form. Then all that is left to do is to make yourself comfortable with keen ears and eyes at 5 PM sharp in front of the computer screen. The demo session is to be held today (at 15/10/2016) live, online and will be completely free. Continue reading “Join Us at a Free Live Demo Session Today, On Credit Risk Modelling With SAS”

Can Creative AI Predict The Future?

Can Creative AI Predict The Future?

Artificial Intelligence is reaching new heights, as the researchers at Massachusetts Institute of Technology (MIT) have come up with a program that can estimate the future. The machines can predict the possible events that may occur in a given scenario. The scientists have programmed the machines in such a manner that they can transform a still image into a video. However, the experiment is in its initial stage and researchers wish that it would just get better with time.

Predicting the future

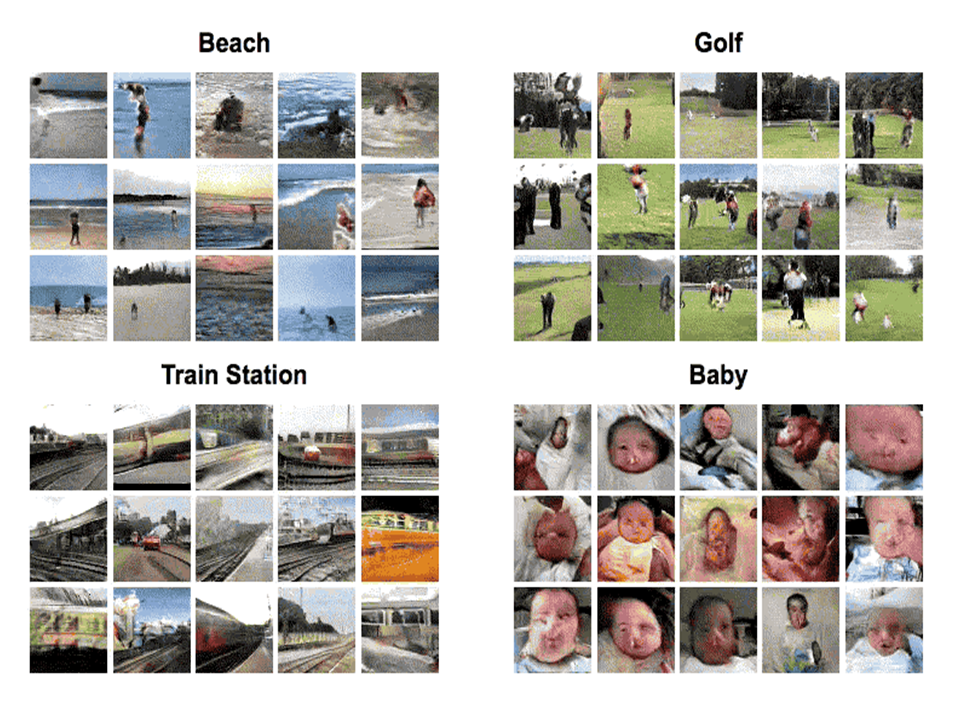
According to the researchers at MIT, this computer can view an image and figure out what may happen next. To be able to do so, the data scientists have fed the computers with humungous amounts of images and videos. All the videos and images were similar in terms of category. For example, videos of sea waves and beaches of previous years were input into the machines. So, the next time, when the computer is shown an image of a sea beach, it automatically generated a video from the still, which replicated how waves are hitting the shore and people are playing in the water. Similar experiments were conducted using images of newborn babies, golf players, and train stations. And in each case, the computer produced videos resembling the expression of these babies, movement of the golf clubs and trains approaching towards the platforms, respectively.

Predicting the future

But how does this machine do it?

As soon as enormous amounts of data are fed into the machine, it starts learning just as humans can. In this experiment by MIT, computers became familiar with the happenings at a sea beach. Therefore, the next time it is shown the picture of a sea beach, the machine analysed the image and eventually, showed what happens there. However, the scientists say that these videos have certain limitations.

According to Carl Vondrick, a Ph.D. student at the MIT, “AI can be trained to produce output just like human beings. They can recall an event and more importantly, AI can predict the possible outcomes of the event based on past records.” Thus, the deep learning programs are able to spot the similarity in several events and make predictions according to the past results, which may not be accurate in many times. From another perspective, these AI generated videos are too short, as their duration does not exceed 1 second. Moreover, the videos seem like some animated movements created during the 90’s.

Despite such limitations, scientists are hopeful about the future of AI because this experiment was just the beginning and the results were better than what was estimated. Vondrick expressed his views on how AI can help us stop any negative incident from happening. He said, “A machine can study the movements of an old man, which may enable it to forecast whether the person has a chance of falling. In that case, adequate measures can be taken in order to prevent the accident.”

Progress of the AI

Progress of the AI

Apart from MIT, there are several companies including the search engine giant Google that are working on AI. At the Google Cultural Institute (GCI) in Paris, computers are programmed to create new images and art forms. The GCI has developed an application that helps users to search artworks from the dataset of several museums across the world. What is fascinating is that algorithms solely administer the entire app. It can search the dataset of almost 7 million images and artworks and provide search results that match the search criteria. The most important feature of the program is that the application can figure out the difference between the emotions embedded in different pictures.  It can differentiate a peaceful picture from the rest by analysing its content. In addition, this program, also known as the ‘Deep Dream Project’ can create artworks on its own, which adds to the creativity of AI. Google is also working on the ‘Magenta Project’, which has recently created a piano melody on its own. The duration of the melody is 90-seconds and it is the first tangible music sample ever produced by AI.

Therefore, we can find that AI is enabling the computers to make judgements based on their intuition and at the same time, they are developing a sense of creativity. Days are not far when human beings will depend on AI to make their next move.

To get into the depth of the prowess of AI, opt for Machine Learning course online. DexLab Analytics is a leading Machine Learning training institute in Gurgaon. Go through their course itinerary.


Interested in a career in Data Analyst?

To learn more about Data Analyst with Advanced excel course – Enrol Now.
To learn more about Data Analyst with R Course – Enrol Now.
To learn more about Big Data Course – Enrol Now.

To learn more about Machine Learning Using Python and Spark – Enrol Now.
To learn more about Data Analyst with SAS Course – Enrol Now.
To learn more about Data Analyst with Apache Spark Course – Enrol Now.
To learn more about Data Analyst with Market Risk Analytics and Modelling Course – Enrol Now.

Are you keeping up with R? Here are a few free PDFs and online resources

Chances are if you found your way into this blog, then you are very well familiar with R programming, it is an open-source statistical and data mining programming language. Though a relatively new id around the block it is slowly catching up to its other commercial counterparts like those of SAS and SPSS. Many data analyst even believe that R programming will eventually replace other paid languages that are currently of choice for data analysts for modelling purposes.


Are you keeping up with R?  Here are a few free PDFs and online resources


Why so?


The main reason we believe is solely for commercial purposes. Many organizations are already questioning the massive amount of annual cost of other commercially available data analytics tools for their statement in the P&L statements. Furthermore this ongoing trend has escalated with the presence of R as a free and feasible replacement. Continue reading “Are you keeping up with R? Here are a few free PDFs and online resources”

Here is The Data Why We Think Iphone 7 is Going to Be a Huge Hit

While the media and the tech analysts think that they have got the iPhone 7 all figured out and presume that the iPhone 7 sales will not be much as it is not offering much of an improvement from the previously launched iPhone 6S. But we have taken a look at the data and have a theory that tells a different story. Why?


We think that iPhone 7 is going to be a massive hit because Apple Inc. Is installing its largest ever iPhone user base which is more than two years old.


Here is chart that depicts how many people upgrade their phones to the latest model soon after its launch. We discovered that the switch is highly dependent on the fact of how old their previous phones were. Surprisingly only 17 percent of the people change their phones immediately after the launch of a new one. The people who change their phones immediately after the launch of a new release is the lot with “the next gen phone + 1” or people with phones that are two years or older!  


Refer to the infographic below to understand the iPhone switching factor:

Continue reading “Here is The Data Why We Think Iphone 7 is Going to Be a Huge Hit”

Prepare For Your Data Science Job Interview With Answers to These Puzzles

Prepare For Your Data Science Job Interview With Answers to These Puzzles

You may have passed your data science certification course with flying colours, but getting your first break in an analytical job role can be quite difficult. Did you know that more than 30 percent of top tier analytical firms evaluate and select their candidates on their ability to solving puzzles? After all this is the best way to determine that they are logical, with ample creative thinking abilities and are definitely pros at dealing with numbers (a skill must have for data personnel).

The companies are keen on hiring people who have the ability to bring a unique perspective in solving business problems. Such individuals are capable of to offer their hiring firms with a huge advantage over other candidates. But to garner such capabilities an individual must practice regularly with consistent efforts.

As fellow data analysts, we recommend that you develop a daily habit of solving puzzles. They are mental exercises which on disciplined training will help you to get better with time. When employed in a job role that involves having to deal with complex problems everyday such a skill will prove to be an asset.

Are you ready to work out your grey matter cells? Here are the most common puzzles asked at interviews for data science positions:

These questions have been asked to candidates at companies like Amazon, Google, Goldman Sachs, and JP Morgan etc.

Note: Try solving these problems on your own before checking the solution, and feel free to share your logic behind the solutions in the comments below. We are all ears eyes to see how unique someone’s mind can be!

Puzzle #1:

Blind game challenge:

You have been placed in a dark room, there is a table kept in the room. The table has 50 coins atop its surface, out of these 50 coins 10 coins have their tails side up and 40 coins have their heads side up. Your task is to divide this set of 50 coins into 2 groups (not necessarily of equal size) so that both the groups have equal numbers of coins with the tails side up.

Solution #1:

The coins should be divided into two groups one with 40 coins and one with 10 coins, then flip all the coins in the group with 10 coins.

Puzzle #2:

Bag of coins problem:

You have been given 10 bags full of coins; each bag comes with an infinite number of coins. But there is a twist, one of the bags is full of forged coins but sadly you do not remember which one it is. But you do know that the weight of the real coins are 1 gram and those which are forged are 1.1 gram. Your task is to identify the bags in minimum readings with a digital weighing machine that has been provided with you.

2

Solutions #2:

You need to take 1 coin from the first bag, 2 coins from the second bag, and 3 coins from the third bag and so on and so forth. Eventually you will end up with 55 coins in total (1+2+3+4+…10). The next step is to weigh all the 55 coins together. You can identify which bag has the forged coins based on the final reading of the weighing machine. For instance, if the reading ends with 0.4 then it is the fourth bag with forged coins. And if it comes 0.7 then it is the 7th bag with the forgeries.

Puzzle #3:

The Sand timer trouble:

You have two hourglasses or sand timers one of which can show 4 minutes and the next one can show 7 minutes respectively. Your job is to use both the sand times (either one at a time or simultaneously or in any other combination) and measure a time of 9 minutes.

Solution #3:

Step 1: start the 7 minute sand timer along with the 4 minute sand timer

Step 2: when the 4 minute sand timer ends turn it upside down instantaneously

Step 3: when the 7 minute sand time ends also turn it down at that instant

Step 4: when the 4 minute sand timer ends turn the 7 minute sand timer upside down and it will have 1 minute worth of sand in it

Thus, effectively 8 + 1 = 9

In closing thoughts:

Hope these questions were enough to get your brain rolling, while a lot of these questions may seem challenging to most of the people, but with a little out-of-the-box analytical thinking you will soon discover that they are not too difficult to solve.

If these questions were simple enough for you, we have plenty more with increasing difficulty. And if all these brain picking has left you overwhelmed to the peak and all you want is to solve real-world data problems, then follow our regular social media uploads advertising latest job openings in the field of data science.

DexLab Analytics is a premier data science training institute in Gurgaon that offers program centric courses. Their online certification course on data science is stellar, come check out the course itinerary now.
DexLab Analytics Presents #BigDataIngestion

DexLab Analytics has started a new admission drive for prospective students interested in big data and data science certification. Enroll in #BigDataIngestion and enjoy 10% off on in-demand courses, including data science, machine learning, hadoop and business analytics.


Interested in a career in Data Analyst?

To learn more about Data Analyst with Advanced excel course – Enrol Now.
To learn more about Data Analyst with R Course – Enrol Now.
To learn more about Big Data Course – Enrol Now.

To learn more about Machine Learning Using Python and Spark – Enrol Now.
To learn more about Data Analyst with SAS Course – Enrol Now.
To learn more about Data Analyst with Apache Spark Course – Enrol Now.
To learn more about Data Analyst with Market Risk Analytics and Modelling Course – Enrol Now.

The Best Analytics Tools for Business And How to Make The Most of Them

The Best Analytics Tools for Business And How to Make The Most of Them

All companies are awash with useable data about their customers, prospects and internal business operations as well as suppliers and partners. But most of them are also ill-equipped with the requisite understanding to leverage this streaming flood of data and cannot convert it to actionable insights to increase their revenue by growing their revenue thus, increasing their efficiency. Business intelligence tools are technology that allows businesses to transform their data into actions for generating better business.

The Business Intelligence and analytics industry has been around for decades now and is considered by most analytics personnel as a mature industry. But this BI market is never static with constant evolution and innovation to prepare for meeting the ever expanding needs of businesses of all sizes and from a diverse range of industries. So, it is imperative that people gather an understanding of the different Business Analytics tools for better operation of their companies.

2

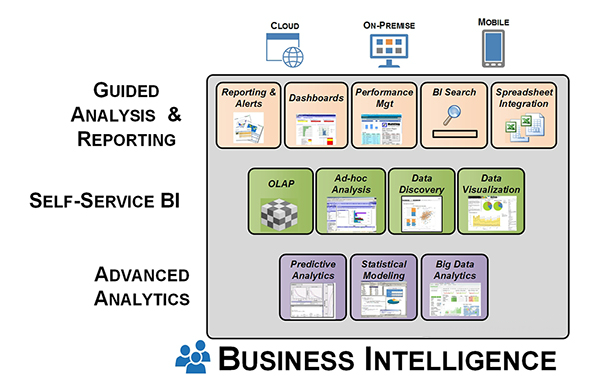
Business Intelligence tools can be categorised in three different groups:

  • Guided analysis and reporting
  • Self-service Business Intelligence and Analysis
  • Advanced Analytics

The first category of guided analysis and reporting includes Business Intelligence tools of traditional styles that have long been used for years to perform recurrent data analyses of specified data groups. This system of data analysis was only used for predefined static reporting several years ago, but today it is possible for data analysts to select, compare, visualize and analyse data using various tools and features.

Tool styles in this category include the following:

  • Reports
  • Scorecards and dashboards
  • Spreadsheet integration
  • BI Search
  • Corporate Performance Management

The second category of BI tools which falls under the category of self-service BI and analysis includes the tools BI users utilize to make ad hoc analysis of data. Such analytical practices may be a one-time analysis or building of a recurring analytical system that may with shared by others.

Usually the users of such Bi tools have a dual role to play – consumer of information and producer of analytical systems. They usually share or publish their BI application which they build with the self-service BI tool. The users of such tools will always have the term analyst in their job title. Staff members of the management department may also make use of such tools when they need to perform similar tasks as that of a business analyst, for their peers even if their job title does not imply that.

The Business Intelligence tools include in this category includes the following:

  • Ad hoc analyses and reporting
  • OLAP cubes i.e. online analytical processing
  • Data visualization
  • Data discovery

The third category of advanced analytics includes the tools that a data scientist uses to build predictive and prescriptive models of analysis. These are tools for predictive modelling, statistical modelling and data mining along with rigorous use of big data analytics software. In these cases data analyst spend a huge chunk of their time performing tasks like data ingestion, cleansing and integration.

To understand the full spectrum of different Business Intelligence tool classes here is a visual explanation:

dexlab

Who should invest in BI tools?

For a long time now investment and use of BI tools has been growing gradually regardless of the economic conditions. And it has especially accelerated in the recent times as companies crave for data for better growth and more organized operations. While data analytics tools were mainly associated with large enterprises due to their cost, complexity and demand of high skilled personnel, but those factors have now been grossly transformed as more and more SMBs (small and medium sized businesses) now being significant customers of BI tools and software.

Now that you have a good understanding of the different tool categories and how they should be deployed, the next step for you is to understand your  company specific needs and make the best use of these tools that are optimized for so.


Interested in a career in Data Analyst?

To learn more about Data Analyst with Advanced excel course – Enrol Now.
To learn more about Data Analyst with R Course – Enrol Now.
To learn more about Big Data Course – Enrol Now.

To learn more about Machine Learning Using Python and Spark – Enrol Now.
To learn more about Data Analyst with SAS Course – Enrol Now.
To learn more about Data Analyst with Apache Spark Course – Enrol Now.
To learn more about Data Analyst with Market Risk Analytics and Modelling Course – Enrol Now.
Tutorial for creating a Speedometer dial in MS Excel

 Tutorial for creating a Speedometer dial in MS Excel

Here in this video tutorial we have discussed in detailed steps, how to create a Speedometer chart in MS Excel. A Speedometer chart is often called as a gauge chart and combines two different type of charts, a pie chart and a doughnut chart.

The Speedometer dial is made with the help of using a Doughnut chart and needle is actually a combination of two types of charts, another doughnut chart and a pie chart.

A speedometer chart or a gauge chart can be created in other data visualization software as well, like for instance in Tableau and is usually easier to create due to availability of better controls and features.  It is due to the simplistic nature of these charts which is well adjusted to context of data and is a great use of space in a spreadsheet that charts like these are popular with non-data executives. Usually such non-data personnel do not want to dig deep into the contextual details like an analyst which is why these charts are great for using in a presentation where diverse departmental executives will be participating.

Gauge charts pack in a lot of horsepower and form a sort of ubiquitous symbol when it comes to understanding business metrics from an analytical point of view. So, learn to create these charts with our simple tutorial and for more such interesting lessons on data analysis software, join us every day as we share technical posts based on data on a regular basis.


Interested in a career in Data Analyst?

To learn more about Data Analyst with Advanced excel course – Enrol Now.
To learn more about Data Analyst with R Course – Enrol Now.
To learn more about Big Data Course – Enrol Now.

To learn more about Machine Learning Using Python and Spark – Enrol Now.
To learn more about Data Analyst with SAS Course – Enrol Now.
To learn more about Data Analyst with Apache Spark Course – Enrol Now.
To learn more about Data Analyst with Market Risk Analytics and Modelling Course – Enrol Now.

We Analyzed The Statistics Of Game Of Thrones

Are you a data science enthusiast as well as a fan of Game of Thrones? Then this blog is where you should stick your eyes to and fear not as we will not give you any spoilers.


We Analyzed The Statistics Of Game Of Thrones


Of the zillion of characters in the show, ever imagined which is the main character the show is leading with? Amidst the characters like Tyrion, Bran, Dany and pals who is the main one in the Game of Thrones? Continue reading “We Analyzed The Statistics Of Game Of Thrones”

Most Commonly Asked Tableau Interview Questions

Most Commonly Asked Tableau Interview Questions

In the near future, the world’s data generation will nearly double in amount than what it is now. According to a survey conducted by the IDC (International Data Corporation) by 2020 we will generate 50 times more data than in 2011. Now that such a gargantuan amount of data will be generated which will come with real-world business implications, thus, businesses around the world will require tools which should be capable to analyze this data and gather actionable insights from them. Tableau is a tool that helps organizations do exactly that, i.e. data mining and visualizing business opportunities to take requisite actions for amplifying revenue generation. So, it is understandable that the demand for personnel proficient in Tableau is expected to rise by manifolds in the next few years.

So, we India’s leading Tableau training institute have compiled a list of the most commonly asked interview questions for a position of Tableau operator/executive in this post. If you have more such questions that you have recently come across in an interview and would like to know the answer feel free to drop them in the comments below and our data science training faculty will get to them ASAP. And if you would like to take up a Tableau Certification course or take up an online Tableau training check out our curriculum on Tableau BI Certification.

2

Common interview questions on Tableau:

  • Do you know the difference between Live Data and Extract Data in Tableau?

The best answer to this question: An ‘extract’ connection is a connection with a static database, which is refreshed every day/hour/period. In this case all data are copied from the data source to the Tableau Server. Refreshing the data source will not give you the latest data – you have to refresh the extract to get them.

A live connection will query the underlying data in the data source/database – refreshing the visualization will give you the latest results. In this case no data is copied to Tableau Server for pre-processing.

• Name a few of the different types of filters used in tableau.

The best answer to this question:

The 3 types of Filters in Tableau are:
1) Quick Filter
2) Data Source Filter
3) Context Filter

  • Can you tell me the difference between parameters and filters in Tableau?

The best answer to this question: The difference actually lies in the application. Parameters allow users to insert their values these can be float, integers, string, date that can be used in calculations. However, filters receive only values users choose to ‘filter by’ the list this cannot be used to perform calculations.

Users can dynamically change measures and dimensions in parameter but filters do not support of this feature.

  • How will you view underlying SQL Queries in Tableau?

The best answer to this question: Viewing underlying SQL Queries in Tableau can be done in two ways:

• Create a Performance Recording, to register performance information about the main events you interact with workbook. Users can view the performance metrics in a workbook created by Tableau.

Help> Settings and Performance> Start Performance Recording
Help> Setting and Performance > Stop Performance Recording

• Reviewing the Tableau Desktop Logs located at C:\Users\\My Documents\My Tableau Repository. For live connection to data source, you can check log.txt and tabprotosrv.txt files. For an extract, check tdeserver.txt file.

  • Do you know the difference between .(dot) twb and .(dot) twbx?

The best answer to this question: The .(dot) twb is the most common file extension used in Tableau, which presents an XML format file and comprises all the data present in each dashboard and sheet like what fields are used in the views, styles and formatting that are applied to a sheet and dashboard.

But this workbook does not contain any data. The Packaged Workbook merges the data in a Tableau workbook with the local data available (which is not on server). A. (dot) twbx serves as a zip file this includes custom images if any. Packaged Workbook allows users to share their workbook information with other Tableau Desktop users and let them open it in Tableau Reader.

  • How many maximum tables can you join in Tableau?

The best answer to this question: A maximum number of 32 tables can be joined in Tableau. A table size must also be limited to 255 columns (fields).

Here were the answers to the most commonly asked Tableau interview questions, for more such interesting data analytics news, job updates and discussions follow our daily uploads from DexLab Analytics. We have recently launched our new branch in Pune, so, now Maharashtrians can also get their data analytics certification from DexLab Analytics, we add values to dull data!

Best of luck for your Tableau interview!


Interested in a career in Data Analyst?

To learn more about Data Analyst with Advanced excel course – Enrol Now.
To learn more about Data Analyst with R Course – Enrol Now.
To learn more about Big Data Course – Enrol Now.

To learn more about Machine Learning Using Python and Spark – Enrol Now.
To learn more about Data Analyst with SAS Course – Enrol Now.
To learn more about Data Analyst with Apache Spark Course – Enrol Now.
To learn more about Data Analyst with Market Risk Analytics and Modelling Course – Enrol Now.

Call us to know more