online courses Archives - Page 12 of 16 - DexLab Analytics | Big Data Hadoop SAS R Analytics Predictive Modeling & Excel VBA

The Olympics Turn To Data Analysis: Canadian Olympic Committee Deals In With Analytics

The Canadian Olympic company has recently teamed up with a major Big Data Company to ramp up the analytics for the benefit of the athletes.

 
The Olympics Turn To Data Analysis: Canadian Olympic Committee Deals In With Analytics
 

Recently the COC made an announcement about an eight-year, cash and services sponsorship deal with SAS, which is an analytics software with a brag-worthy client list from varied industries, like universities, hotels, banks casinos and much more.

Continue reading “The Olympics Turn To Data Analysis: Canadian Olympic Committee Deals In With Analytics”

How to Use PUT and %PUT Statements in SAS: 6 Tips

The PUT statement in SAS for programmers who have completed a SAS certification in the DATA step and the %PUT macro statements are highly useful statements, which will help to enable you to display the values of variables and macro variables, respectively.


How to Use PUT and %PUT Statements in SAS: 6 Tips


And almost by default the output will appear in the SAS logs. In this article we will share a few tips which will allow you to make use of these statements more efficiently.

Continue reading “How to Use PUT and %PUT Statements in SAS: 6 Tips”

The Choice Between SAS Vs. R Vs. Python: Which to Learn First?

It is a well-known fact that Python, R and SAS are the most important three languages to be learnt for data analysis.


The Choice Between SAS Vs. R Vs. Python: Which to Learn First?


If you are a fresh blood in the data science community and are not experienced in any of the above-mentioned languages, then it makes a lot of sense to be acquainted with R, SAS or Python.

Continue reading “The Choice Between SAS Vs. R Vs. Python: Which to Learn First?”

How to Read Data With SAS JSON Libname Engine

To those of you unaware of the developments in the SAS world, JSON is the new XML and the number of users who need to access JSON has really grown in the recent times. This is mainly due to proliferation of REST-based APIs and other web services. A good reason for JSON being so popular is the fact that it is structured data in the format of text. We have been capable of offering simple parsing techniques, which make use of data step and most recently PROC DS2. Now with the SAS 9.4 and Maintenance 4 we now have a built-in libname engine for the JSON XML.


How to read data with SAS JSON libname engine


As a SAS training institute we strive to keep our students updated with the latest developments in the field of data analytics even after they move on. Continue reading “How to Read Data With SAS JSON Libname Engine”

Five Major Big Data Trends That Will Shape AI this New Year

Many still believe that Big Data is a grossly misunderstood, mega trending buzzword in the tech field even today. However, there is still no denying of the fact that the recent development of AI and machine learning push is related on the synthesis and labelling of huge amounts of training data. A latest trend report by the advisory firm Ovum predicted that the Big Data market which currently is valued to be USD 1.7 billion, will further rise to be USD 9.4 billion by 2020.


Five Major Big Data Trends That Will Shape AI This New Year


Then what do the insiders in the data analytics market see it happening in the upcoming year ahead? We at DexLab Analytics, the premiere Big Data Hadoop institute in Delhi spoke to several leaders in this field to discover.


Here is what we found to be the five most important trends that will shape the future of machine learning, AI and data analytics in 2017 from the industry experts:


The predictions strongly emphasize the need for more talent and skilled personnel in this vast field of data analytics, thus, a growing demand for Big Data training and Big Data courses will be witnessed worldwide.

Continue reading “Five Major Big Data Trends That Will Shape AI this New Year”

5 Tips for Creating Different Map Styles in Tableau

5 Tips for Creating Different Map Styles in Tableau

Let us not waste any time on reading long-worded introductions, and get right down to our 5 top tips for creating different map styles in Tableau.

You will be able to find out about these tips and a lot more on Tableau with our Tableau training courses.

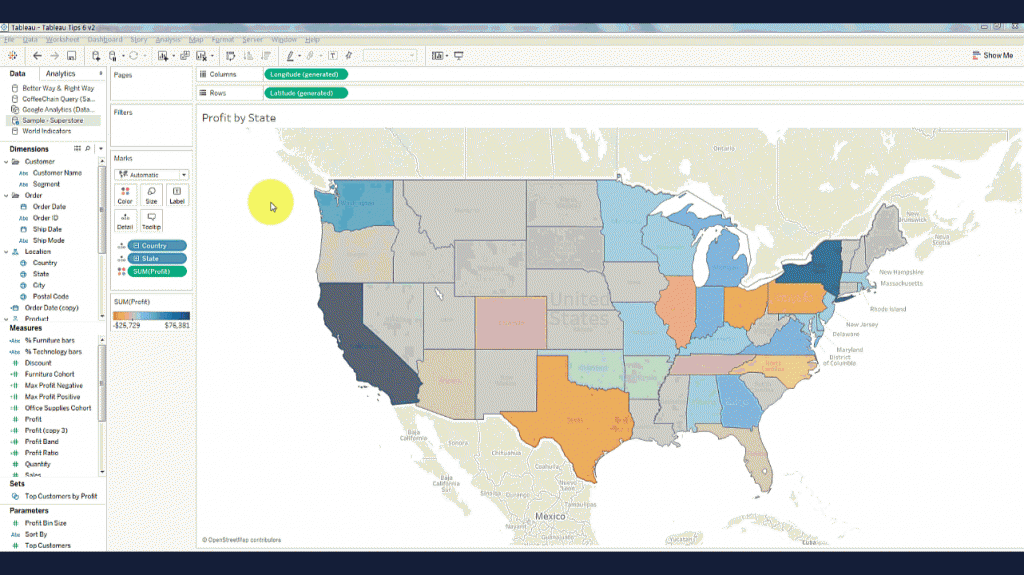
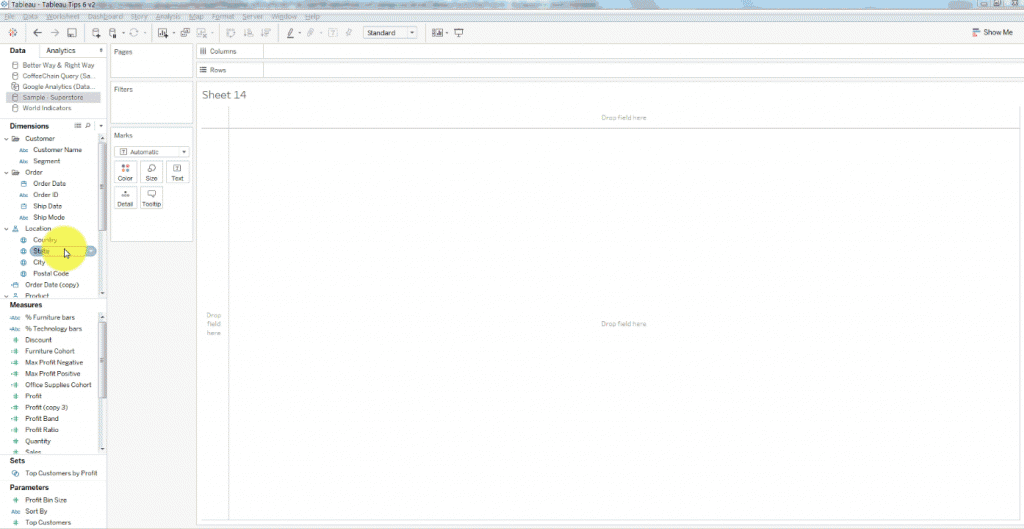
  1. Removing map layer:

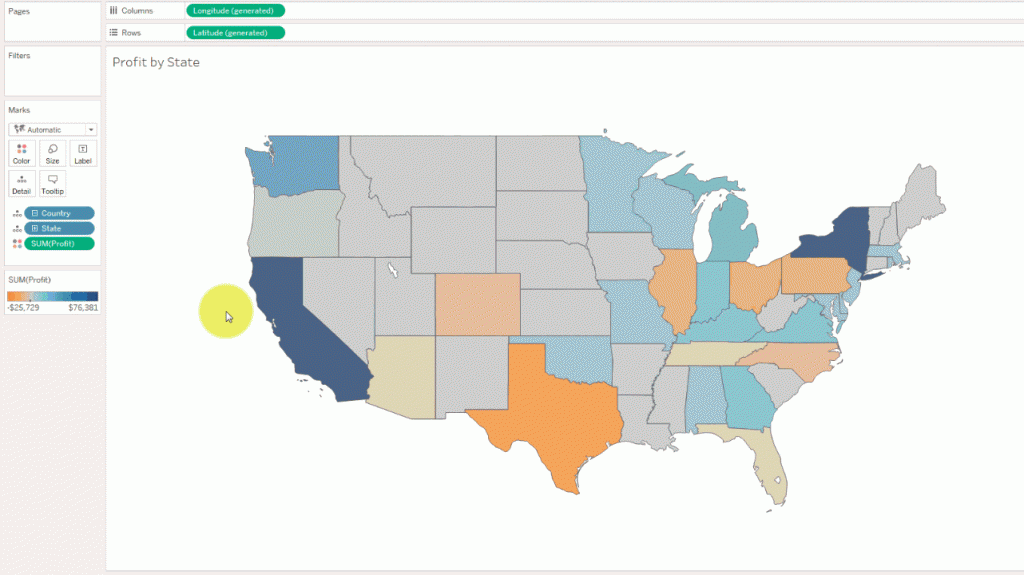
A simple way to create a clean map for best visualization is by removing the map layers. In order to do this, all you need to do is Select Map on the toolbar menu and “map layer”. Then simply click on the uncheck box and everything in the map layer window, this will leave behind only the outline of the map data.

Removing map layer:

Image Source: dataplusscience.com


Tableau course details has all these steps and much more to learn about the software, you can know the details by visiting our Tableau training institute website.

  1. Changing the map border colours:

When you use map, you can change the border colours of the map under the option ‘Color’. Simply select the colour and choose the border colour that you desire.

Changing the map border colours:

Image Source: dataplusscience.com


  1. Making the USA map outline:

Combining the above mentioned step 1 and 2 and by clicking to remove the fill colour, we can create an outline of a map. To do so, first remove the map layer shown in step 1 and then set the map fill colour to match with the background colour. And voila! After selecting the desirable colour for the borders (as shown in step 2) we now have created just a simple outline of the map of USA!

Making the USA map outline:

Image Source: dataplusscience.com


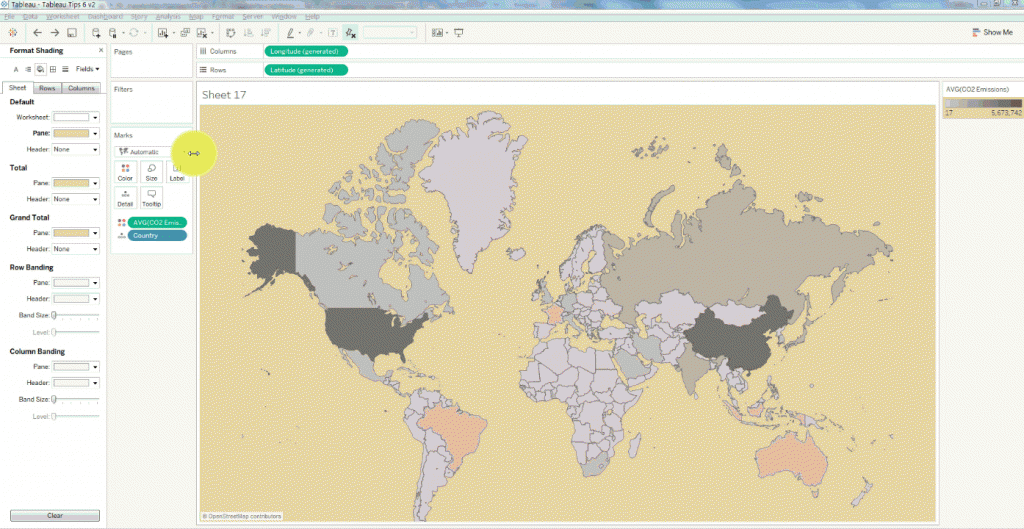
  1. Making a minimalistic map:

To do this in Tableau, you must remove the base layer which is similar as shown in the first step, we can then alter the Pane colour to change the colour of the water on the map to any colour we want. Once we get the base layer to be unchecked, all we have to do is simply right-click on the map and select ‘Format’ then select “Shading” and then alter the “Pane” colour to any shade of our choice.

  1. Creating the countries of the world:

Just like the previously discussed step (step 3) we can start by making the borders of the countries. In this case we have also combined the step 4 where the pane colour has been changed to match. This has given rise to a red coloured outline of the countries of the world on a pitch-black background.

Creating the countries of the world:

Image Source: dataplusscience.com


For more details on Tableau Certification Training in Gurgaon and which are the prominent Tableau training institutes in Delhi follow our regular uploads on this site.


Interested in a career in Data Analyst?

To learn more about Data Analyst with Advanced excel course – Enrol Now.
To learn more about Data Analyst with R Course – Enrol Now.
To learn more about Big Data Course – Enrol Now.

To learn more about Machine Learning Using Python and Spark – Enrol Now.
To learn more about Data Analyst with SAS Course – Enrol Now.
To learn more about Data Analyst with Apache Spark Course – Enrol Now.
To learn more about Data Analyst with Market Risk Analytics and Modelling Course – Enrol Now.

Big Data Analytics and its Impact on Manufacturing Sector

Big Data Analytics and its Impact on Manufacturing Sector

It is no new news that the Big Data and software analytics have had a huge impact on the modern industries. There are several industry disruptors that have surfaced in the past few years and totally changed the lives of all connected humans. Like Google, Tesla and Uber! These are the companies that have used the long list of benefits presented to us by Big Data to expand and infiltrate newer markets, they have helped themselves improve customer relations and enhance their supply chains in multiple segments of market.

As per the latest IDC Research projects the sale of Big Data and analytics services will rise to USD 187 billion in 2019. This will be a huge leap from the USD 122 billion which was recorded in 2015. A major industry that stands to benefit greatly from this expansion which is the manufacturing industry, with the industry revenue projections ranging to USD 39 billion by 2019.

The industry of manufacturing has come a long way from the age of craft industries. But back then, the manufacturing process involved a slow and tedious production processes which only yielded limited amounts of products.

The effects of Big Data Analytics on the Manufacturing sector:

 Automated processes along with mechanization have resulted in a generation of large piles of data, which is, much more than what most manufacturing enterprises know what to do with them.

But such data can yield beneficial insights for the manufacturing units to improve their operations and increase their productivity. Here are a few notable ones:


The effects of Big Data Analytics on the Manufacturing sector:

Image Source: mckinsey.com

Savings in cost:

Big data analytics can really help transform the manufacturing process and revolutionize the way they are carried out. The obtained information can be used to reduce the cost of production and packaging during manufacturing. Moreover, companies which implement data analytics can also reduce the cost of transport, packaging along with warehousing. This is in turn can help inventory costs and return i huge savings.

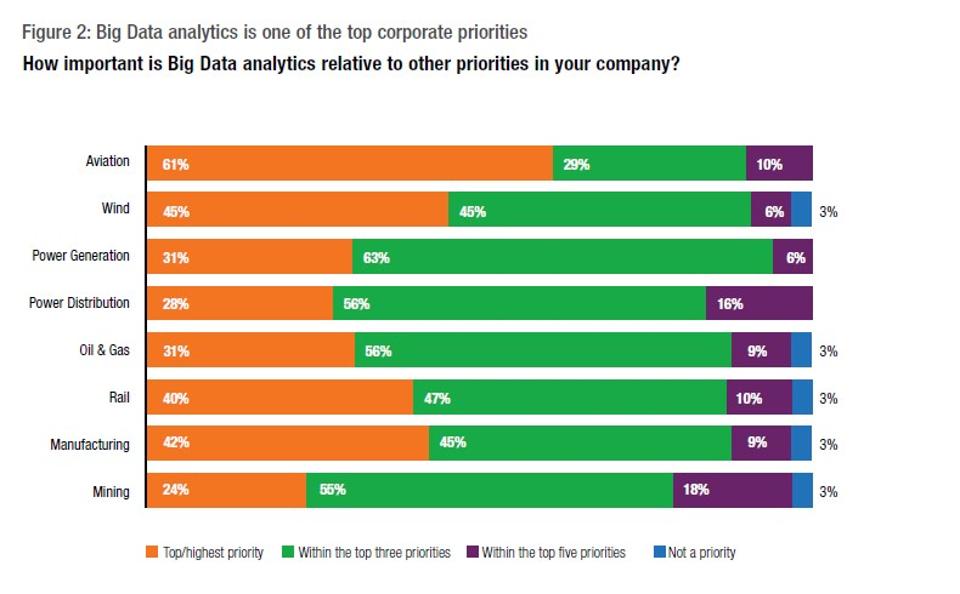
Improvement in safety and quality:

A lot of manufacturing companies are now making use of computerised sensors during the production to sift through low quality products while on the assembly line. With the right software analytics enterprises can use the data generated from such sensors to improve the quality and safety of the products instead of simply throwing away the low quality products after the production.

Improvement in safety and quality:

Image Source: blogs-images.forbes.com

Tightening up the workforce efficiency:

They can also use this data to improve management and employee efficiency. Big data analytics can be used to study the error rates on the production floor and use that information to analyse specific regions where employees are good when they perform under pressure.

Moreover, data analytics may help to speed up the production process n the production floor. S will be especially useful for large firms, which work with large volumes of data.

Better collaboration:

A great advantage of having an IT based data collection and analysis infrastructure is improved information movement within the manufacturing organization. The synergy of flow of information within the management and engineering departments as well as in the quality control sector and between the machine operators and other departments of the company helps them work more efficiently.

The manufacturing industry is much more complex than any other industry, which have implemented the big data analytics. Companies must effectively time the implementation of this software so that there are no losses. And should also pay attention as to from where they can mine the data and the right analytics tools to use for producing feasible and actionable results.


Interested in a career in Data Analyst?

To learn more about Data Analyst with Advanced excel course – Enrol Now.
To learn more about Data Analyst with R Course – Enrol Now.
To learn more about Big Data Course – Enrol Now.

To learn more about Machine Learning Using Python and Spark – Enrol Now.
To learn more about Data Analyst with SAS Course – Enrol Now.
To learn more about Data Analyst with Apache Spark Course – Enrol Now.
To learn more about Data Analyst with Market Risk Analytics and Modelling Course – Enrol Now.

How Predictive Analysis Works With Data Mining

We know that you have probably heard many times that predictive analysis will further optimize and accentuate your marketing campaigns. But it is hard to envision that in more concrete terms what it will achieve. This makes it harder to choose and direct analytics technology.


How Predictive Analysis Works With Data Mining


Wondering how you can get a functional value for marketing, sales and product directions without being an expert? The solution to all your problems lies in how predictive analytics may offer with benefits for the current marketing operations. But to use it you must learn a few specifics about how it works.

Continue reading “How Predictive Analysis Works With Data Mining”

Why Businesses Must Adapt to AI To Thrive in The Market?

Why Businesses Must Adapt to AI To Thrive in The Market?

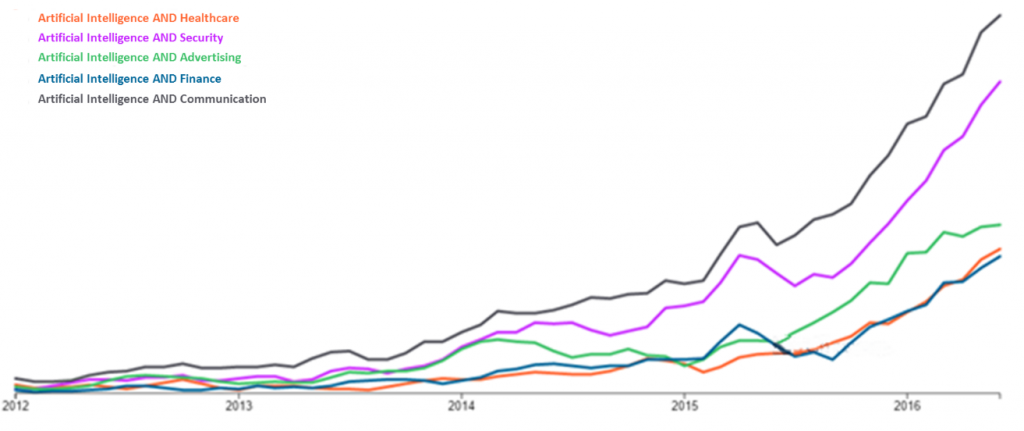
It is a fact that Artificial Intelligence is no longer just a sci-fi hype anymore, but is in fact a major reality. The approached based on Artificial Intelligence like Natural Language Processing (NLP), Machine Learning (ML) and Deep Learning are slowly emerging to be highly realistic technologies within the industry.

Today we have a very efficient NLP engine system, which is as powerful as ML and deep learning algorithms available. In a recent article, published on WIRED we read about the perpetual death of code (i.e. programs and programming) and how we will soon be training in systems, just as the way we train our pets!

2

Machine Learning is the same as learning from examples and experiences just like in real life. It is all about digesting huge volumes of data. We see great new developments within the industry such as IBM and Memorial Sloan Kettering are training Watson in things like Oncology by making use of massive amounts of patient medical records throughout the world. Watson learns from knowing how doctors are treating patients with cancer around the globe, just as how a medical student learns but only on a much larger scale.

Another great example of machine learning is from Japan. The farmers here are cultivating crispy fresh cucumbers with several prickles on them. The straight and thick cucumbers with a vibrant colour and lots of prickles are known to be of premium grade quality. Each cucumber has a different colour, quality, shape and freshness. They are sorted into nine different classes based on their size, shape, texture, colour, the amount of small scratches and whether or not they are crooked, along with the most important part of the amount of prickles on them. However, there is not well-defined instruction set for the classification of cucumbers in Japan.
AI Trends

Image Source: magisteradvisors.com

A farmer and agricultural scientist Makoto Koike has been studying this problem for several years now, and has been helping his farmer parents sort out cucumbers. But now with the use of Google’s TesorFlow based machine learning algorithm, he has been able to develop a system that learns from the precise way his parents have been sorting cucumbers in their farm. For achieving this, he had trained his system by using 7000 images of cucumbers that have been sorted by his mother, and at present the system classifies cucumbers with a much better rate of success and that too at a rapid speed.

Companies like Capgemeni have been making use of the technology of IBM’s Watson to improve efficiency and effectiveness in the resource supply chain.
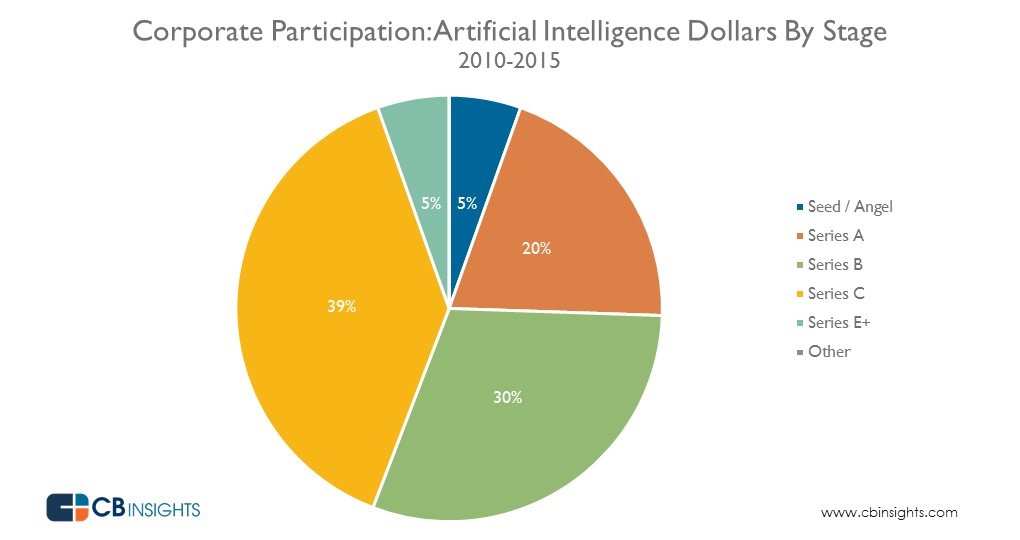
Image Source: vceestartups.com

Image Source: vceestartups.com

It is predicted that the AI wave will definitely take the industry by storm and have a profound impact on almost all business and transform the present technology climate.

Moreover, we need to quickly turn our businesses into an AI-based approach along with implementation of Machine Learning, which will be supported by NLP and OCR (optical character recognition), speech recognition, and image recognition.

There are three trends in favour of the present technology service providers and their team of workers:

  1. The global expense on technology is increasing. So, technology enterprises will increase their size and market share by adapting to these new ways of working.
  2. The present availability of AI technology across the world is less than the amount that the world needs. So, the companies and individuals must pick up the pace to quickly expand their AI capabilities, and only then they will shine in the market. As for those interested in AI this is the best time to advance in their skills to become market leaders.
  3. The industry transformation has resulted in the marginalization of the CIO role in business and the expense into technology services by business buyers. This gives an edge to the business-oriented teams in play.
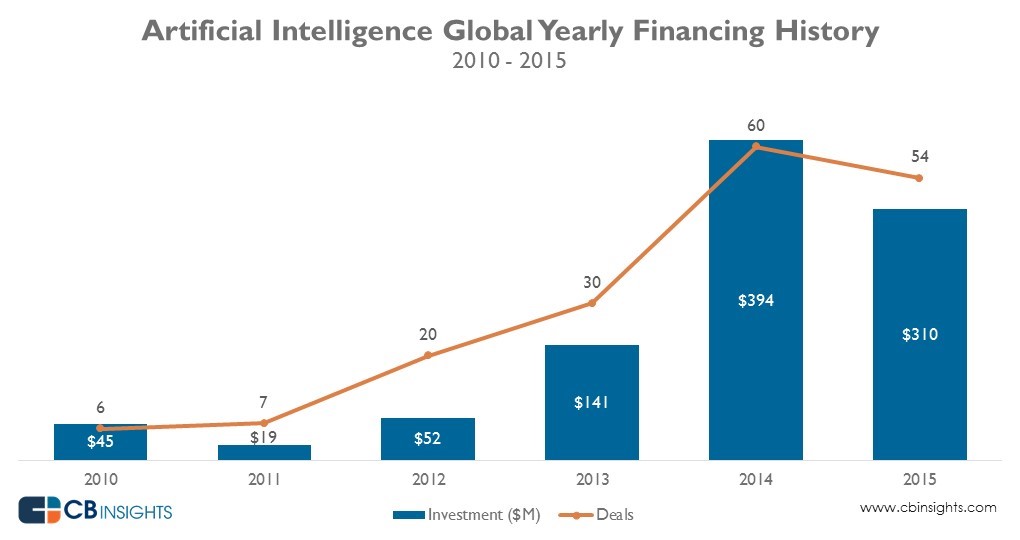
Image Source: cbi-blog.s3.amazonaws.com

Image Source: cbi-blog.s3.amazonaws.com

But reacting to this new demand for technology also needs AI and will bring newer challenges on board. The first being, change can only happen when the stakeholders of the company believe in the same. But sadly, many employees and managers do not believe in the capabilities of AI until they experience it on their own. It is for those who believe and develop their required skills and embrace the impending digital evolution that is destined to flourish.

However, secondly companies must address the problem of how to deal with the possible cannibalization of the existing revenues in order to adopt these new technologies. And finally, the lack of skill in the world of technology will make it even harder to build and expand AI capabilities.

Nevertheless, due to an industry boom, over the past 20 years a large percentage of the existing staff has skills that are almost obsolete and will not have new ones. Thus, this will bring an interesting future journey for the tech industry.


Interested in a career in Data Analyst?

To learn more about Data Analyst with Advanced excel course – Enrol Now.
To learn more about Data Analyst with R Course – Enrol Now.
To learn more about Big Data Course – Enrol Now.

To learn more about Machine Learning Using Python and Spark – Enrol Now.
To learn more about Data Analyst with SAS Course – Enrol Now.
To learn more about Data Analyst with Apache Spark Course – Enrol Now.
To learn more about Data Analyst with Market Risk Analytics and Modelling Course – Enrol Now.

Call us to know more