online courses Archives - Page 11 of 16 - DexLab Analytics | Big Data Hadoop SAS R Analytics Predictive Modeling & Excel VBA

Introducing The New R Tools For Visual Studio

Introducing The New R Tools For Visual Studio

It is a great new development that the new Visual Studio now speaks the R Language!

Here is how:

RTVS-1


Decidedly now R is the most popular statistical data analysis language which is in use these days. The R tools for Visual Studio brings together the power of R and Visual Studio in the same pod, for a convenient, and easy to use plug-in that is not only free and open source, but is very user friendly. When it is combined with the powers of Visual Studio Community Edition, then you will receive a multilingual IDE, which is perpetually free for all small teams.


In order to showcase and inspire testing and evaluation from the developer community, the R tools package for Visual Studios has been launched as a public preview version.


R Programming courses in Gurgaon with placement assistance is provided by DexLab Analytics.


Here are the new exciting features being introduced in this preview release version:


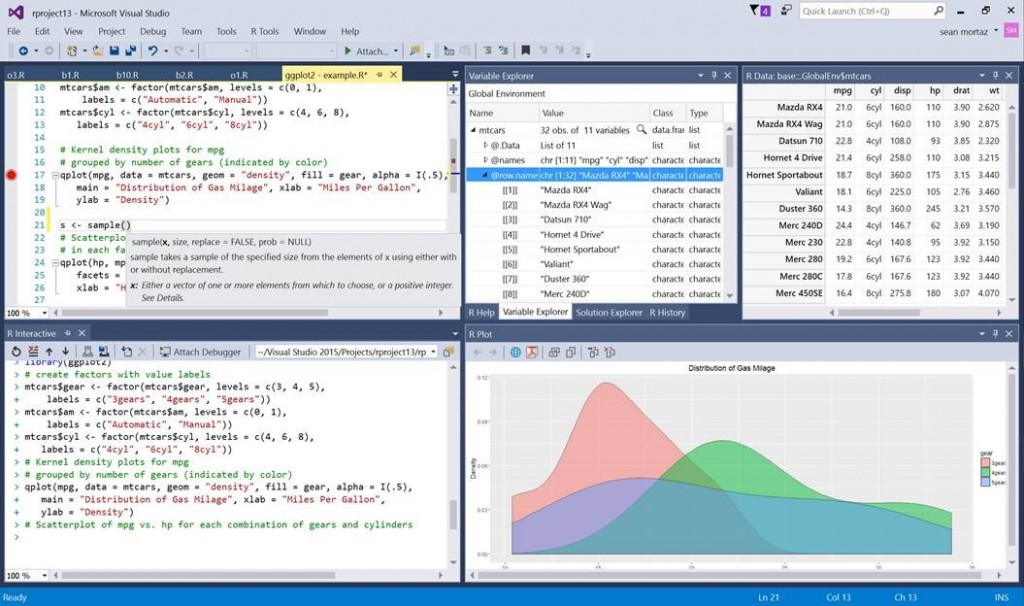
  • Editor – this is a complete package for fine editing experience finished with R scripts and functions, which also include detachable/ tabbed windows, syntax highlighting and a lot more.
  • IntelliSense – this is also known as auto-completion and is available in both the editor as well as the Interactive R window
  • R Interactive Window – with this you can work directly with R console from within the Visual Studio
  • History window – one can search, view, and select previous commands and then send it to the Interactive Window.
  • A variable explorer – now get the advantage to drill deep into your R data structures and examine their values
  • Plotting – now check all your R plots within a Visual Studio tool window
  • Debugging – stepping, breakpoints, watch windows, call stacks and much more
  • R markdown ­– get to use R Markdown/knitr support with export to Word and HTML
  • Git – get control over source code through Git and GitHub
  • Extensions – more than 6000 extensions covering a wide spectrum from Data to Productivity to Language
  • Help – view R documentation with the use of ? and ?? in Visual Studio itself
  • A polyglot IDE – VS supports, R, Python, C and C++, C#, Node.js, SQL, etc projects can be managed simultaneously.


Some other features that were requested by the R developer community are the Package Manager GUI, Visual Studio Code (cross-plat), and more, which will be a part of one of our future updates.

Now use Azure ML SDK:

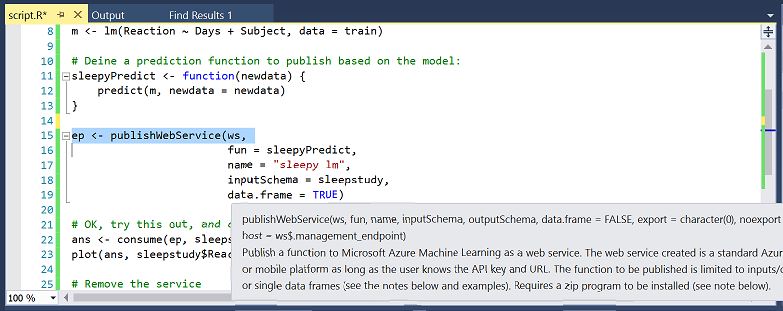
Now you can use the R SDK with the RTVS to access all your datasets and also workspaces on the Azure ML. You can use the environment to build and test the models locally and easily operationalize them at scale on Azure.

RTVS3-final

This SDK is not tied to RTVS, but it can be used from any environment to publish models to Azure ML.

Conclusion:

This new element to the analytics offerings viz. a powerful R authoring environment post their previous announcements of Microsoft R Open and Microsoft R server announcements that took place last year is an exciting development.

Let’s Take Your Data Dreams to the Next Level

For more exciting news on RTVS stay tuned to our regular blogs, because the time has never been better to be a data analyst.

Get R language certification in Delhi from industrial experts with years’ worth of experience at DexLab Analytics.


Interested in a career in Data Analyst?

To learn more about Machine Learning Using Python and Spark – click here.
To learn more about Data Analyst with Advanced excel course – click here.
To learn more about Data Analyst with SAS Course – click here.
To learn more about Data Analyst with R Course – click here.
To learn more about Big Data Course – click here.
We are Proud to Host Corporate Training for WHO Reps!

We are happy to announce our month-long corporate training session for the representatives of WHO, who will be joining us to discuss data analytics all the way from Bhutan. The team of delegates who have come to seek training from our expert in-house trainers are for the Central of Disease Control, Ministry of Health Royal Government of Bhutan.

 
We are Proud to Host Corporate Training for WHO Reps!
 

The training is on the concepts of R Programming, Data Science using R and Statistical Modelling using R, and will go on from the 8th of February 2017 to the 8th of March 2017. We are hosting this training session at our headquarters in Gurgaon, Delhi NCR. It is a matter of great pride and honour for the team of seasoned industry expert trainers at DexLab Analytics to be hosting the representatives from WHO.

Continue reading “We are Proud to Host Corporate Training for WHO Reps!”

Participate at the Atharva’17 “The Ultimate CMO Challenge, sponsored by DexLab Analytics

We have some intriguing news, The Ultimate CMO Challenge from the Delhi School of Economics, University of Delhi is being held and we are sponsoring the event. Participate at the Ultimate CMO Challenge if you a PG student or are pursuing a course in MBA.

 
Participate at the Atharva’17 “The Ultimate CMO Challenge, sponsored by DexLab Analytics
 

The first round will be an online round where participants would have to submit their solutions online. Problem case will be sent to the teams that have registered for the challenge, the solution to be submitted should be of 6 slides except the cover slides. One can mail their solutions to cmo.atharva@mibdu.org

Continue reading “Participate at the Atharva’17 “The Ultimate CMO Challenge, sponsored by DexLab Analytics”

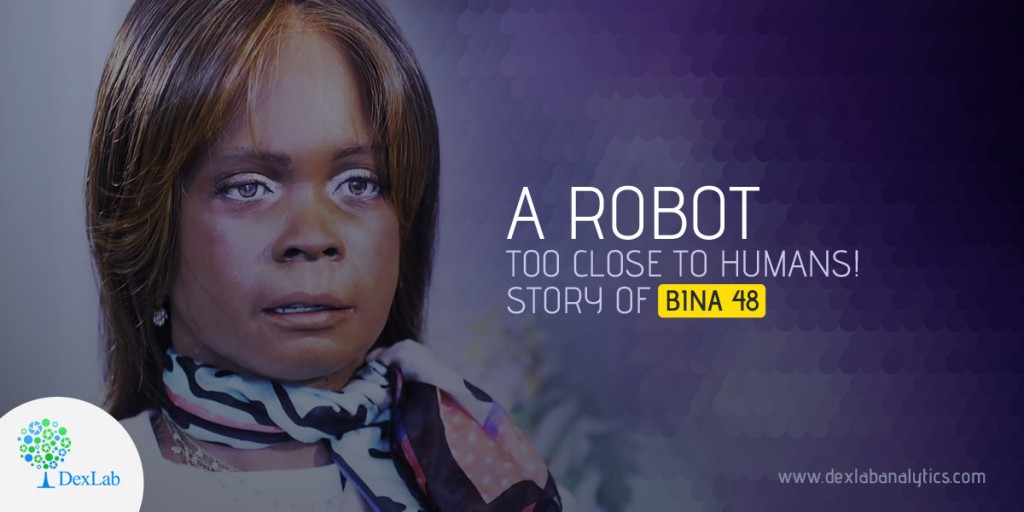
A robot too close to humans! Story of BINA 48

BINA 48 is the world’s most renowned and highly sought after humanoid robot in America. You can visit her there, by driving down a long winding dirt road just west of the Lincoln Gap in Bristol, Vt. Where sits two large yellow houses on a sprawling property that features ten solar panels and a dock over-looking the sunlit pond filled with trout, a homely porch decorated with rocking chairs.

Advances in Machine Learning and Data Analysis Bina 48


In the smaller of the two houses resides BINA 48, who is one of the most sought after humanoid who is based on a real personality – Bina Rothblatt.

Continue reading “A robot too close to humans! Story of BINA 48”

2.5 Quintillion Bytes of Data are Being Created Everyday

Astounding amounts of 2.5 quintillion bytes of data are created everyday today. Attached with this post is an informative infographic made by our team of trainers at DexLab Analytics.


The process of Big Data accumulation is best described as the collection of complex and large datasets of such an amount that it becomes difficult to process, capture, store, analyze and search them with the use of conventional data base systems.


It requires the use of more advanced mechanisms to do the same. Currently the use of Big Data is shaping the world around us, offering a deeper qualitative insight within our daily lives.

Continue reading “2.5 Quintillion Bytes of Data are Being Created Everyday”

Improve Your Business Intelligence Strategy In Just Six Steps!

When Moore’s Law meets with modern day Business Intelligence, what happens? Disruption and then wider adoption!

Improve Your Business Intelligence Strategy In Just Six Steps!

With costs of implementing BI tools lowering, more and more enterprises are keen on jumping on-board the homebrewed variety of custom BI solution to help drive their business. The result of these efforts is that these days several organizations are pursuing data driven intelligent decision-making, at a cost, which is almost fractional compared to yesteryear’s Business Intelligence budgets.

A proper Big Data certification allows individuals to make the best of available smart BI solutions available out there!

But the question remains, as to are all these companies actually making better decisions?

Surely, most enterprises are now reaping the benefits of having a larger range of BI solutions available to them. Nevertheless, there is still a bigger room for error in the picture, which many firms tend to ignore.

If done right, BI solutions can deliver an ROI of USD 10.66 for the cost of every dollar spent on implementing them. But, as per a survey conducted by Gartner, the results are not so glorious for most firms. More than 70 percent of all BI implementations do not stand up to meet the business goals that were anticipated of them.

Due to the evolution and lowering BI solution prices, the demand for data analytics certification courses have grown by several manifolds.

Is there a secret formula to BI solution driven success? Well, starting with asking the right questions is always a good place to begin:

Here are six steps that can tip the balance in your favour:

Private-Blog-Network-Footprints

 Which data sources to use?

Do you know what the lifeblood is for BI? Why, data of course, data is what Business Intelligence strives upon. All firms do have a rudimentary strategy to collect and analyze data, however, they tend to overlook the data sources. The key here to note is – truly reliable data sources are the main difference between the success and failure of your Business Intelligence efforts.

These data sources do exist; all you have to do is choose right. In addition, the best thing about them is a lot of them are almost free of charge. Using the good ones will transform the way you look at your market, the business pipeline and the way you perceive your audience.

Are you warehousing your precious data right?

These are your firm’s single source data repositories. Warehouses store all the data you collect from various sources, and provide the same for when needed, on prompt for reporting and analysis. However, self-service BI tools can be a bit of hit-or-miss at times, where consistently handling data is a worry.

The key is to discover a data warehouse solution, which can efficiently store, curate and retrieve data for analysis on prompt.

Are your analytics solutions good enough?

Companies that are looking to use their own Business Intelligence infrastructures must identify the analytics architecture that best suits their necessities. However, unwieldy datasets in combination with a lack of processing maturity can dull the effort even before one decides to start!

How does your BI solution integrate with the existing platforms?

For incorporating enterprise-scale Business Intelligence solutions, it is necessary to have it work effortlessly with the different other information formats, processes and systems, which have already been established previously in the internal work pipeline.

So, the key here is to ask the question – will the necessary integration cost more in terms of resources and effort that you can afford?

Use reporting mechanisms that are both powerful as well as easy to understand:

The most persistent challenge in BI is to wrangle data, majority of users cannot understand any of it beyond a simplified visualization. Decision-makers may be fooled with the help of powerful visualization tools. However, the truth is that making it pretty alone will not get the job done right.

So, forget pretty, and ask the all important question of whether the reporting mechanism is useful in interpreting otherwise unintelligible data or not.

Has better compliance enabled through your Bi solutions?

If your BI solutions, directly impinges on relevant regulations (and so it will, when the time comes). Then the solutions should aid the compliance and not hinder it. A good BI solution should provide a means to trace and audit data and its sources wherever, needed.

In conclusion: the success of your efforts will ultimately depend on the data.

The field of data science is evolving in expertise. And even professionals involved in the field tend to vary in their capabilities and opinions about the same. So, the important thing is to consider the importance of data in your company, and that one has all the appropriate responses to the posed questions above.

You can learn to ask the right questions with comprehensive tableau BI training courses. For more information on tableau course details feel free to contact the experts at DexLab Analytics.


Interested in a career in Data Analyst?

To learn more about Machine Learning Using Python and Spark – click here.
To learn more about Data Analyst with Advanced excel course – click here.
To learn more about Data Analyst with SAS Course – click here.
To learn more about Data Analyst with R Course – click here.
To learn more about Big Data Course – click here.

What is Truly Efficient? Understanding Stratified Random Sample

What is Truly Efficient?  Understanding Stratified Random Sample:

We have discussed several times the efficiency of various techniques for selecting a simple random sample from an expansive dataset. With PROC SURVEYSELECT will do the job easily…


proc surveyselect data=large out=sample
	 method=srs   /* simple random sample */
	 rate=.01;   /* 1% sample rate       */
run;


However, let us assume that our data includes a STATE variable, and one would want to guarantee that a random sample includes the precise proportion of observations from each of the states of America.

Continue reading “What is Truly Efficient? Understanding Stratified Random Sample”

How to Assess Clustering Tendency: Unsupervised Machine Learning

How To Assess Clustering Tendency: Unsupervised Machine Learning

The meaning of clustering algorithms include partitioning methods (PAM, K-means, FANNY, CLARA etc) along with hierarchical clustering which are used to split the dataset into two groups or clusters of similar objects.

A natural question that comes, before applying any clustering method on the dataset is:

Does the dataset comprise of any inherent clusters?

A big problem associated to this, in case of unsupervised machine learning is that clustering methods often return clusters even though the data does not include any clusters. Put in other words, if one blindly applies a clustering analysis on a dataset, it will divide the data into several clusters because that is precisely what they are supposed to do. Continue reading “How to Assess Clustering Tendency: Unsupervised Machine Learning”

Here Are Four Predictions For AI This 2017!

Last year was the year, which saw artificial intelligence, went mainstream.


Here Are Four Predictions For AI This 2017!


By that, we do not mean just getting filtered raunchy photos on Twitter or getting the fake news suggestions on Facebook.

Here is what to look for in Artificial Intelligence for this New Year:

  • Driven by unprecedented financial support (along with a growing open source ecosystem), founders have been delivering artificial intelligence start-ups at a record high rate.
  • GE, Google, Intel, Microsoft, Facebook, Apple, Salesforce and Samsung, and several other name brands made rigorous AI investments last year.
  • There are now five million homes, which, are talking about their music and shopping choices with the help of Alexa from Amazon.
  • There is a whole new department of U.S. Department of Transportation Committee for self-driving cars. Even a few years ago, there were people talking about 2025 or so for the accessibility of self-driving cars (of level 5 autonomy), but this is a reality now, much before we could reach 2020. It is also amazing to think that self-driving cars may whittle down the 1.2 million annual deaths from automobiles.
  • Also in other interesting news, two AI unicorns just grew their horns, the Cylance in Silicon Valley and iCarbonX in China.
  • Also more than one-fifth of the MIT 50 smartest companies list, include AI as a core approach these days.

Continue reading “Here Are Four Predictions For AI This 2017!”

Call us to know more