At the previous month’s “R user group meeting in Melbourne”, they had a theme going; which was “Experiences with using SAS and R in insurance and banking”. In that convention, Hong Ooi from ANZ (Australia and New Zealand Banking Group) spoke on the “experiences in credit risk analysis with R”. He gave a presentation, which has a great story told through slides about implementing R programming for fiscal analyses at a few major banks.
In the slides he made, one can see the following:
How R is used to fit models for mortgage loss at ANZ
A customized model is made to assess the probability of default for individual’s loans with a heavy tailed T distribution for volatility.
One slide goes on to display how the standard lm function for regression is adapted for a non-Gaussian error distribution — one of the many benefits of having the source code available in R.
A comparison in between R and SAS for fitting such non-standard models
Mr. Ooi also notes that SAS does contain various options for modelling variance like for instance, SAS PROC MIXED, PRIC NLIN. However, none of these are as flexible or powerful as R. The main difference as per Ooi, is that R modelling functions return as object as opposed to returning with a mere textual output. This however, can be later modified and manipulated with to adapt to a new modelling situation and generate summaries, predictions and more. An R programmer can do this manipulation.
Read Also: From dreams to reality: a vision to train the youngsters about big data analytics by the young entrepreneurs:
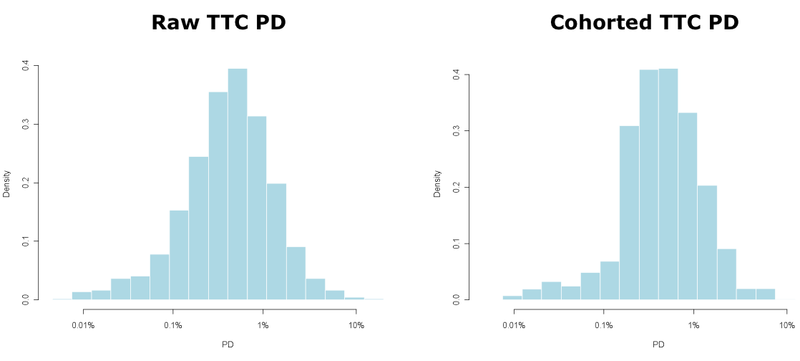
We can use cohort models to aggregate the point estimates for default into an overall risk portfolio as follows:
He revealed how ANZ implemented a stress-testing simulation, which made available to business users via an Excel interface:
The primary analysis is done in r programming within 2 minutes usually, in comparison to SAS versions that actually took 4 hours to run, and frequently kept crashing due to lack of disk space. As the data is stored within SAS; SAS code is often used to create the source data…
While an R script can be used to automate the process of writing, the SAS code can do so with much simplicity around the flexible limitations of SAS.
Read Also: Dexlab Analytics' Workshop on Sentiment Analysis of Twitter Data Using R Programming
Comparison between use of R and SAS’s IML language to implement algorithms:
Mr. Ooi’s R programming code has a neat trick of creating a matrix of R list objects, which is fairly difficult to do with IML’s matrix only data structures.
He also discussed some of the challenges one ma face when trying to deploy open-source R in the commercial organizations, like “who should I yell at if things do now work right”.
And lastly he also discussed a collection of typically useful R resources as well.
For people who work in a bank and need help adopting R in the workflow, may make use of this presentation to get some knowledge about the same. And also feel free to get in touch with our in-house experts in R programming at DexLab Analytics, the premiere R programming training institute in India.
Ref – https://www.r-bloggers.com/how-anz-uses-r-for-credit-risk-analysis/
Interested in a career in Data Analyst?
To learn more about Data Analyst with Advanced excel course – Enrol Now.
To learn more about Data Analyst with R Course – Enrol Now.
To learn more about Big Data Course – Enrol Now.To learn more about Machine Learning Using Python and Spark – Enrol Now.
To learn more about Data Analyst with SAS Course – Enrol Now.
To learn more about Data Analyst with Apache Spark Course – Enrol Now.
To learn more about Data Analyst with Market Risk Analytics and Modelling Course – Enrol Now.
