online certification Archives - Page 6 of 15 - DexLab Analytics | Big Data Hadoop SAS R Analytics Predictive Modeling & Excel VBA

New and Improved Data Pane in SAS Visual Analytics Now Goes Painless

New-and-Improved-Data-Pane-in-SAS--Visual-Analytics-Now-Goes-Painless
 

It seems some good news is waiting for you – honing your data for effective reports are easier now with the 8.1 release of SAS Visual Analytics. In this technical blog, we will understand the structure of data pane, how it exhibits data from an active data source, and a handful number of tasks, which you might want to perform – like viewing measure details, adjusting data item properties and fabricating geographic data items, custom categories and hierarchies.

Continue reading “New and Improved Data Pane in SAS Visual Analytics Now Goes Painless”

The Tides Of Change Is Here: Accenture’s Bhaskar Ghosh Talks About AI, IoT and Big Data

With the Fourth Industrial Revolution looming ahead, many would think that we are already in a digital economy era. Well, somewhat it holds true even. There are countless new apps and software programmes that help people hail a cab, make reservations in a hotel or mop floors by using robotic technology. Smart machines have become really smart to do a plethora of highly adept jobs, which would have been a little bit difficult on the part of humans to perform.

 
The Tides Of Change Is Here: Accenture’s Bhaskar Ghosh Talks About AI, IoT and Big Data
 

“While technology has long been developed to serve specific business needs, we are now in an era where people are central to the design and development of technologies,” stated Bhaskar Ghosh, group chief executive, Accenture Technology Services. In a recent interview with a leading financial magazine, he talked over Accenture’s Technology Vision 2017 and gave snippets about the latest trends and innovations that have become a pre-requisite to achieve success in the more-than-ever digitised economy.

Continue reading “The Tides Of Change Is Here: Accenture’s Bhaskar Ghosh Talks About AI, IoT and Big Data”

Celebrate #InternationalYogaDay: Get the Most Out of Yoga from Big Data

Celebrate #InternationalYogaDay: Get the Most Out of Yoga from Big Data


Bored of the same old fitness routine?


This International Yoga Day, dust off your yoga mat and take a holistic approach to health and wellbeing. Continue reading “Celebrate #InternationalYogaDay: Get the Most Out of Yoga from Big Data”

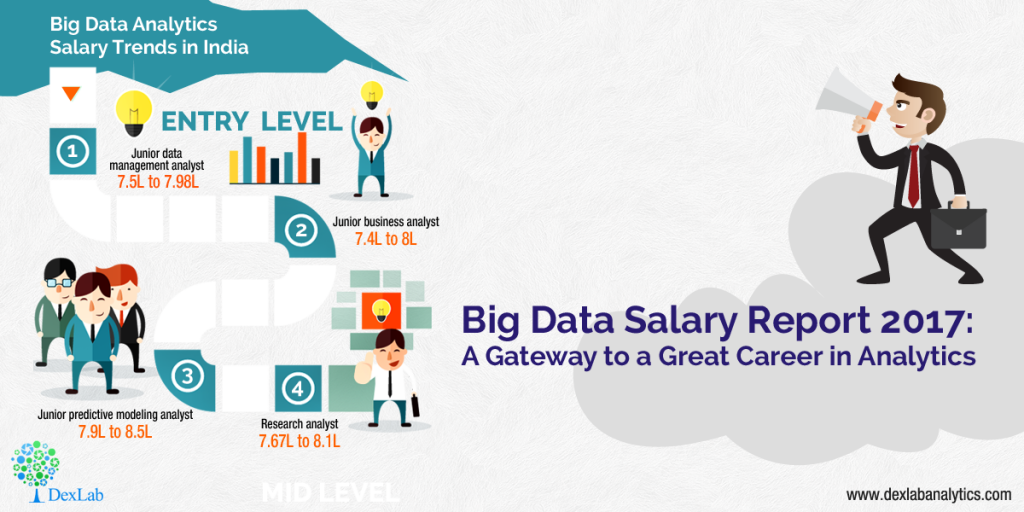
Big Data Salary Report 2017: A Gateway to a Great Career in Analytics

Big Data Salary Report 2017
 

In the US, big data engineer salaries are predicted to range between $135000 and 196000 in 2017, an increase of 5.8% from 2016 salary structure.  


In India, big data professionals are predicted to earn salaries in the range of 9.8L INR to 13.10L INR, increasing 6.4% over 2016 salary level.

Continue reading “Big Data Salary Report 2017: A Gateway to a Great Career in Analytics”

More Powerful and Soon To Be Everywhere, Here’s All You Need to Know about AI

More Powerful and Soon To Be Everywhere, Here’s All You Need to Know about AI
 

This Wednesday, at the Google I/O Keynote, there wasn’t just one major revelation, but a series of incremental improvements across several Google’s product portfolios. And the best part of the story is all the improvements are driven by discoveries in artificial intelligence – the intelligence exhibited by machines.

Continue reading “More Powerful and Soon To Be Everywhere, Here’s All You Need to Know about AI”

More Than Fifty Percent Companies Lack Required Tools and Investment for Efficient Business Analytics

More Than Fifty Percent Companies Lack Required Tools and Investment for Efficient Business Analytics

Fifty-nine percent of the companies around the world are not using Predictive Models or Advanced Analytics – says Forbes Insights/Dun & Bradstreet Study.

A recent study by Forbes Insights and Dun & Bradstreet, “Analytics Accelerates Into the Mainstream: 2017 Enterprise Analytics Study,” elucidates the ever-increasing indispensable role that analytics play in today’s business world, all the way from devising strategies to operations. The gloomy Forbes study highlights the crucial need for immediate investment, implementation and prioritization of analytics within companies.

5

The survey was carried on more than 300 senior executives in Britain, Ireland and North America and the report illuminates that the leading corporate giants need to invest more on the people, the processes they use and technologies that authorize decision support and decision automation.

Bruce Rogers, chief insights officer at Forbes Media was found quoting, “This study underlines the need for continued focus and investment,” he further added, “Without sophisticated analysis of quality data, companies risk falling behind.”

“All analytics are not created equal,” said Nipa Basu, chief analytics officer, Dun & Bradstreet.  She explained, “This report shows a critical opportunity for companies to both create a solid foundation of comprehensive business data – master data – and to utilize the right kind of advanced analytics. Those that haven’t yet begun to prioritize implementation of advanced analytics within their organizations will be playing catch-up for a long while, and may never fully recover.”


Key findings revealed:

Need for tools and best practices

Though data usage and consumption growth brags about success, little sophistication is observed in how data are analysed. Only 23% of the surveyed candidates are found to be using spreadsheets for all sorts of data work, while another 17% uses dashboards that are a little more efficient than spreadsheets.

The survey says mere 41% rely on predictive models and/or advanced analytical and forecasting techniques, and 19% of the respondents implement no analytical tools that are more complicated than fundamental data models and regressions.

Skill deficiency stalling analytics success

Twenty seven percent of respondents diagnosed with skill gaps as a major blocker between current data and analytics efforts. Fifty two percent were found to be working with third-party data vendors to tackle such lacks of skills. Moreover, 55% of the surveyed contestants said that third-party analytics partners performs better than those who works in-house, exhibiting both a shortage of analytics capabilities among in-house analysts and a dearth in skilled workers.

Investment crunch

Survey respondents ticked lack of investment and problems with technology as the top hindrances to fulfilling their data strategy goals. Despite the increasing use of data, investment in deft personnel and technology is lagging behind.

CFO’s introspect into data for careful insights

According to the survey, 63% of those who are in the financial domains shared they are using data and analytics to discover opportunities to fund business growth. Further, 60% of the survey respondents revealed they rely on data to boost long-term strategic planning.

For more interesting blogs and data-related stuffs, follow us on DexLab Analytics. We are a leading Data Science training institute in Delhi offering high-in demand Business analyst training courses in Gurgaon. Reach us today!


Interested in a career in Data Analyst?

To learn more about Data Analyst with Advanced excel course – Enrol Now.
To learn more about Data Analyst with R Course – Enrol Now.
To learn more about Big Data Course – Enrol Now.

To learn more about Machine Learning Using Python and Spark – Enrol Now.
To learn more about Data Analyst with SAS Course – Enrol Now.
To learn more about Data Analyst with Apache Spark Course – Enrol Now.
To learn more about Data Analyst with Market Risk Analytics and Modelling Course – Enrol Now.

Making Data Visualizations Smarter, Tableau Explains How

Making Data Visualizations Smarter, Tableau explains How

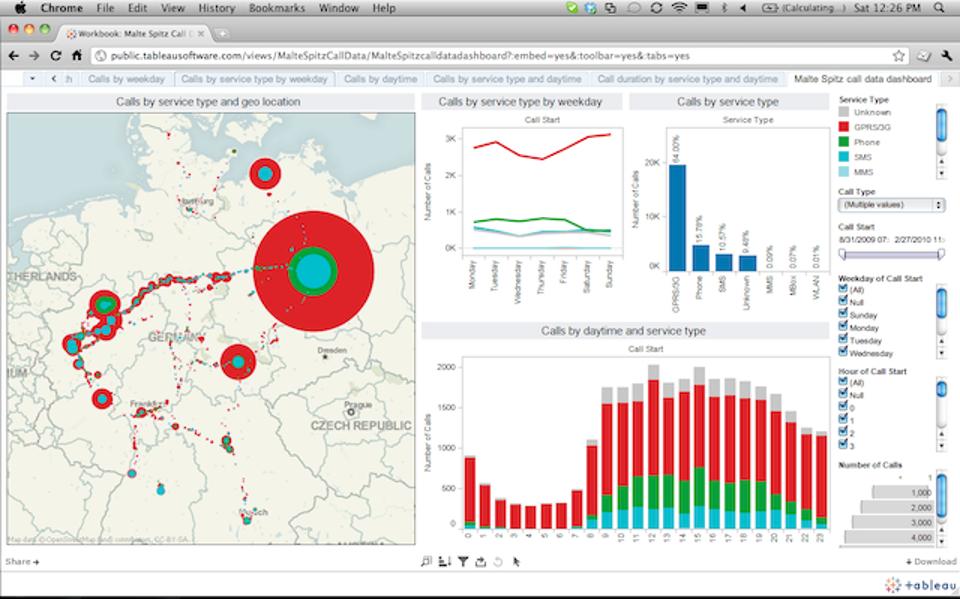
Appalling, bewildering and utterly nonsensical – data at times can look incomprehensible, especially in its raw forms. This accelerated the foundation of the data visualization company and our very own ‘business dashboard’ tool. Generally found locked within the so-called BI sphere, we can now consider these top notch graphical tools as a powerful medium of assimilating, categorizing, analyzing and then presenting data in a highly interactive and interesting form, using images and charts.

2

What images are used in a BI dashboard?

Typically, we would found scatter plots, bubble charts, heat maps, pie charts, geographical maps and of course standard tables strewn across a BI dashboard– in short, it is a real smorgasbord of visualization tools.

But a question that clogs our minds is – why do we have to use these tools? What purpose they serve? The most prominent underlying reason typically revolves around the fact that we rely more on the computing power to sail through the numbers and then feature those numbers or ‘trends’ that the human mind would have taken ages to comprehend.

From our standpoint, we humans are more comfortable with pictures than tables or numbers. Spotting a trend through visual representation makes things easier and faster as compared to their traditional counterparts.

Infusing some more intelligence

Tableau Software, a Data Visualization specialist is in its endeavour to add intelligence in its existing format by injecting new brain power in the Tableau 10.3 product release. 

Expect the following updates:

  1. Automated table and join recommendations, powered by machine learning algorithms
  2. Data driven alerts for proactive monitoring of key metrics
  3. Six new data sources are added for rapid-fire analysis

To make things easier, Tableau excels to help create data dashboard table construction USING machine learning tools – and, trust me it would be quite important as all the machine logs comes mostly from the Internet of Things (IoT).

The mechanism behind data alerts

Powered by latest data-driven alerts, users can now receive instant notifications just the moment their data crosses a pre-determined threshold, ensuring they never miss out the changes occurring within the organisation.

Francois Ajenstat, chief product officer at Tableau stated, “Tableau 10.3 makes it easy for teams to access data, wherever it resides. In all, customers can now connect to more than 75 data sources via 66 connectors, without any programming. That includes a new PDF connector, which allows people to directly import PDF tables into Tableau with just one click. With an Adobe estimated 2.5 trillion PDFs worldwide, this unlocks a new realm of data that can be leveraged for rich analysis.”

New improved Tableau is now equipped with new connectors to data sources, like ServiceNow, MongoDB, Amazon Athena, Dropbox and Microsoft OneDrive.

Is data visualization really a cure-all?

If you ask me, I would say NO, not necessarily. Just by adopting data visualization and BI tools, such as Penataho, SAP, Microsoft, TIBCO and others, it doesn’t mean everything will be good to go. Keep in mind, though the algorithms are gaining momentum and becoming super powerful, we humans are still better in identifying the nuances, quirks, outliers and absolutely unique one-offs.

As parting thoughts, Tableau is marvellous, but don’t forget your fundamental commands in mathematics, learnt at school. They’ll help you, for sure! Till then, wish you luck!
1648519ca6ff87be75a3618dce6b4497d

For Tableau training courses, rest your trust on DexLab Analytics. We are a reputable Tableau Training Institute, headquartered in Gurgaon, with a branch in Delhi.


Interested in a career in Data Analyst?

To learn more about Data Analyst with Advanced excel course – Enrol Now.
To learn more about Data Analyst with R Course – Enrol Now.
To learn more about Big Data Course – Enrol Now.

To learn more about Machine Learning Using Python and Spark – Enrol Now.
To learn more about Data Analyst with SAS Course – Enrol Now.
To learn more about Data Analyst with Apache Spark Course – Enrol Now.
To learn more about Data Analyst with Market Risk Analytics and Modelling Course – Enrol Now.
Pentagon Fights Off ISIS with Machine Learning and Big Data

Machine learning and big data are the new BIG things going around in the world. They are being used for myriad purposes – better AI, apt malware detection, smart messenger apps, and lot, lot more. Topping that, they are being utilized by the Pentagon to eradicate the foundations of Islamic State militants and make the world a safer (and better) place to live in.

 
Pentagon Fights Off ISIS with Machine Learning and Big Data
 

This May, the Pentagon announced that it is undertaking its newly minted Algorithmic Warfare Cross Functional Team (AWCFT), codenamed Project Maven, with introducing Big Data and Machine Learning to boost the process of discovering actionable intelligence with the help of aerial imagery. “We’re not going to solve it by throwing more people at the problem…That’s the last thing that we actually want to do. We want to be smarter about what we’re doing,” Air Force Lt. Gen. John N.T. “Jack” Shanahan, director for defence intelligence for war fighter support told a leading defence news magazine.

Continue reading “Pentagon Fights Off ISIS with Machine Learning and Big Data”

What Makes Tableau 10 So Desirable Among the IT Nerds

What Makes Tableau 10 So Desirable Among the IT Nerds

Your data just got better, say thanks to Tableau 10. The big data geeks have worked on both the beauty and brains of Tableau, to make the analyses easier, faster and exceptionally delightful. Tableau 10 features an exciting new look and feel, loaded with cute fonts and beautiful colours to make your viz sparkle.

We are thrilled. We have been waiting for days to gauge how some of the Tableau 10 new features will synchronise with our conventional business interface for Hadoop. We have culled out some of the best features of Tableau 10, which had made us zealous and left us buzzing. And here they are ..

An extremely visually appealing new interface

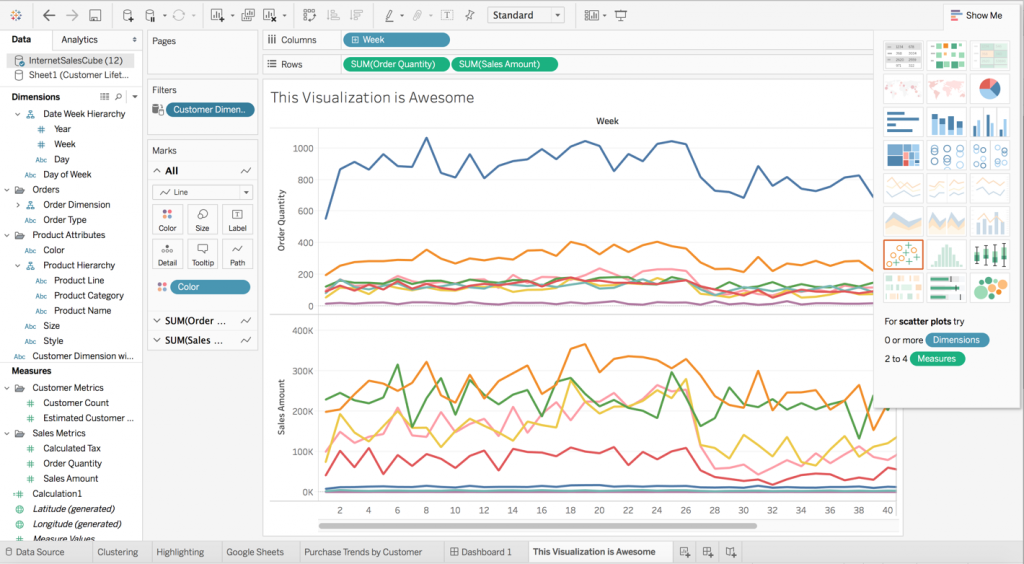
Connect the little dots to get a bigger picture. The new interface pays enough attention to minute details making the entire visualization environment pleasant and engaging.

For example: When you name a worksheet tab, the same name pops up as an inline title, blending seamlessly with the viz – now isn’t that great!

atscale1

Ten on ten to Tableau’s clustering feature

Owing to Tableau’s outstanding analytics capabilities, Tableau 10’s clustering feature is the next best thing. The feature focuses on the elements of a pool of data values and visually highlights an inconspicuous number of clusters, which is found in the data. This makes it easier for an analyst to run his eyes through the data sets they need to investigate.

Spotting the zip codes was never so easy before, come and take a look at the following video.

Tableau 10’s highlighting feature helps in finding a needle from the big data haystack

While developing interesting data visualizations, we often need to present the most comprehensive view of the data, so that the consumers get the right information they are looking for, without foraging here and there. With Tableau 10’s highlighting feature, this goal is easily achieved.

In the video shared below, we can see the weekly trend of sales and numbers of customer across the states included in the sales transaction data.

Multisource data integration and blending

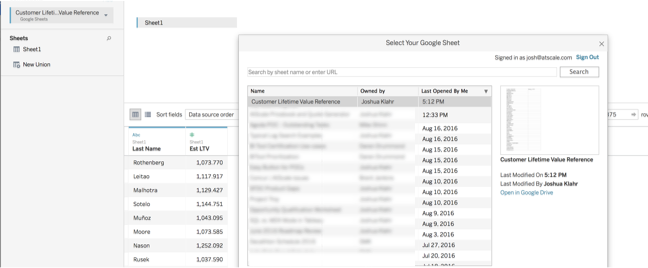
By using Tableau 10, the users will be able to directly connect to data stored in Google Sheets.

Scroll down:

atscale2 (1)

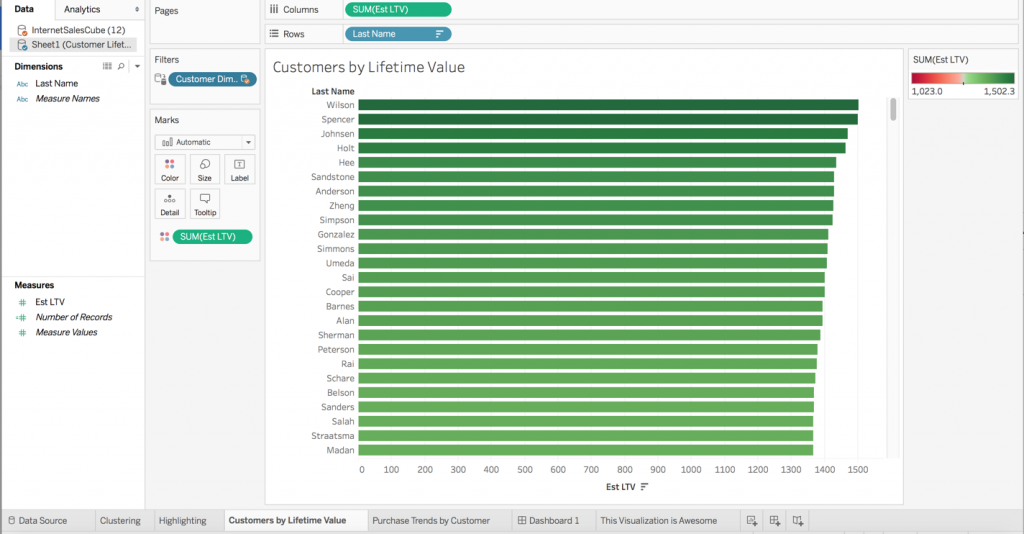
Develop visual representation of the most-favoured customers, based on estimated lifetime value.

005

Once the new data source is created, you can now use the data-relationships feature to let Tableau know that the Last Name column from the Google Sheets data set is mapped to the Customer Dimension column from my AtScale big data virtual cube.

004

Soon after the above relation has been accomplished, a filter is initiated on my Purchase Trends by Ranked Customers dashboard. Watch the video, to get a clearer picture.

These are some of the slivers of what’s new in Tableau 10. Want even more? Join DexLab Analytics for intensive Tableau Certification Training. This premier data science training institute excels in data analytics certification courses. Get interesting data knowledge and Tableau insights from the veterans!


Sources: tableau.com
 

Interested in a career in Data Analyst?

To learn more about Data Analyst with Advanced excel course – Enrol Now.
To learn more about Data Analyst with R Course – Enrol Now.
To learn more about Big Data Course – Enrol Now.

To learn more about Machine Learning Using Python and Spark – Enrol Now.
To learn more about Data Analyst with SAS Course – Enrol Now.
To learn more about Data Analyst with Apache Spark Course – Enrol Now.
To learn more about Data Analyst with Market Risk Analytics and Modelling Course – Enrol Now.

Call us to know more