online certification Archives - Page 5 of 15 - DexLab Analytics | Big Data Hadoop SAS R Analytics Predictive Modeling & Excel VBA

5 New-Age IT Skill Sets to Fetch Bigger Paychecks in 2017

Technology is the king. It is slowly intensifying its presence over workplaces, and is one of the chief reasons why companies are laying off employees. Adoption of cutting-edge technologies is believed to be the main reason of job cuts and by now if professional techies are not properly equipped with newer technologies under their sleeves, the future of human workforce seems bleaker.

 
5 New-Age IT Skill Sets to Fetch Bigger Paychecks in 2017
 

DexLab Analytics offers the best R language certification in Delhi.


A recent report says – India would lose about 69,000 jobs until 2021 due to the adoption of IoT, so do you really think human intelligence is losing its intellect? Will AI finally surpass brain power?

Continue reading “5 New-Age IT Skill Sets to Fetch Bigger Paychecks in 2017”

The Evolution of Neural Networks

The Evolution of Neural Networks

Recently, Deep Learning has gone up from just being a niche field to mainstream. Over time, its popularity has skyrocketed; it has established its position in conquering Go, learning autonomous driving, diagnosing skin cancer, autism and becoming a master art forger.

Before delving into the nuances of neural networks, it is important to learn the story of its evolution, how it came into limelight and got re-branded as Deep Learning.

The Timeline:

Warren S. McCulloch and Walter Pitts (1943): “A Logical Calculus of the Ideas Immanent in Nervous Activity”

Here, in this paper, McCulloch (neuroscientist) and Pitts (logician) tried to infer the mechanisms of the brain, producing extremely complicated patterns using numerous interconnected basic brain cells (neurons).  Accordingly, they developed a computer-programmed neural model, known as McCulloch and Pitt’s model of a neuron (MCP), based on mathematics and algorithms called threshold logic.

2

Marvin Minsky (1952) in his technical report: “A Neural-Analogue Calculator Based upon a Probability Model of Reinforcement”

Being a graduate student at Harvard University Psychological Laboratories, Minsky executed the SNARC (Stochastic Neural Analog Reinforcement Calculator). It is possibly the first artificial self-learning machine (artificial neural network), and probably the first in the field of Artificial Intelligence.

Marvin Minsky & Seymour Papert (1969): “Perceptron’s – An Introduction to Computational Geometry” (seminal book):  

In this research paper, the highlight has been the elucidation of the boundaries of a Perceptron. It is believed to have helped usher into the AI Winters – a time period of hype for AI, in which funds and publications got frozen.

Kunihiko Fukushima (1980) – “Neocognitron: A Self-organizing Neural Network Model for a Mechanism of Pattern Recognition Unaffected by Shift in Position” (this concept is an important component for Convolutional Neural Network – LeNet)

Fukushima conceptualized a whole new, much improved neural network model, known as ‘Neocognitron’. This name is derived from ‘Cognitron’, which is a self-organizing multi layered neural network model proposed by [Fukushima 1975].

David B. Parker (April 1985 & October 1985) in his technical report and invention report – “Learning – Logic”

David B. Parker reinvented Backpropagation, by giving it a new name ‘Learning Logic’. He even reported it in his technical report as well as filed an invention report.

Yann Le Cun (1988) – “A Theoretical Framework for Back-Propagation”

You can derive back-propagation through numerous ways; the simplest way is explained in Rumelhart et al. 1986. On the other hand, in Yann Le Cun 1986, you will find an alternative deviation, which mainly uses local criteria to be minimized locally.


J.S. Denker, W.R. Garner, H.P. Graf, D. Henderson, R.E. Howard, W. Hubbard, L.D. Jackel, H.S. Baird, and I. Guyon at AT&T Bell Laboratories (1989): “Neural Network Recognizer for Hand-Written ZIP Code Digits”

In this paper, you will find how a system ascertains hand-printed digits, through a combination of neural-net methods and traditional techniques. The recognition of handwritten digits is of crucial notability and of immense theoretical interest. Though the job was comparatively complicated, the results obtained are on the positive side.

Yann Le Cun, B. Boser, J.S. Denker, D. Henderson, R.E. Howard, W. Hubbard, L.D. Jackel at AT&T Bell Laboratories (1989): “Backpropagation Applied to Handwritten ZIP Code Recognition”

A very important real-world application of backpropagation (handwritten digit recognition) has been addressed in this report. Significantly, it took into account the practical need for a chief modification of neural nets to enhance modern deep learning.

Besides Deep Learning, there are other kinds of architectures, like Deep Belief Networks, Recurrent Neural Networks and Generative Adversarial Networks etc., which can be discussed later.

For comprehensive Machine Learning training Gurgaon, reach us at DexLab Analytics. We are a pioneering data science online training platform in India, bringing advanced machine learning courses to the masses.


Interested in a career in Data Analyst?

To learn more about Data Analyst with Advanced excel course – Enrol Now.
To learn more about Data Analyst with R Course – Enrol Now.
To learn more about Big Data Course – Enrol Now.

To learn more about Machine Learning Using Python and Spark – Enrol Now.
To learn more about Data Analyst with SAS Course – Enrol Now.
To learn more about Data Analyst with Apache Spark Course – Enrol Now.
To learn more about Data Analyst with Market Risk Analytics and Modelling Course – Enrol Now.

The Timeline of Artificial Intelligence and Robotics

The Timeline of Artificial Intelligence and Robotics

Cities have been constructed sprawling over the miles, heaven-piercing skyscrapers have been built, mountains have been cut across to make way for tunnels, and rivers have been redirected to erect massive dams – in less than 250 years, we propelled from primitive horse-drawn carts to autonomous cars run on highly integrated GPS systems, all because of state-of-the-art technological innovation. The internet has transformed all our lives, forever. Be it artificial intelligence or Internet of Things, they have shaped our society and amplified the pace of high-tech breakthroughs.

One of the most significant and influential developments in the field of technology is the notion of artificial intelligence. Dating back to the 5th century BC, when Greek myths of Hephaestus incorporate the idea of robots, though it couldn’t be executed till the Second World War II, artificial intelligence has indeed come a long way.


Come and take a look at this infographic blog to view the timeline of Artificial Intelligence:


Evolution of Artificial Intelligence Over the Ages from Infographics


In the near future, AI will become a massive sector brimming with promising financial opportunities and unabashed technological superiority. To find out more about AI and how it is going to impact our lives, read our blogs published at DexLab Analytics. We offer excellent Machine Learning training in Gurgaon for aspiring candidates, who want to know more about Machine Learning using Python.


Interested in a career in Data Analyst?

To learn more about Data Analyst with Advanced excel course – Enrol Now.
To learn more about Data Analyst with R Course – Enrol Now.
To learn more about Big Data Course – Enrol Now.

To learn more about Machine Learning Using Python and Spark – Enrol Now.
To learn more about Data Analyst with SAS Course – Enrol Now.
To learn more about Data Analyst with Apache Spark Course – Enrol Now.
To learn more about Data Analyst with Market Risk Analytics and Modelling Course – Enrol Now.

The ABC of Summary Statistics and T Tests in SAS

The ABC of Summary Statistics and T Tests in SAS

Getting introduced to statistics for SAS training? Then, you must know how to create summary statistics (such as sample size, mean, and standard deviation) to test hypotheses and to figure confidence intervals. In this blog, we will show you how to furnish summary statistics (instead of raw data) to PROC TTEST in SAS, how to develop a data set that includes summary statistics and how to run PROC TTEST to calculate a two-sample or one-sample t test for the mean.

So, let’s start!

2

Running a two-sample t test for difference of means from summarized statistics

Instead of going the clichéd way, we will start with establishing a comparison between the mean heights of 19 students, based on gender – the data is held in the Sashelp class data set.

Observe the below SAS statements that sorts the data by the grouping variable, calling PROC MEANS and printing a subset of the statistics:

proc sort data=sashelp.class out=class; 
   by sex;                                /* sort by group variable */
run;
proc means data=class noprint;           /* compute summary statistics by group */
   by sex;                               /* group variable */
   var height;                           /* analysis variable */
   output out=SummaryStats;              /* write statistics to data set */
run;
proc print data=SummaryStats label noobs; 
   where _STAT_ in ("N", "MEAN", "STD");
   var Sex _STAT_ Height;
run;

summarystats1

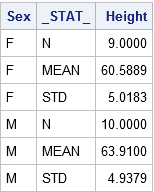
The table reflects the structure of the Summary Stats set for two sample tests. The two samples used here are differentiated on the levels of the Sex Variable (‘F’ for females and ‘M’ for males). The _STAT_ column shows the name of the statistic implemented here. The Height column depicts the value of the statistics for individual group.

Get SAS certification Delhi from DexLab Analytics today!

The problem: The heights of sixth-grade students are normally distributed. Random samples of n1=9 females and n2=10 males are selected. The mean height of the female sample is m1=60.5889 with a standard deviation of s1=5.0183. The mean height of the male sample is m2=63.9100 with a standard deviation of s2=4.9379. Is there evidence that the mean height of sixth-grade students depends on gender?

Here, you have to do nothing special to get the PROC TTEST – whenever the procedure gets the sight of the respective variable _STAT_ and any unique values, the procedure understands that the data set comprises summarized statistics. The following representation compares the mean heights of males and females:

proc ttest data=SummaryStats order=data
           alpha=0.05 test=diff sides=2; /* two-sided test of diff between group means */
   class sex;
   var height;
run;

summarystats1

Check the confidence intervals for the standard deviations and also that the output includes 95% confidence intervals for group means.

In the second table, the ‘Pooled’ row radiates out the impression that both the variances of two groups are more or less equal, which is somewhat true even. The value of the t statistic is t = -1.45 with a two-sided p-value of 0.1645.

The syntax for the PROC TTEST statement allows you to change the type of hypothesis test and the significance level. To support this, you can now run a one-sided test for the alternative hypothesis μ1 < μ2 at the 0.10 significance level just by using:

proc ttest ... alpha=0.10 test=diff sides=L;  /* Left-tailed test */

Running a one-sample t test of the mean from summarized statistics

In the above section, you have learnt to create the summary statistics from PROC MEANS. Nevertheless, you can also generate the summary statistic manually, if you lack original data.

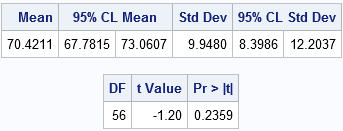
The problem: A research study measured the pulse rates of 57 college men and found a mean pulse rate of 70.4211 beats per minute with a standard deviation of 9.9480 beats per minute. Researchers want to know if the mean pulse rate for all college men is different from the current standard of 72 beats per minute.

The following statements jots down the summary statistics for a data set, asks PROC TTEST to perform a one-sample test of the null hypothesis μ = 72 against a two-sided alternative hypothesis:

data SummaryStats;
  infile datalines dsd truncover;
  input _STAT_:$8. X;
datalines;
N, 57
MEAN, 70.4211
STD, 9.9480
;
 
proc ttest data=SummaryStats alpha=0.05 H0=72 sides=2; /* H0: mu=72 vs two-sided alternative */
   var X;
run;

summarystats3 (2)

The outcome is a 95% confidence interval for the mean containing a value 72. The value of the t statistic is t = -1.20, which corresponds to a p-value of 0.2359. Therefore, the data fails in rejecting the null hypothesis at the 0.05 significance level.

For more informative blogs and news about SAS course, drop by our prime SAS predictive modeling training institute DexLab Analytics.

 
This post originally appeared onblogs.sas.com/content/iml/2017/07/03/summary-statistics-t-tests-sas.html
 

Interested in a career in Data Analyst?

To learn more about Data Analyst with Advanced excel course – Enrol Now.
To learn more about Data Analyst with R Course – Enrol Now.
To learn more about Big Data Course – Enrol Now.

To learn more about Machine Learning Using Python and Spark – Enrol Now.
To learn more about Data Analyst with SAS Course – Enrol Now.
To learn more about Data Analyst with Apache Spark Course – Enrol Now.
To learn more about Data Analyst with Market Risk Analytics and Modelling Course – Enrol Now.

Google Is All Set to Wipe Off Artificial Stupidity

Google Is All Set to Wipe Off Artificial Stupidity

Well, human-AI relation needs to improve. Amazon’s Alexa personal assistant is operating in one of the world’s largest online stores and deserves accolade as it pulls out information from Wikipedia. But what if it can’t play that rad pop banger you just heard and responds saying “I’m sorry, I don’t understand the question,”!! Disappointing, right?

All revered digital helpmates including Google’s Google Assistant and Apple’s Siri are capable of producing frustrating coups that can feel like artificial stupidity. Against this, Google has decided to start a new research push to realize and improve the existing relations between humans and AI. PAIR, for People + AI Research initiative was announced this Monday, and it would be shepherded by two data viz crackerjacks, Fernanda Viégas and Martin Wattenberg.

104476359-google-assistant-5.530x298

Get Machine Learning Certification today. DexLab Analytics is here to provide encompassing Machine Learning courses.

Virtual assistants don’t like to be defeated – they get infuriated when they fail to perform a given task. In this context, Viégas says she is keen to study how people outline expectations regarding what systems can and cannot outperform a command – which is to say how virtual assistants should be designed to prick us toward only asking things that it can perform, leaving no room for disappointment.

Making Artificial Intelligence more transparent among people and not just professionals is going to be a major initiative of PAIR. It also released two open source tools to help data scientists grasp the data they are feeding into the Machine Learning systems. Interesting, isn’t it?

The deep learning programs that have recently gained a lot of appreciation in analyzing our personal data or diagnosing life-threatening diseases is of late said to be dubbed as ‘black boxes’ by polemicist researchers, meaning it can be trickier to observe why a system churn out a specific decision, like a diagnosis. So, here lies the problem. In life and death situations inside clinics, or on-road, while driving autonomous vehicles, these faulty algorithms may pose potent risks. Viégas says “The doctor needs to have some sense of what’s happening and why they got a recommendation or prediction.”

Googleplex-Google-Logo-AH-6

Google’s project comes at a time when the human consequences of AI are being questioned the most. Recently, the Ethics and Governance of Artificial Intelligence Fund in association with the Knight Foundation and LinkedIn cofounder Reid Hoffman declared $7.6 million in grants to civil society organizations to review the changes AI is going to cause in labor markets and criminal justice structures. Similarly, Google announces most of PAIR’s work will take place in the open. MIT and Harvard professors Hal Abelson and Brendan Meade are going to join forces with PAIR to study how AI can improve education and science.

google_io_2017_ai_1499777827549

Closing Thoughts – If PAIR can integrate AI seamlessly into prime industries, like healthcare, it would definitely shape roads for new customers to reach Google’s AI-centric cloud business destination. Viégas reveals she will also like to work closely with Google’s product teams, like the ones responsible for developing Google Assistant. According to her, such collaborations are great and comes with an added advantage, as it keeps people hooked to the product, resulting in broader company services. PAIR is a necessary shot to not only help push the society to understand what’s going on between humans and AI but also to boost Google’s bottom line.

DexLab Analytics is your gateway to great career in data analytics. Enroll in a Machine Learning course online and ride on.


Interested in a career in Data Analyst?

To learn more about Data Analyst with Advanced excel course – Enrol Now.
To learn more about Data Analyst with R Course – Enrol Now.
To learn more about Big Data Course – Enrol Now.

To learn more about Machine Learning Using Python and Spark – Enrol Now.
To learn more about Data Analyst with SAS Course – Enrol Now.
To learn more about Data Analyst with Apache Spark Course – Enrol Now.
To learn more about Data Analyst with Market Risk Analytics and Modelling Course – Enrol Now.

Let’s Make Visualizations Better In Python with Matplotlib

Let’s Make Visualizations Better In Python with Matplotlib

Learn the basics of effective graphic designing and create pretty-looking plots, using matplotlib. In fact, not only matplotlib, I will try to give meaningful insights about R/ggplot2, Matlab, Excel, and any other graphing tool you use, that will help you grasp the concepts of graphic designing better.

Simplicity is the ultimate sophistication

To begin with, make sure you remember– less is more, when it is about plotting. Neophyte graphic designers sometimes think that by adding a visually appealing semi-related picture on the background of data visualization, they will make the presentation look better but eventually they are wrong. If not this, then they may also fall prey to less-influential graphic designing flaws, like using a little more of chartjunk.


Data always look better naked. Try to strip it down, instead of adorning it.

Have a look at the following GIF:

“Perfection is achieved not when there is nothing more to add, but when there is nothing left to take away.” – Antoine de Saint-Exupery explained it the best.

Color rules the world

The default color configuration of Matlab is quite awful. Matlab/matplotlib stalwarts may find the colors not that ugly, but it’s undeniable that Tableau’s default color configuration is way better than Matplotlib’s.

Get Tableau certification Pune today! DexLab Analytics offers Tableau BI training courses to the aspiring candidates.

Make use of established default color schemes from leading software that is famous for offering gorgeous plots. Tableau is here with its incredible set of color schemes, right from grayscale and colored to colorblind friendly.

A plenty of graphic designers forget paying heed to the issue of color blindness, which encompasses over 5% of the graphic viewers. For example, if a person suffers from red-green color blindness, it will be completely indecipherable for him to understand the difference between the two categories depicted by red and green plots. So, how will he work then?


For them, it is better to rely upon colorblind friendly color configurations, like Tableau’s “Color Blind 10”.


To run the codes, you need to install the following Python libraries:


  1. Matplotlib
  2. Pandas


Now that we are done with the fundamentals, let’s get started with the coding.
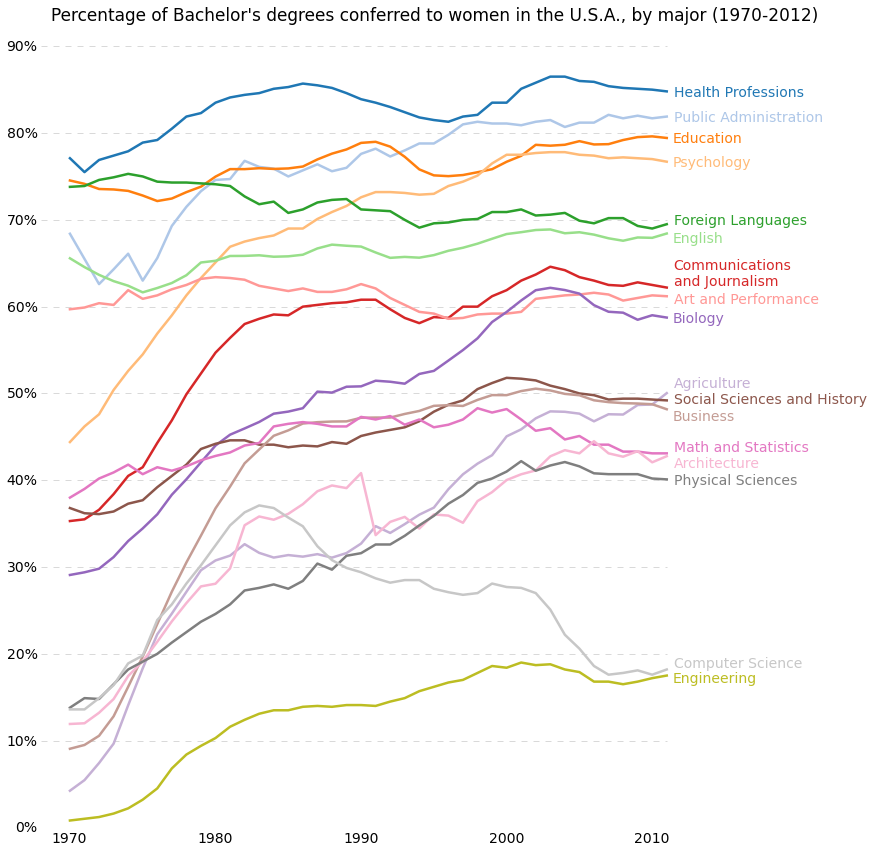
 

percent-bachelors-degrees-women-usa


import matplotlib.pyplot as plt
import pandas as pd

# Read the data into a pandas DataFrame.  
gender_degree_data = pd.read_csv("http://www.randalolson.com/wp-content/uploads/percent-bachelors-degrees-women-usa.csv")  

# These are the "Tableau 20" colors as RGB.  
tableau20 = [(31, 119, 180), (174, 199, 232), (255, 127, 14), (255, 187, 120),  
             (44, 160, 44), (152, 223, 138), (214, 39, 40), (255, 152, 150),  
             (148, 103, 189), (197, 176, 213), (140, 86, 75), (196, 156, 148),  
             (227, 119, 194), (247, 182, 210), (127, 127, 127), (199, 199, 199),  
             (188, 189, 34), (219, 219, 141), (23, 190, 207), (158, 218, 229)]  

# Scale the RGB values to the [0, 1] range, which is the format matplotlib accepts.  
for i in range(len(tableau20)):  
    r, g, b = tableau20[i]  
    tableau20[i] = (r / 255., g / 255., b / 255.)  

# You typically want your plot to be ~1.33x wider than tall. This plot is a rare  
# exception because of the number of lines being plotted on it.  
# Common sizes: (10, 7.5) and (12, 9)  
plt.figure(figsize=(12, 14))  

# Remove the plot frame lines. They are unnecessary chartjunk.  
ax = plt.subplot(111)  
ax.spines["top"].set_visible(False)  
ax.spines["bottom"].set_visible(False)  
ax.spines["right"].set_visible(False)  
ax.spines["left"].set_visible(False)  

# Ensure that the axis ticks only show up on the bottom and left of the plot.  
# Ticks on the right and top of the plot are generally unnecessary chartjunk.  
ax.get_xaxis().tick_bottom()  
ax.get_yaxis().tick_left()  

# Limit the range of the plot to only where the data is.  
# Avoid unnecessary whitespace.  
plt.ylim(0, 90)  
plt.xlim(1968, 2014)  

# Make sure your axis ticks are large enough to be easily read.  
# You don't want your viewers squinting to read your plot.  
plt.yticks(range(0, 91, 10), [str(x) + "%" for x in range(0, 91, 10)], fontsize=14)  
plt.xticks(fontsize=14)  

# Provide tick lines across the plot to help your viewers trace along  
# the axis ticks. Make sure that the lines are light and small so they  
# don't obscure the primary data lines.  
for y in range(10, 91, 10):  
    plt.plot(range(1968, 2012), [y] * len(range(1968, 2012)), "--", lw=0.5, color="black", alpha=0.3)  

# Remove the tick marks; they are unnecessary with the tick lines we just plotted.  
plt.tick_params(axis="both", which="both", bottom="off", top="off",  
                labelbottom="on", left="off", right="off", labelleft="on")  

# Now that the plot is prepared, it's time to actually plot the data!  
# Note that I plotted the majors in order of the highest % in the final year.  
majors = ['Health Professions', 'Public Administration', 'Education', 'Psychology',  
          'Foreign Languages', 'English', 'Communications\nand Journalism',  
          'Art and Performance', 'Biology', 'Agriculture',  
          'Social Sciences and History', 'Business', 'Math and Statistics',  
          'Architecture', 'Physical Sciences', 'Computer Science',  
          'Engineering']  

for rank, column in enumerate(majors):  
    # Plot each line separately with its own color, using the Tableau 20  
    # color set in order.  
    plt.plot(gender_degree_data.Year.values,  
            gender_degree_data[column.replace("\n", " ")].values,  
            lw=2.5, color=tableau20[rank])  

    # Add a text label to the right end of every line. Most of the code below  
    # is adding specific offsets y position because some labels overlapped.  
    y_pos = gender_degree_data[column.replace("\n", " ")].values[-1] - 0.5  
    if column == "Foreign Languages":  
        y_pos += 0.5  
    elif column == "English":  
        y_pos -= 0.5  
    elif column == "Communications\nand Journalism":  
        y_pos += 0.75  
    elif column == "Art and Performance":  
        y_pos -= 0.25  
    elif column == "Agriculture":  
        y_pos += 1.25  
    elif column == "Social Sciences and History":  
        y_pos += 0.25  
    elif column == "Business":  
        y_pos -= 0.75  
    elif column == "Math and Statistics":  
        y_pos += 0.75  
    elif column == "Architecture":  
        y_pos -= 0.75  
    elif column == "Computer Science":  
        y_pos += 0.75  
    elif column == "Engineering":  
        y_pos -= 0.25  

    # Again, make sure that all labels are large enough to be easily read  
    # by the viewer.  
    plt.text(2011.5, y_pos, column, fontsize=14, color=tableau20[rank])  

# matplotlib's title() call centers the title on the plot, but not the graph,  
# so I used the text() call to customize where the title goes.  

# Make the title big enough so it spans the entire plot, but don't make it  
# so big that it requires two lines to show.  

# Note that if the title is descriptive enough, it is unnecessary to include  
# axis labels; they are self-evident, in this plot's case.  
plt.text(1995, 93, "Percentage of Bachelor's degrees conferred to women in the U.S.A."  
       ", by major (1970-2012)", fontsize=17, ha="center")  

# Always include your data source(s) and copyright notice! And for your  
# data sources, tell your viewers exactly where the data came from,  
# preferably with a direct link to the data. Just telling your viewers  
# that you used data from the "U.S. Census Bureau" is completely useless:  
# the U.S. Census Bureau provides all kinds of data, so how are your  
# viewers supposed to know which data set you used?  
plt.text(1966, -8, "Data source: nces.ed.gov/programs/digest/2013menu_tables.asp"  
       "\nAuthor: Randy Olson (randalolson.com / @randal_olson)"  
       "\nNote: Some majors are missing because the historical data "  
       "is not available for them", fontsize=10)  

# Finally, save the figure as a PNG.  
# You can also save it as a PDF, JPEG, etc.  
# Just change the file extension in this call.  
# bbox_inches="tight" removes all the extra whitespace on the edges of your plot.  
plt.savefig("percent-bachelors-degrees-women-usa.png", bbox_inches="tight")
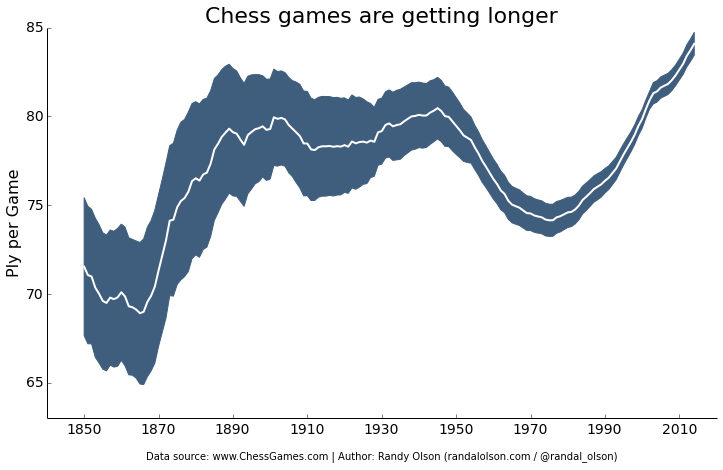
 

chess-number-ply-over-time
 

import pandas as pd
import matplotlib.pyplot as plt
from scipy.stats import sem

# This function takes an array of numbers and smoothes them out.
# Smoothing is useful for making plots a little easier to read.
def sliding_mean(data_array, window=5):
    data_array = array(data_array)
    new_list = []
    for i in range(len(data_array)):
        indices = range(max(i - window + 1, 0),
                        min(i + window + 1, len(data_array)))
        avg = 0
        for j in indices:
            avg += data_array[j]
        avg /= float(len(indices))
        new_list.append(avg)
        
    return array(new_list)

# Due to an agreement with the ChessGames.com admin, I cannot make the data
# for this plot publicly available. This function reads in and parses the
# chess data set into a tabulated pandas DataFrame.
chess_data = read_chess_data()

# These variables are where we put the years (x-axis), means (y-axis), and error bar values.
# We could just as easily replace the means with medians,
# and standard errors (SEMs) with standard deviations (STDs).
years = chess_data.groupby("Year").PlyCount.mean().keys()
mean_PlyCount = sliding_mean(chess_data.groupby("Year").PlyCount.mean().values,
                             window=10)
sem_PlyCount = sliding_mean(chess_data.groupby("Year").PlyCount.apply(sem).mul(1.96).values,
                            window=10)

# You typically want your plot to be ~1.33x wider than tall.
# Common sizes: (10, 7.5) and (12, 9)
plt.figure(figsize=(12, 9))

# Remove the plot frame lines. They are unnecessary chartjunk.
ax = plt.subplot(111)
ax.spines["top"].set_visible(False)
ax.spines["right"].set_visible(False)

# Ensure that the axis ticks only show up on the bottom and left of the plot.
# Ticks on the right and top of the plot are generally unnecessary chartjunk.
ax.get_xaxis().tick_bottom()
ax.get_yaxis().tick_left()

# Limit the range of the plot to only where the data is.
# Avoid unnecessary whitespace.
plt.ylim(63, 85)

# Make sure your axis ticks are large enough to be easily read.
# You don't want your viewers squinting to read your plot.
plt.xticks(range(1850, 2011, 20), fontsize=14)
plt.yticks(range(65, 86, 5), fontsize=14)

# Along the same vein, make sure your axis labels are large
# enough to be easily read as well. Make them slightly larger
# than your axis tick labels so they stand out.
plt.ylabel("Ply per Game", fontsize=16)

# Use matplotlib's fill_between() call to create error bars.
# Use the dark blue "#3F5D7D" as a nice fill color.
plt.fill_between(years, mean_PlyCount - sem_PlyCount,
                 mean_PlyCount + sem_PlyCount, color="#3F5D7D")

# Plot the means as a white line in between the error bars. 
# White stands out best against the dark blue.
plt.plot(years, mean_PlyCount, color="white", lw=2)

# Make the title big enough so it spans the entire plot, but don't make it
# so big that it requires two lines to show.
plt.title("Chess games are getting longer", fontsize=22)

# Always include your data source(s) and copyright notice! And for your
# data sources, tell your viewers exactly where the data came from,
# preferably with a direct link to the data. Just telling your viewers
# that you used data from the "U.S. Census Bureau" is completely useless:
# the U.S. Census Bureau provides all kinds of data, so how are your
# viewers supposed to know which data set you used?
plt.xlabel("\nData source: www.ChessGames.com | "
           "Author: Randy Olson (randalolson.com / @randal_olson)", fontsize=10)

# Finally, save the figure as a PNG.
# You can also save it as a PDF, JPEG, etc.
# Just change the file extension in this call.
# bbox_inches="tight" removes all the extra whitespace on the edges of your plot.
plt.savefig("chess-number-ply-over-time.png", bbox_inches="tight");

Histograms
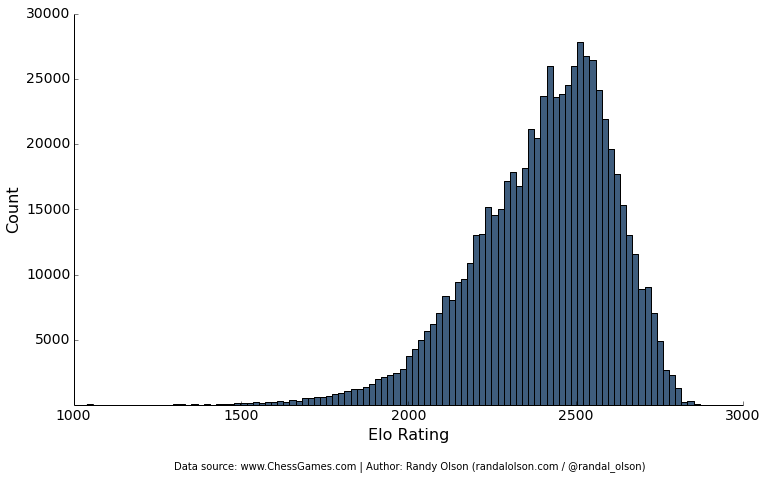
 
chess-elo-rating-distribution


import pandas as pd
import matplotlib.pyplot as plt

# Due to an agreement with the ChessGames.com admin, I cannot make the data
# for this plot publicly available. This function reads in and parses the
# chess data set into a tabulated pandas DataFrame.
chess_data = read_chess_data()

# You typically want your plot to be ~1.33x wider than tall.
# Common sizes: (10, 7.5) and (12, 9)
plt.figure(figsize=(12, 9))

# Remove the plot frame lines. They are unnecessary chartjunk.
ax = plt.subplot(111)
ax.spines["top"].set_visible(False)
ax.spines["right"].set_visible(False)

# Ensure that the axis ticks only show up on the bottom and left of the plot.
# Ticks on the right and top of the plot are generally unnecessary chartjunk.
ax.get_xaxis().tick_bottom()
ax.get_yaxis().tick_left()

# Make sure your axis ticks are large enough to be easily read.
# You don't want your viewers squinting to read your plot.
plt.xticks(fontsize=14)
plt.yticks(range(5000, 30001, 5000), fontsize=14)

# Along the same vein, make sure your axis labels are large
# enough to be easily read as well. Make them slightly larger
# than your axis tick labels so they stand out.
plt.xlabel("Elo Rating", fontsize=16)
plt.ylabel("Count", fontsize=16)

# Plot the histogram. Note that all I'm passing here is a list of numbers.
# matplotlib automatically counts and bins the frequencies for us.
# "#3F5D7D" is the nice dark blue color.
# Make sure the data is sorted into enough bins so you can see the distribution.
plt.hist(list(chess_data.WhiteElo.values) + list(chess_data.BlackElo.values),
         color="#3F5D7D", bins=100)

# Always include your data source(s) and copyright notice! And for your
# data sources, tell your viewers exactly where the data came from,
# preferably with a direct link to the data. Just telling your viewers
# that you used data from the "U.S. Census Bureau" is completely useless:
# the U.S. Census Bureau provides all kinds of data, so how are your
# viewers supposed to know which data set you used?
plt.text(1300, -5000, "Data source: www.ChessGames.com | "
         "Author: Randy Olson (randalolson.com / @randal_olson)", fontsize=10)

# Finally, save the figure as a PNG.
# You can also save it as a PDF, JPEG, etc.
# Just change the file extension in this call.
# bbox_inches="tight" removes all the extra whitespace on the edges of your plot.
plt.savefig("chess-elo-rating-distribution.png", bbox_inches="tight");

Here Goes the Bonus

It takes one more line of code to transform your matplotlib into a phenomenal interactive.


Learn more such tutorials only at DexLab Analytics. We make data visualizations easier by providing excellent Python courses in India. In just few months, you will cover advanced topics and more, which will help you make a career in data analytics.


Interested in a career in Data Analyst?

To learn more about Machine Learning Using Python and Spark – click here.
To learn more about Data Analyst with Advanced excel course – click here.
To learn more about Data Analyst with SAS Course – click here.
To learn more about Data Analyst with R Course – click here.
To learn more about Big Data Course – click here.

Top 4 Best Big Data Jobs to Look For in 2017

Data is now produced at an incredible rate – right from online shopping to browsing through social media platforms to navigating through GPS-enabled smartphones, data is being accessed everywhere. Big Data professionals now fathom the enormous business opportunities by perusing petabytes of data, which was impossible to grasp previously. Organizations are taking the best advantage of this situation and rushing to make the best of these revelations about.

 
Top-4-Best-Big-Data-Jobs-to-Look-For-in-2017
 

Big data courses are now available in India. DexLab Analytics is the one providing such advanced Big Data Hadoop certification in Gurgaon.

Continue reading “Top 4 Best Big Data Jobs to Look For in 2017”

Move Your Career towards Big Data Analytics: The Future Looks Bright

Move Your Career towards Big Data Analytics: The Future Looks Bright

With state-of-the-art technology looming on the horizon, the $150-billion Indian IT industry has a high appetite for workers accomplished in the fields, like AI, Data Science, Big Data, and more.

Soon, it wouldn’t be enough to flash an engineering degree or some minor knowledge in Java or Python – the need for data science and artificial intelligence is on the rise. Automation is going to be the key to change. Globally, 12% of employers have started thinking of downsizing their workforce owing to technological advancement. Amidst all this, don’t think India would be spared. Indian bosses fear automation will reduce their headcount too. But fret not, it’s not all a bad news – there is always a silver lining after rains and that is Big Data jobs.

2

Shine bright with Big Data

In India, the number of job openings in the Analytics field almost doubled from the last year. Digital natives, like Amazon, Citi, HCL, IBM, and Accenture are waiting to fill close to 50000 positions, according to a study conducted by Analytics India Magazine and Edvancer. All these definitely signify parting off the dark clouds, and I can’t agree more!

1494790911-4425

Artificial Intelligence and Machine Learning are building a base of its own. Moreover, AI is deemed to be the hottest technical sector in the next 5 years and would beam in success. Along with top-of-the-line tech firms, more than 170 startups have transfixed their gaze on this field. To surf on the next wave of IT jobs, candidates need to step aside from low-in-demand stale skills to excel on budding Analytics skills. Every single HR Manager out there is seeking professionals who can manipulate algorithms and work wonders in various machine-learning models and you can be one of them!

Get better, get evolved

Expertise in languages, like Java/C/C++ gives you a certain edge, but to enter the dominating field of Big Data, techies will be asked to master intricate languages, such as Scala and Hive that are less conventional. Millennial recruiters are also looking out for those who have a keen insight for good design and flawless code architecture. “Programmers who focus on good design principals are always preferred over programmers who can just code,” Rajat Vashishta, founder of Falcon Minds, a resume consulting firm, says. “User experience matters a lot more than it used to, say, five years ago.”100793293-102628471r.1910x1000

Where skills in technology, like business intelligence, artificial intelligence, machine learning and DevOps are flourishing, minute attention need to be given on proper implementation of these skills, according to Aditya Narayan Mishra, chief executive officer of CIEL HR Services, a recruitment firm, otherwise all of it would be a total waste.

It’s all in the layout

Presentation matters, you agree or not! Make your resume ready to strike the job criteria you are applying for. For example, if a user interface developer wants to become a full stack developer, he must mention back-end programming skills in the profile. This will give an instant boost to the resume. The design of a resume has also changed over the years. Now, the shorter your resume the better response you get. “Most techies write pages and pages of projects in their resumes. While it is important, in most cases, the same information gets repeated. Anything above two pages is a big no,” says Vashishta.

Feel free to get in touch with our in-house experts for a data analyst course at DexLab Analytics, the premier platform for Data Science Online training in Noida.


Interested in a career in Data Analyst?

To learn more about Data Analyst with Advanced excel course – Enrol Now.
To learn more about Data Analyst with R Course – Enrol Now.
To learn more about Big Data Course – Enrol Now.

To learn more about Machine Learning Using Python and Spark – Enrol Now.
To learn more about Data Analyst with SAS Course – Enrol Now.
To learn more about Data Analyst with Apache Spark Course – Enrol Now.
To learn more about Data Analyst with Market Risk Analytics and Modelling Course – Enrol Now.

The Big Boost in Big Data Jobs in 2017: What the Study Suggests

Big Data is the new big name in the present tech industry. Day by day, it is burgeoning and becoming capacious for companies, including corporate, SMBs and budding startups. It is also the major reason for better opportunities for people, who want to explore newer career realms across sectors, such as healthcare, banking, education, government, retail and manufacturing.


The Big Boost in Big Data Jobs in 2017: What the Study Suggests


The current IT industry is passing through a jinxed phase, where a lot of layoff fears are on the airwaves but the field of analytics remains largely unaffected. In fact, the number of analytics jobs in the past one year has nearly doubled, as per a report by Analytics India Magazine – a platform for big data, analytics and data science and Edvancer Eduventures – an online analytics training institute. The Analytics & Data Science India Jobs Study 2017 has predicted nearly 50000 positions related to analytics are at present available to be filled in India.

Continue reading “The Big Boost in Big Data Jobs in 2017: What the Study Suggests”

Call us to know more