Google is strengthening its artificial intelligence base, including China.
And it is so doing by establishing a new AI research center in Beijing. Google is digging deep into China, where it contravened the government in 2010 committing a spectacularly principled act of self-sabotage by refusing to self-censor search content and later found most of its services to be blocked. The company’s decision to return back to China is more about safeguarding its future, and acknowledging the supreme importance of technology’s most competitive field: AI.
In marketing, the analysis of data is a highly established one but the marketers nowadays have a massive amount of public and proprietary data about the preferences, usage, and behavior of a customer. The term ‘big data’ points out to this data explosion and the capability to use the data insights to make informed decisions. Understanding the potential of big data presents various technical challenges but it also needs executive talent devoted to applying the solutions of big data. Today, the marketers are widely embracing big data and are confident in their use of analytics tools and techniques. Let us learn about the ways in which Big data and analytics can improve the marketing efforts of various businesses around the around.
Locating Prospective Customers
Previously, marketers had to frequently make guesses as to which sector of population comes under their ideal market segment but this is no longer the scenario today. The companies can exactly see who is buying and even extract more details about them with the help of big data. The other details include which buttons they generally click while on a website, which websites they visit frequently, and which social media channels they utilize.
Tracking Impact and ROI
Many retailers have introduced loyalty card systems that track the purchases of a customer, but these systems can also track which promotions and incentives are most effective in encouraging a group of customers or a single customer to make another purchase.
Handling Marketing Budgets
Because big data allows companies to optimize and monitor their marketing campaigns for performance, this implies they can allocate their budget for marketing for the highest return-on-investment (ROI).
Personalizing Offers in Real-Time
Marketers can personalize their offers to customers in real time with the combination of big data and machine learning algorithms. Think about the Amazon’s “customers also bought” section or the recommended list of TV shows and movies from Netflix. The organizations can personalize what promotions and products a particular customer views, even down to sending personalized offers and coupons to the mobile phone of a customer when he walks into a physical location. The role of Personalized Merchandising in the ecommerce industry will continue to increase in the years to come.
Improvement in Market Research
Companies can conduct quantitative and qualitative market research much more inexpensively and quickly than ever before. The tools for online survey mean that customer feedback and focus groups are inexpensive and easy to implement, and data analytics make the results easier to take action.
Prediction of Buyer Behavior and Sales
For the past several years, sales teams, in order to rate their hottest leads, have made use of lead scoring. But, with the help of predictive analytics, a model can be generated and it can successfully predict sales and buyer behavior.
Enhanced Content Marketing
Previously, the return-on-investment for a blog post used to be highly difficult to measure. But, with the help of big data and analytics, the marketers can effortlessly analyze which pieces of content are highly effective at moving leads via a sales and marketing funnel. Even a small firm can afford to use tools for implementing content scoring which can highlight the content pieces that are highly responsible for closing sales.
Optimize Customer Engagement
Data can provide more information about your customers which includes who they are, what they want, where they are, how often they purchase on your site, and how, when they prefer to be contacted, and various other major factors. The organizations can also examine how users interact not only with their website, but also their physical store to enhance the experience of the user.
Tracking Competitors
New tools for social monitoring have made it easy to gather and examine data about the competitors and their efforts regarding marketing as well. The organizations that can utilize this data will have a distinct competitive advantage.
Managing Reputation
With the help of big data, organizations can monitor their brand mentions very easily across different social channels and websites to locate unfiltered testimonials, reviews, and opinions about their company and products. The savviest can also utilize social media to offer service to the customers and create a trustworthy brand presence.
Marketing Optimization
It is quite difficult to track direct ROI and impact with traditional advertising. But, big data can help organizations to make optimal marketing buys across various channels and to optimize their marketing efforts continuously through analysis, measurement, and testing.
What is Needed for Big Data?
At this point, talent and leadership are the major things that big data needs. In most of the companies, the marketing teams don’t have the right talent in place to leverage analytics and data. Apart from people who possess analytical skills to understand the capability of big data and where to use it, companies require data scientists who can extract meaningful insights from data and the technologists who can develop include new technologies. Due to this, there is a high demand for experienced analytics talent today.
Big Data Limitations for Marketing
In spite of all the promise, there exist certain limits to the usefulness of big data analytics in its present state. Among them, the major one is the major one is the analytics tools’ and techniques’ complex “black box” nature which makes it hard to trust and interpret the output of the approaches of big data and to assure others of the accuracy and value of the insights generated by the tools. The difficulty of gathering and understanding data also limits the capability of marketing companies to more fully leverage big data. Beyond this, the marketers are identifying many hurdles to expanding their utilization of big data tools and they include lack of sufficient technology investment, the inability of senior team members to leverage big data tools for decision-making, and the lack of credible tools for measuring effectiveness.
Conclusion
Cloud computing is also playing a major role in marketing with the Cloud Marketing process. Cloud Marketing is a process that outlines the efforts of a company to market their services and goods online via integrated digital experiences. Once the data analytics tools become available and accessible to even the smallest businesses, there will be a much higher impact of big data on the marketing sector as there will be much broader utilization of data analytics. This can only be a boon as organizations enhance their marketing and reach their customers in innovative and new ways.
Author’s Bio: Savaram Ravindra was born and raised in Hyderabad, popularly known as the ‘City of Pearls’. He is presently working at Mindmajix.com. His previous professional experience includes Programmer Analyst at Cognizant Technology Solutions. He holds a Masters degree in Nanotechnology from VIT University. He can be contacted at savaramravindra4@gmail.com. Connect with him also on LinkedIn and Twitter.
Interested in a career in Data Analyst?
To learn more about Data Analyst with Advanced excel course – Enrol Now. To learn more about Data Analyst with R Course – Enrol Now. To learn more about Big Data Course – Enrol Now.
To learn more about Machine Learning Using Python and Spark – Enrol Now. To learn more about Data Analyst with SAS Course – Enrol Now. To learn more about Data Analyst with Apache Spark Course – Enrol Now. To learn more about Data Analyst with Market Risk Analytics and Modelling Course – Enrol Now.
Microsoft Excel is a smorgasbord of information – it is a staple technology tool in any business environment. Whether you are crunching business data, organizing client sales inventory or planning an office event, Excel is arguably the most powerful tool entrenched across multiple business domains worldwide.
Aspiring professionals contemplating to make an entry into the workplace are required to excel on Excel tricks – Excel Dashboards Training Pune from DexLab Analytics is a promising gateway to your dreams!
More is always better, isn’t it? But does it always holds true, especially when it comes to customer data? Maybe not, because business is all about extracting meaningful insights from data, and if that cannot be acted upon then it is of no good.
Recently, Accenture concluded that one of the greatest challenges that marketers face nowadays is to discover the right ways to turn data into productive insights and then into action. For that, you would need analytics professionals who do know how to collect, store and integrate information, while mastering the technology aspect.
Want to get to the core of understanding risk within various business frameworks? The answer is Risk Analytics. This new breed of data analytics facilitates organizations in precisely defining, recognizing and managing their risk, and its need is going to increase in the coming few years. New developments in risk analyticsare gaining limelight and bringing a notable transformation in the market, while enhancing its overall capability.
Recently, a team of analysts had eureka moment – they introduced a new concept of real-time risk analytics – it is nothing but a modern, more advanced version of traditional risk analytics methods. Here, the prediction is based on real-time data – it processes, examines and determines risk all on a real-time basis – hence top notch financial institutions are putting real-time risk analytics to best use to manage and mitigate associated risks. Several asset management, portfolio management and hedge fund firms, and investment banks are relying on this mode of risk analytics to modify their operating principles to play in accordance with investment and market shifts.
The root cause for the Financial Crisis which stormed the globe in 2008 was the Sub-prime crisis which appeared in USA during late 2006. A sub-prime lending practice started in USA during 2003-2006. During the later parts of 2003, the housing sector started expanding and housing prices also increased. It has been shown that the housing prices were growing exponentially at that time. As a result, the housing prices followed a super-exponential or hyperbolic growth path. Such super-exponential paths for asset prices are termed as ‘bubbles’ So USA was riding a Housing price bubble. Now the bankers, started giving loans to the sub-prime segments. This segment comprised of customers who hardly had the eligibility to pay back the loans. However, since the loans were backed by mortgages bankers believed that with housing price increases the they could not only recover the loans but earn profits by selling off the houses. The expectations made by the bankers that asset prices always would ride the rising curve was erroneous. Hence, when the housing prices crashed the loans were not recoverable. Many banks sold off these loans to the investment banks who converted the loans into asset based securities. These assets based securities were disbursed all over the globe by the investments banks, the largest being done by Lehmann Brothers. When the underlying assets went valueless and the investors lost their investments, many of the investment banks collapsed. This caused the Financial Crisis and a huge loss of investors and tax-payers wealth. The involvement of Systematically Important Financial Institutions (SIFIs) and Globally Systematically Important Financial Institutions (G-SIFIs) into the frivolous lending process had amplified the intensity and the exposure of the crisis.
SYSTEMATICALLY IMPORTANT FINANCIAL INSTITUTIONS AND THEIR ROLE IN SYSTEMIC STABILITY
A Systematically Important Financial Institution (SIFI) is a bank, insurance company, or other financial institutions whose failure might trigger a financial crisis.
If a SIFI has the capacity to bring in a recession across the globe then it is known as a Globally Systematically Important Financial Institution (G-SIFI). The Basel Committee follows an indicator based approach for assessing the systematic importance of the G-SIFIs. The basic tenets of this approach are:
The BASEL committee is of the view that the global systemic importance should be measured in terms of the impact that a failure of a bank can have on the global financial system and wider economy rather than the risk that the failure can occur. So, the concept is more of a global, system wide, loss given default (LGD) concept rather than a probability of default (PD) problem.
The indicators reflect the following metrics: size of banks, their interconnectedness, the lack of availability of substitutable or financial institution infrastructure for provided services, their global activity, their complexity etc. Each of these are defined as:
(i) Cross-Jurisdiction: The indicator captures the global footprints of the banks. This indicator is divided into two activities: Cross Jurisdictional claims and Cross Jurisdictional liabilities. These two indicators measure the banks activities outside its home relative to overall activity of other banks’ in the sample. The greater the global reach of the bank, the more difficult is it to coordinate its resolution and the more widespread the spill over effects from its failure.
(ii) Size: Size of a bank is measured using the total exposure that it has globally. This is the exposure measure used to calculate Leverage ratio. BASEL III paragraph 157 uses a particular definition of exposure for this purpose. The score of each bank for this criterion is calculated as its amount of total exposure divided by the sum of total exposures of all banks in the sample.
(iii) Interconnectedness: Financial distress at one institution can materially raise the likelihood of distress at other institutions given the contractual obligations in which the firms operate. Interconnectedness is defined in terms of the following parameters: (a) Inter-financial system assets (b) Inter-financial system liabilities (c) The degree to which a bank funds itself from the other financial systems.
(iv) Complexity: The systemic impact of a bank’s distress or failure is expected to be positively related to its overall complexity. Complexity includes: business, structural and operational complexity. The more complex the bank is the greater are the costs and time needed to resolve the banks.
Given these characteristics, it was important to apply different restrictions to keep the lending practices of the banks under control. Frivolous lending done by such SIFIs had resulted in the financial crisis 2008-09. Post the crisis, regulators became more vigilant about maintaining appropriate reserves for banks to survive macroeconomic stress scenarios. Three major sources of risks to which banks are exposed to are: 1. Credit Risk 2. Market Risk 3. Operational Risk. Several regulations
have been imposed on banks to ensure that they are adequately capitalised. The major regulatory requirements to which banks need to be compliant with are:
BASEL 2. Dodd Frank Act Stress Testing 3. Comprehensive Capital Adequacy Review.
Before looking into the Regulatory frameworks and their impact on the Credit Risk modelling, let us form an understanding of the framework of the Bank Capital.
The bank’s capital structure is comprised of two main components: 1. Equity Capital of Banks 2. Supplementary capital of banks. The Equity capital of banks are the purest form of banking capital. This is true or the actual capital that a bank has and it has been raised from the shareholders. The supplementary capital of banks comprises of estimated capital such as allowances, provisions etc. This portion of the capital can easily be tampered by the management to meet undue shareholders expectations or unnecessarily over reserve capital. Thus, there are strong capital norms and regulations around the supplementary capital. The two tiers of capital are: Tier1 and Tier2 capital. Tier1 capital is also decomposed into two parts: Tier1 Common capital and Tier1 capital.
Tier1 common capital = Common shareholder’s equity-goodwill-Intangibles. Goodwill and intangibles are no physical capital. In scenarios, where the goodwill and intangible assets are stressed, the capital in the banks would deteriorate. Therefore, they cannot be added to the company’s tier1 capital. Only the core or the physical amount of capital present in the bank account is the capital.
Tier1 Capital = Total Shareholders’ equity (Common + Preffered stocks) -goodwill -intangibles + Hybrid securities.
Tier 1 is the core equity capital for the bank. The components of Tier1 capital are common across all geographies for the banking system. Equity capital includes issued and fully paid equities. This is the purest form of capital that the bank has.
Tier2 Capital: tier 2 capital comprises of estimated reserves and provisions. This is the part of capital which is used to cushion against expected losses. Tier 2 capital has the following composition:Tier 2 = Subordinated debts +Allowances for Loans and lease losses + Provisions for bad debts -> This portion of the capital is reserved out of profits. Hence,
managers always try to under report these parameters to meet shareholder’s expectations. However, under reserving often poses the chances of bankruptcies or regulatory penalties. Total Capital of a Bank = Tier 1 capital + Tier 2 Capital
Every bank faces three main types of risks: 1. Credit risk 2. Market Risk 3. Operational risk. Credit Risk is the risk that arises from lending out funds to borrowers, given their chances of defaulting on loans. Market Risk is the risk that the bank faces due to market fluctuations like stock price changes, interest rate risk and price level fluctuation etc. Operational risk occurs as a failure of the operational processes. The exposure of the banks to these risks differ from bank to bank. So the capital that they to set aside would differ based on the exposure to risk. Therefore, regulators have defined a metric called Risk Weighted Assets (RWA) to identify the exposure of the bank’s assets to risk. Every bank must keep aside their capital relative to the exposure of their asset to risk. The biggest advantage of RWAs is that they not only include On-balance sheet items but off-balance sheet items as well. Banks need to maintain their Tier1 common capital, tier1 capital and tier2 capital relative to their RWAs. Thus, arises the Capital ratios.
Total RWA = RWA for Credit Risk + RWA for Market Risk + RWA for Operational Risk

Tier1 Common Capital Ratio = tier1 common capital / RWA (CR + MR + OR)

Tier1 Capital Ratio = Tier1 Capital / RWA (CR+MR+OR)

Total Capital Ratio = Total capital/ RWA(CR+MR+OR)

Leverage Ratio = Tier1 Capital / Firms consolidated assets

Regulators require some critical cut-offs for each of these ratios:

Tier1 Common Capital Ratio > = 2% all times

Tier1 Ratio >= 4% all times

Tier 2 capital cannot exceed Tier1 capital

Leverage ratio > = 3% of all times.
In the next blog we explore how the credit risk models help in ensuring the capital adequacy of the banks and in the business risk management.
To learn more about Data Analyst with Advanced excel course – Enrol Now. To learn more about Data Analyst with R Course – Enrol Now. To learn more about Big Data Course – Enrol Now.
To learn more about Machine Learning Using Python and Spark – Enrol Now. To learn more about Data Analyst with SAS Course – Enrol Now. To learn more about Data Analyst with Apache Spark Course – Enrol Now. To learn more about Data Analyst with Market Risk Analytics and Modelling Course – Enrol Now.
Managing a proper budget is an essential task. Professionals working in enterprises are somehow involved in performing this task to some degree. Fortunately, a handful number of budgeting Excel templates is available online – check out some of our favorites:
Back to the basics, budget is something more than an educative, future projection of what should happen to a company’s financial position over a specific course of time, based on the latest trends, current data and previous history. The accuracy of the entire forecast depends on the quality of financial data accumulated during the budget period – it is here that a robust set of data collection tools saves the day.
Here’s a roundup of some of the most useful and easy-to-use budget-related MS Excel templates – most of them are available and are for free. Let’s check them out:
Microsoft Office Templates
When it comes to software, Microsoft remains unbeatable. It offers few applaud-worthy customizable office templates that help you become more productive in implementing programs, perform tasks and track financial budgets. Some of them are below:
Business Expense Report
Business travel expense report is one of the most popular budget reporting activities. For reimbursement of travel expenses, the employee needs to present detailed accounts of expenditures. The Excel template in here is easy to fill up, less time-consuming and removes the frustration caused due to tracking expenses in a business trip.
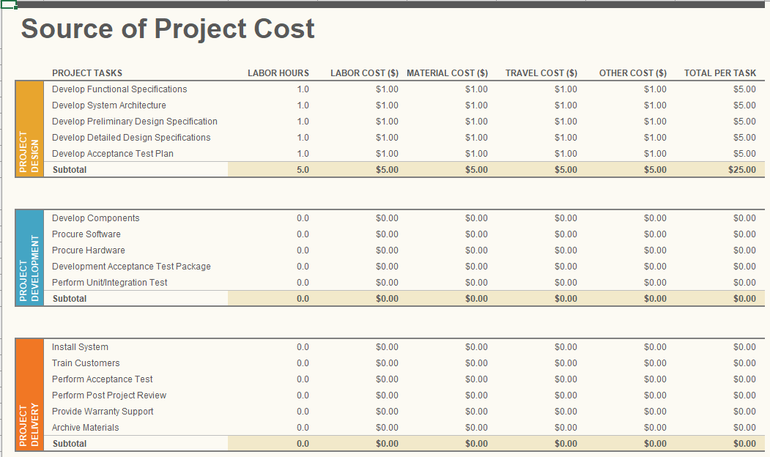
Project Budget
Project Budget template helps you evaluate your project’s design, development and delivery costs so as to monitor actual expenses that occur thereafter.
Profit and Loss Statement
An all-inclusive profit and loss statement is fundamental for any enterprise. Whether it’s on a departmental level or encompassing an entire organization, determining profit and loss in the financial statement is important to put into focus the problematic areas of your business. The Excel template helps in calculating both the actual and budget revenues and expenses over a pre-determined period of time.
Balance Sheet
Balance Sheet is an effective financial budgetary document that enlists all the assets and liabilities, while evaluating their budgetary values, depreciation rates and amortization records, and the job gets easier when it’s done on an Excel template.
Activity-based Cost Tracker
The activity-based cost tracker template provides you a visual representation of standard, administrative, direct and indirect costs in relation to production. It also helps in monitoring the cost of each unit, while helping you manipulate your budget plan, if other factors, including costs fluctuate.
Small Business Cash Flow Projection
Managing cash flow is more significant than determining profit and loss and balance sheet and by properly using the Excel template small businesses will do well for themselves anytime.
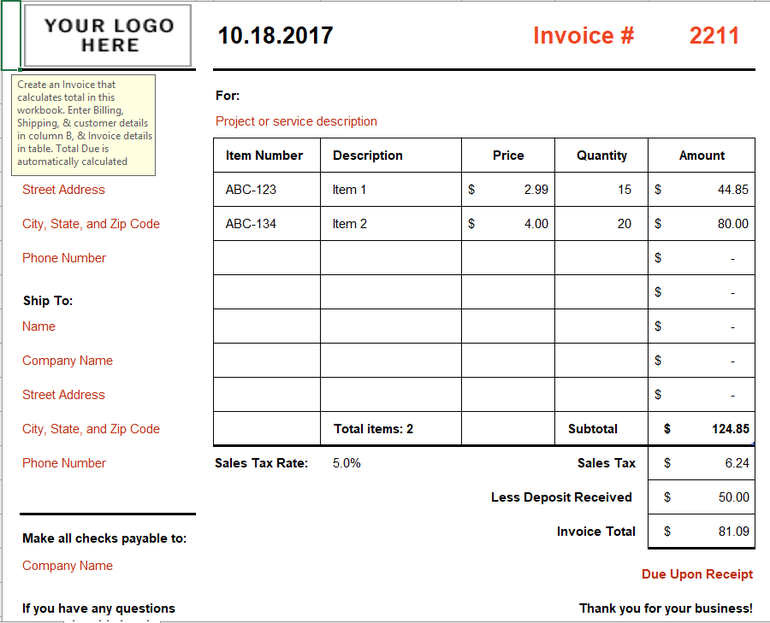
Simple Invoice
In the business circle, an Excel template on invoice gains a lot of accolades. This kind of Excel template automatically calculates the totals and subtotals so that the businesses don’t have to lose any of its valuable time.
Beyond the jurisdiction of Microsoft, here are few other budget-related Excel templates:
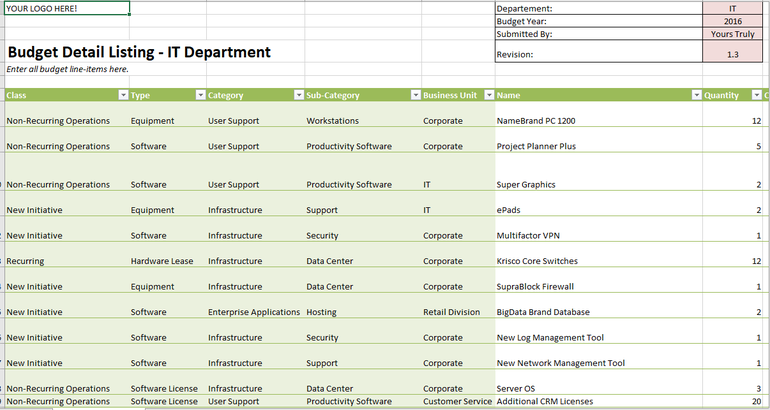
Year-round IT Budget Template
From the curators of Tech Pro Research team, this cutting edge Excel template helps you track all your spending, administer unplanned expenditure, classify expenses, and highlight key data, like cost of hiring new recruits, contract end dates and recurring payments.
Systems Downtime Expense Calculator
Taking care of an enterprise network is the most demanding job role for any IT administrator. Nothing in this wide world will be more traumatic than network downtime. Hence, this Excel template assist you place a dollar amount on your network downtime.
Computer Hardware Depreciation Calculator
This Excel worksheet helps you determine depreciation for your equipment – finding the rate of depreciation is not a piece of cake – there are many methods of deprecation to take into account.
To learn more about Data Analyst with Advanced excel course – Enrol Now. To learn more about Data Analyst with R Course – Enrol Now. To learn more about Big Data Course – Enrol Now.
To learn more about Machine Learning Using Python and Spark – Enrol Now. To learn more about Data Analyst with SAS Course – Enrol Now. To learn more about Data Analyst with Apache Spark Course – Enrol Now. To learn more about Data Analyst with Market Risk Analytics and Modelling Course – Enrol Now.
Many factors are constantly shaping and reshaping the structure of risk management today – including global geopolitical inconsistency, macroeconomic headwinds and increasing number of cyber activities – which is extensively damaging and recurring. All this is leading to elevated risk perceptions.
The nature of risks has changed over the years too, as well as the manner of addressing them. Today, to mitigate risk issues, technology plays a crucial role. Headwinds like global and Asian accelerating debt levels, lower projection of productivity growth, increasing levels of policy uncertainty and constant increase of US interest have created a lot of prominent macroeconomic challenges, especially in export-oriented Asian economies. Topping that, budding risks from technological advancements are on the rise, exposing industries to newer challenges like cybersecurity and data fraud.
As a result, the regulatory scenario of the world is also changing, especially after the global financial crisis. With a wide array of regulations introduced, the issue of risk management has started getting the desired prominence. These increasing regulations have compelled banks to accelerate their compliance activities, while giving increasing pressure on risk-management policymaking. The risk management teams now need to be constantly on a lookout for newer uncertainties – the key to address this concern remains productivity gains, but for that technology needs to be employed to the vast extent.
Advanced data analytics, contemporary data and NLP coupled with process digitization offers new robust opportunities for effective market risk management. The technological opportunities can be realized throughout various key functions and levels, but it is the duty of the risk professionals to chalk out a more affordable and fruitful approach to address risk-related issues.
Check out these 3 principal levers to nab potential opportunities:
Data – Data is the new powerful combat weapon. Financial institutions consist of huge piles of data, where internal and external sources of data continuously pour in at an accelerating rate. Data, in every form – including transaction, social media, and other sources helps discover real-time customer insights and generate dividends thereafter.
Analytics – Nowadays, machine learning, NLP, advanced analytics and self-learning algorithms are widely available and at achievable prices. The best example to show how advanced analytics is boosting risk management is improving debt collection.
As per conventional debt repayment collection procedure, a lot many calls were asked to make, out of which very few turned out to be successful. But now, with advanced analytics, a set of high-end predictive models are developed to fire up decision-making process. After this, an improved insight about customers can be curated, which can further be developed with better prediction quality.
Processes – With digitization, one gets the opportunity to automate and design risk-monitoring processes to mitigate emerging risks. Nowadays, several financial institutions are implementing machine learning and transaction data to automate monitoring of conduct risk.
Subject to the extent of digitization, the change in factors for risk organization is proposed – in the beginning of digitization, one expects 15-20 percent efficiency gains, while a 60-70% improvement is to be expected in case of a fully digitized risk function, which is quite a show!
To learn more about Data Analyst with Advanced excel course – Enrol Now. To learn more about Data Analyst with R Course – Enrol Now. To learn more about Big Data Course – Enrol Now.
To learn more about Machine Learning Using Python and Spark – Enrol Now. To learn more about Data Analyst with SAS Course – Enrol Now. To learn more about Data Analyst with Apache Spark Course – Enrol Now. To learn more about Data Analyst with Market Risk Analytics and Modelling Course – Enrol Now.
Cybersecurity attacks are the new potent threat to businesses. Diligent professionals and big mouth board members have started reviewing their company’s cybersecurity frameworks, while establishing better security controls and discerning deeper insights about the business impact of cybersecurity attacks: what kind of risks are they exposed to? Are they expending too much and need to curtail down? What amount of risk can be reduced using the proposed info security budget? Cyber-insurance, will it fetch better results?
What objectives to secure with Cyber value-at-risk models?
This is the epic question that has triggered the development of Value-at-risk models, especially in the domain of information security. Also known as Cyber VaR, these models are a game-changer. They offer a sound base for quantification of information risk coupled with infusing discipline into the whole process.
To help risk professionals formulate the notion of cyber risk in plain financial language without using any technical jargons.
To enable business professionals achieve a standard balance between safeguarding an organization and running the business by making cost-effective decisions.
Enterprises powered by VaR models for cybersecurity make complicated decision-making as easy as pie. They trigger risk-related discussions, where risks become more consistent, and business-goal driven.
In the world of finance, value-at-risk modeling is the statistical methodology to appraise the level of financial risk that a firm is exposed to over a specific period of time.
The VaR is ascertained using these three variables:
The amount of conjectured loss
The probability of that amount of loss
The time frame
Probabilities are effective to evaluate likely losses from the cyber attacks during a specific time period. Top notch global organizations, like World Economic Forum and several regulatory bodies, like The Open Group are revolutionizing the concept of cyber VaR models.
What is its benefit?
VaR was initially developed in 1990’s to boost the investment banking sector, wherein managers were to identify the risks that popped up daily in multiple market reports. From the name itself, you can understand, it is more likely a measurement tool to analyze the financial impact of risky events within a particular time frame.
The most beneficial effect of VaR is that it not only quantifies risk but also pens it down in economic terms that are easily understood by all. It also assists in mitigating long-term challenges by aggregating cyberrisk with various other operational risks within an enterprise risk management system.
CISOs, Chief information security officers decipher what exactly VaR offers in terms of cyberrisk management. This hi-tech concept is too good to help with crucial decision-making, like addressing cyberrisk appetite and defining the optimal allocation of cyber risk management resources.
To learn more about Data Analyst with Advanced excel course – Enrol Now. To learn more about Data Analyst with R Course – Enrol Now. To learn more about Big Data Course – Enrol Now.
To learn more about Machine Learning Using Python and Spark – Enrol Now. To learn more about Data Analyst with SAS Course – Enrol Now. To learn more about Data Analyst with Apache Spark Course – Enrol Now. To learn more about Data Analyst with Market Risk Analytics and Modelling Course – Enrol Now.