Erik Schmidt, a Senior Scientist at Pandora is going to propose an insight of recommendations and deeper challenges involved with Pandora at the Machine Intelligence Summit. This global tech event will take place in San Francisco on 23rd and 24th of March 2017.Continue reading “Pandora: Blending Music with Machine Learning”
Business Intelligence combined with Big Data analytics is stimulating the progress of Enterprises across the globe, along with pulling whooping amount of investment within the Big Data community. The infographic given below on big data in shaping everyday lives elucidates people about how Big Data is making our lives better.
At the previous month’s “R user group meeting in Melbourne”, they had a theme going; which was “Experiences with using SAS and R in insurance and banking”. In that convention, Hong Ooi from ANZ (Australia and New Zealand Banking Group) spoke on the “experiences in credit risk analysis with R”. He gave a presentation, which has a great story told through slides about implementing R programming for fiscal analyses at a few major banks.
In the slides he made, one can see the following:
How R is used to fit models for mortgage loss at ANZ
A customized model is made to assess the probability of default for individual’s loans with a heavy tailed T distribution for volatility.
One slide goes on to display how the standard lm function for regression is adapted for a non-Gaussian error distribution — one of the many benefits of having the source code available in R.
A comparison in between R and SAS for fitting such non-standard models
Mr. Ooi also notes that SAS does contain various options for modelling variance like for instance, SAS PROC MIXED, PRIC NLIN. However, none of these are as flexible or powerful as R. The main difference as per Ooi, is that R modelling functions return as object as opposed to returning with a mere textual output. This however, can be later modified and manipulated with to adapt to a new modelling situation and generate summaries, predictions and more. An R programmer can do this manipulation.
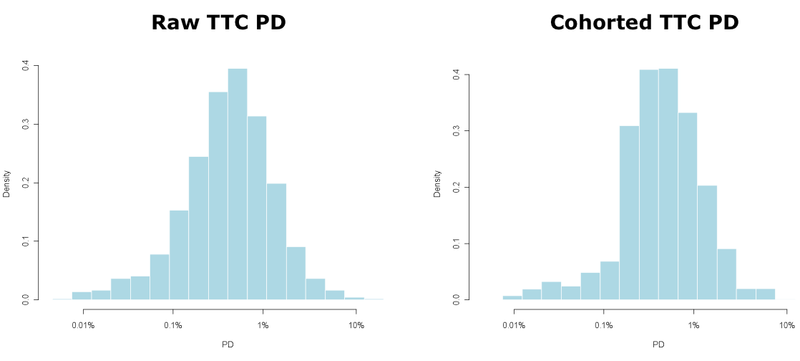
We can use cohort models to aggregate the point estimates for default into an overall risk portfolio as follows:
Photo Coutesy of revolution-computing.typepad.com
He revealed how ANZ implemented a stress-testing simulation, which made available to business users via an Excel interface:
The primary analysis is done in r programming within 2 minutes usually, in comparison to SAS versions that actually took 4 hours to run, and frequently kept crashing due to lack of disk space. As the data is stored within SAS; SAS code is often used to create the source data…
While an R script can be used to automate the process of writing, the SAS code can do so with much simplicity around the flexible limitations of SAS.
Comparison between use of R and SAS’s IML language to implement algorithms:
Mr. Ooi’s R programming code has a neat trick of creating a matrix of R list objects, which is fairly difficult to do with IML’s matrix only data structures.
He also discussed some of the challenges one ma face when trying to deploy open-source R in the commercial organizations, like “who should I yell at if things do now work right”.
And lastly he also discussed a collection of typically useful R resources as well.
For people who work in a bank and need help adopting R in the workflow, may make use of this presentation to get some knowledge about the same. And also feel free to get in touch with our in-house experts in R programming at DexLab Analytics, the premiere R programming training institute in India.
To learn more about Data Analyst with Advanced excel course – Enrol Now. To learn more about Data Analyst with R Course – Enrol Now. To learn more about Big Data Course – Enrol Now.
To learn more about Machine Learning Using Python and Spark – Enrol Now. To learn more about Data Analyst with SAS Course – Enrol Now. To learn more about Data Analyst with Apache Spark Course – Enrol Now. To learn more about Data Analyst with Market Risk Analytics and Modelling Course – Enrol Now.
Once again, good news is in the air for our very own ‘Big Cats’. The very recent reports on Tiger Census have proudly announced the incredible rise in the number from 1,706 to 2, 226 since 2010, when the counting started.
The previous years have seen the major downfall in the number owing to reasons like poaching, environmental degradation, dwindling habitats and of course man- nature conflict . But in contrast, the combined efforts put forwarded by local communities, conservationists and the Government has resulted in the upliftment, as stated by Marco Lambertini, Director General of WWF International.
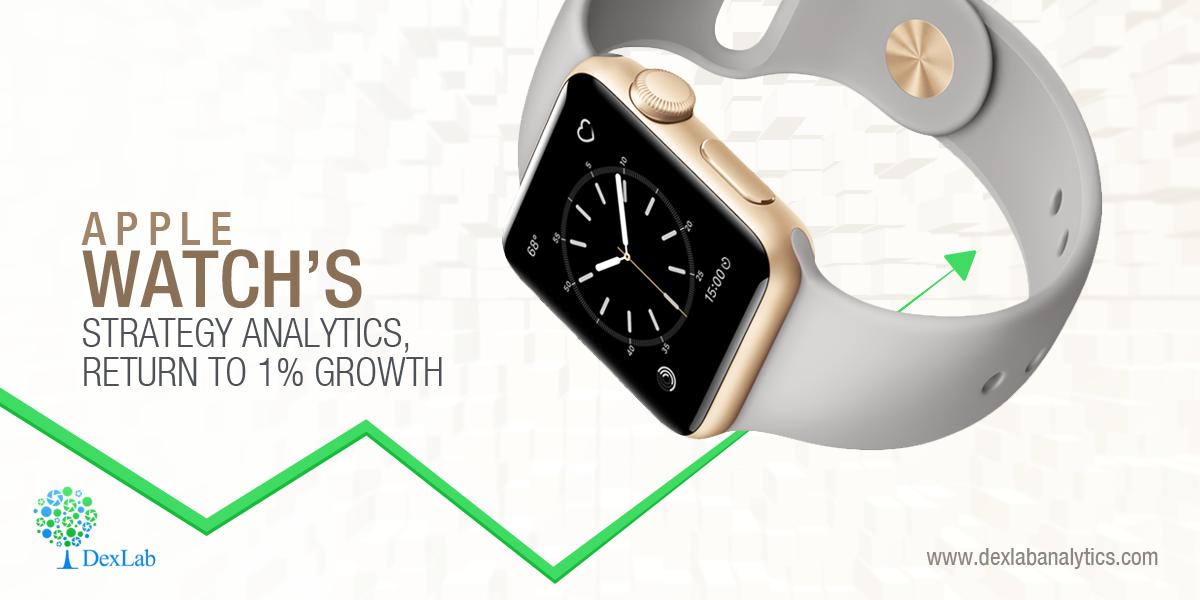
As per the latest research from strategy analytics, the global smart watch shipments of Apple has grown by 1 percent annually to hit the major record of 8.2 million units in the 4th quarter of the year 2016. The growth of apple watch drove and got dominated with 63 percent in global smart watch share of market and Samsung still continues to hold its second position.
Neil Mawston, the Executive Director at Strategy Analytics stated on the issue by saying – the global shipments have grown by 1 percent annually from the pre-existing 8.1 million units in quarter 4 in 2015 to 8.2 million in quarter 4 in 2016. The market shows a marked growth in the fourth quarter for growth in smart watches industry after the past two consecutive quarters for declining volumes. The smart watch growth is also seen to be recovering ever so slightly due to new product launches from other company giants. Moreover, there is a seasonal demand for these gadgets, and a giant such as Apple is launching stringer demand in the major developed markets in the US and UK. Hence, the international smart watch shipments grew by 1 percent annually; from the previously existing 20.8 million in full-year 2015 to a record high of 21.1 million in 2016.
Did you know that with Excel you can now automate tasks by writing so called programs macros. In this tutorial, we will learn how do so, by learning to create a simple macro, which will executable after clicking a command button. To begin you must first turn on the developer tab:
Developer tab:
Do the following steps to turn the developer tab on:
First right click anywhere on the ribbon, and then click on Customize the Ribbon.
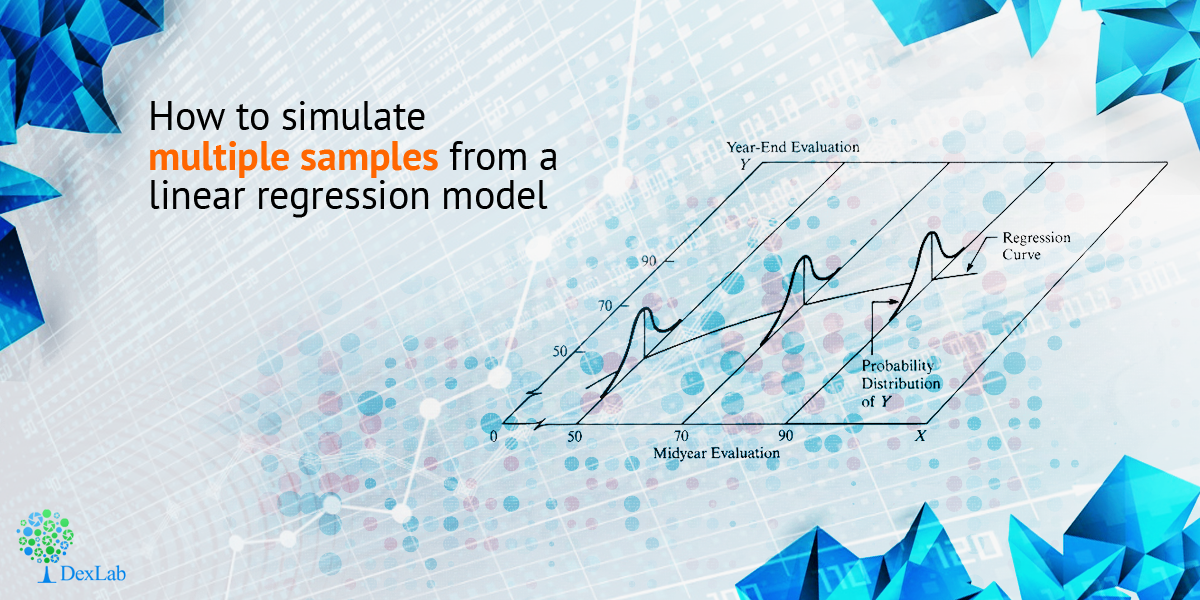
In this blog post, we will learn how to simulate multiple samples efficiently. In order to keep the discussion, easy we have simulated a single sample with ‘n’ number of observations, and ‘p’ amount of variables. But in order to use the Monte Carlo method to approximate the distribution sampling of statistics, one needs to simulate many specimens with the same regression model.
How to Simulate Multiple Samples From a Linear Regression Model
The data steps in SAS in most blogs have 4 steps mentioned for so. However, to simulate multiple samples, put DO loop around these steps that will generate, the error term and the response variable for very observation made in the model.