online certification Archives - DexLab Analytics | Big Data Hadoop SAS R Analytics Predictive Modeling & Excel VBA

Introduction to MongoDB

MongoDB is a document based database program which was developed by MongoDB Inc. and is licensed under server side public license (SSPL). It can be used across platforms and is a non-relational database also known as NoSQL, where NoSQL means that the data is not stored in the conventional tabular format and is used for unstructured data as compared to SQL and that is the major difference between NoSQL and SQL.
MongoDB stores document in JSON or BSON format. JSON also known as JavaScript Object notation is a format where data is stored in a key value pair or array format which is readable for a normal human being whereas BSON is nothing but the JSON file encoded in the binary format which is quite hard for a human being to understand.
Structure of MongoDB which uses a query language MQL(Mongodb query language):-
Databases:- Databases is a group of collections.
Collections:- Collection is a group fields.
Fields:- Fields are nothing but key value pairs
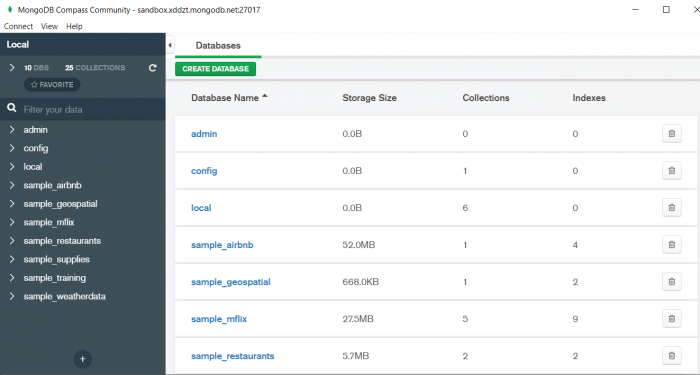
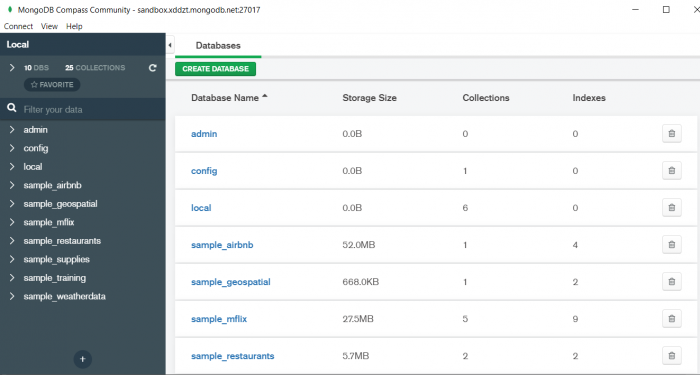
Just for an example look at the image given below:-

Here I am using MongoDB Compass a tool to connect to Atlas which is a cloud based platform which can help us write our queries and start performing all sort of data extraction and deployment techniques. You can download MongoDB Compass via the given link https://www.mongodb.com/try/download/compass

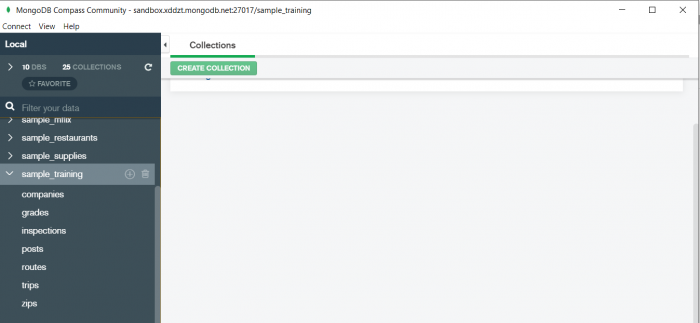
In the above image in the red box we have our databases and if we click on the “sample_training” database we will see a list of collections similar to the tables in sql.

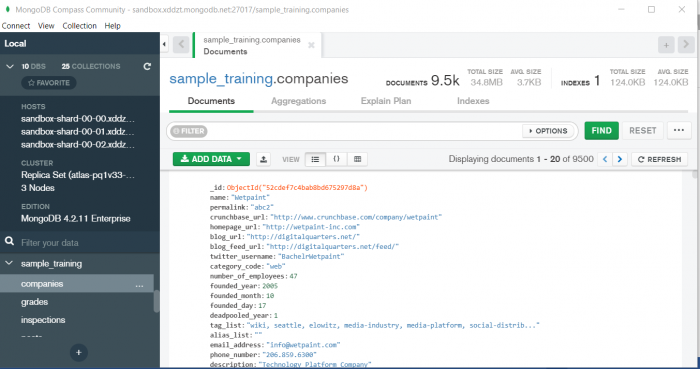
Now lets write our first query and see what data in “companies” collection looks like but before that select the “companies” collection.

Now in our filter cell we can write the following query:-

In the above query “name” and “category_code” are the key values also known as fields and “Wetpaint” and “web” are the pair values on the basis of which we want to filter the data.
What is cluster and how to create it on Atlas?
MongoDB cluster also know as sharded cluster is created where each collection is divided into shards (small portions of the original data) which is a replica set of the original collection. In case you want to use Atlas there is an unpaid version available with approximately 512 mb space which is free to use. There is a pre-existing cluster in MongoDB named Sandbox , which currently I am using and you can use it too by following the given steps:-
1. Create a free account or sign in using your Google account on
https://www.mongodb.com/cloud/atlas/lp/try2-in?utm_source=google&utm_campaign=gs_apac_india_search_brand_atlas_desktop&utm_term=mongodb%20atlas&utm_medium=cpc_paid_search&utm_ad=e&utm_ad_campaign_id=6501677905&gclid=CjwKCAiAr6-ABhAfEiwADO4sfaMDS6YRyBKaciG97RoCgBimOEq9jU2E5N4Jc4ErkuJXYcVpPd47-xoCkL8QAvD_BwE
2. Click on “Create an Organization”.
3. Write the organization name “MDBU”.
4. Click on “Create Organization”.
5. Click on “New Project”.
6. Name your project M001 and click “Next”.
7. Click on “Build a Cluster”.
8. Click on “Create a Cluster” an option under which free is written.
9. Click on the region closest to you and at the bottom change the name of the cluster to “Sandbox”.
10. Now click on connect and click on “Allow access from anywhere”.
11. Create a Database User and then click on “Create Database User”.
username: m001-student
password: m001-mongodb-basics
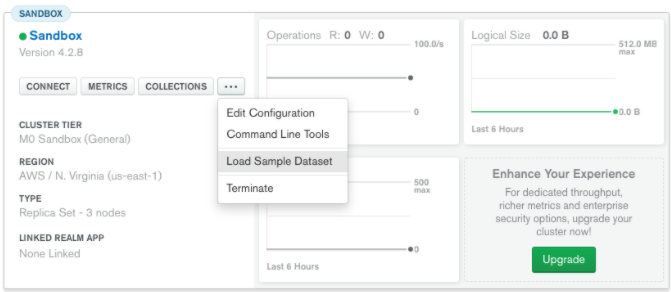
12. Click on “Close” and now load your sample as given below :

Loading may take a while….
13. Click on collections once the sample is loaded and now you can start using the filter option in a similar way as in MongoDB Compass
In my next blog I’ll be sharing with you how to connect Atlas with MongoDB Compass and we will also learn few ways in which we can write query using MQL.

So, with that we come to the end of the discussion on the MongoDB. Hopefully it helped you understand the topic, for more information you can also watch the video tutorial attached down this blog. The blog is designed and prepared by Niharika Rai, Analytics Consultant, DexLab Analytics DexLab Analytics offers machine learning courses in Gurgaon. To keep on learning more, follow DexLab Analytics blog.


.

Time Series Analysis Part I


A time series is a sequence of numerical data in which each item is associated with a particular instant in time. Many sets of data appear as time series: a monthly sequence of the quantity of goods shipped from a factory, a weekly series of the number of road accidents, daily rainfall amounts, hourly observations made on the yield of a chemical process, and so on. Examples of time series abound in such fields as economics, business, engineering, the natural sciences (especially geophysics and meteorology), and the social sciences.

  • Univariate time series analysis- When we have a single sequence of data observed over time then it is called univariate time series analysis.
  • Multivariate time series analysis – When we have several sets of data for the same sequence of time periods to observe then it is called multivariate time series analysis.

The data used in time series analysis is a random variable (Yt) where t is denoted as time and such a collection of random variables ordered in time is called random or stochastic process.

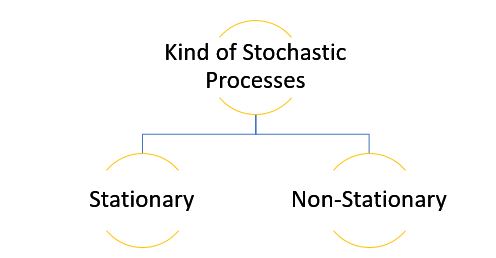
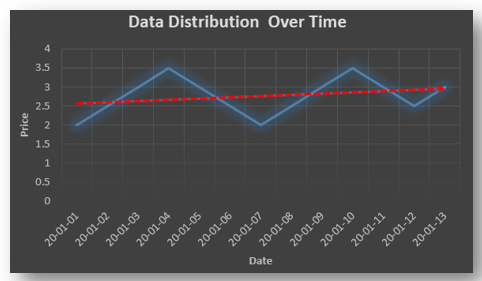
Stationary: A time series is said to be stationary when all the moments of its probability distribution i.e. mean, variance , covariance etc. are invariant over time. It becomes quite easy forecast data in this kind of situation as the hidden patterns are recognizable which make predictions easy.

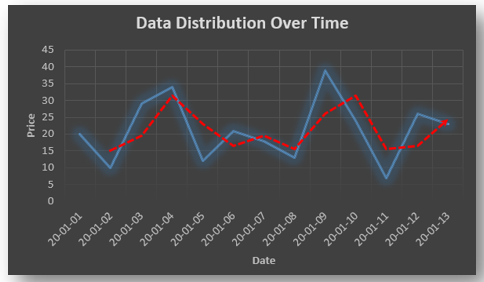
Non-stationary: A non-stationary time series will have a time varying mean or time varying variance or both, which makes it impossible to generalize the time series over other time periods.

Non stationary processes can further be explained with the help of a term called Random walk models. This term or theory usually is used in stock market which assumes that stock prices are independent of each other over time. Now there are two types of random walks:
Random walk with drift : When the observation that is to be predicted at a time ‘t’ is equal to last period’s value plus a constant or a drift (α) and the residual term (ε). It can be written as
Yt= α + Yt-1 + εt
The equation shows that Yt drifts upwards or downwards depending upon α being positive or negative and the mean and the variance also increases over time.
Random walk without drift: The random walk without a drift model observes that the values to be predicted at time ‘t’ is equal to last past period’s value plus a random shock.
Yt= Yt-1 + εt
Consider that the effect in one unit shock then the process started at some time 0 with a value of Y0
When t=1
Y1= Y0 + ε1
When t=2
Y2= Y1+ ε2= Y0 + ε1+ ε2
In general,
Yt= Y0+∑ εt
In this case as t increases the variance increases indefinitely whereas the mean value of Y is equal to its initial or starting value. Therefore the random walk model without drift is a non-stationary process.

So, with that we come to the end of the discussion on the Time Series. Hopefully it helped you understand time Series, for more information you can also watch the video tutorial attached down this blog. DexLab Analytics offers machine learning courses in delhi. To keep on learning more, follow DexLab Analytics blog.


.
DexLab Analytics Rated One of The Best Institutes in India

DexLab Analytics Rated One of The Best Institutes in India

Analytics India Magazine (AIM), one of the foremost journals on big data and AI in India, has rated Dexlab Analytics’ credit risk modelling course one of the best in India and recommended it be taken up to learn the subject in 2020. Dexlab Analytics is on AIM’s list of nine best online courses on the subject.

In an article, the AIM has rated DexLab Analytics as a premier institute offering a robust course in credit risk modelling. Credit risk modelling is “the analysis of the credit risk that helps in understanding the uncertainty that a lender runs before lending money to borrowers”.

The article describes the Dexlab Analytics course as offering learners “an opportunity to understand the measure of central tendency theorem, measures of dispersion, probability theory and probability distribution, sampling techniques, estimation theory, types of statistical tests, linear regression, logistic regression. Besides, you will learn the application of machine learning algorithms such as Decision tree, Random Forest, XGBoost, Support Vector Machine, banking products and processes, uses of the scorecard, scorecard model development, use of scorecard for designing business strategies of a bank, LGD, PD, EAD, and much more.”

The other bodies offering competent courses on the subject on AIM’s list are Udemy, SAS, Redcliffe Training, EDUCBA, Moneyweb CPD HUB, 365 DataScience and DataCamp.

Analytics India Magazine chronicles technological progress in the space of analytics, artificial intelligence, data science & big data by highlighting the innovations, players, and challenges shaping the future of India through promotion and discussion of ideas and thoughts by smart, ardent, action-oriented individuals who want to change the world.

Since 2012, Analytics India Magazine has been dedicated to passionately championing and promoting the analytics ecosystem in India. We have been a pre-eminent source of news, information and analysis for the Indian analytics ecosystem, covering opinions, analysis, and insights on key breakthroughs and future trends in data-driven technologies as well as highlighting how they’re being leveraged for future impact.

Data Science Machine Learning Certification

Dexlab Analytics has been thriving as one of the prominent institutes offering the best selection of courses on Big Data Hadoop, R Programming, Python, Business Analytics, Data Science, Machine Learning, Deep Learning, Data Visualization using Tableau and Excel. Moreover, it aims to achieve Corporate Training Excellence with each training it conducts.

For more information on this, click here – www.prlog.org/12826797-dexlab-analytics-listed-as-one-of-the-best-institutes-in-india.html


.

AI-Smart Assistants: A New Tech Revolution in the Make

2018 has begun. And this year is going to witness a mega revolution in the field of technology – the rise of AI-powered digital assistants. Striking improvements in key technologies, like natural language processing and voice recognition are making smart assistants more productive, helping us use electronic devices just by interacting with them.

 
AI-Smart Assistants: A New Tech Revolution in the Make
 

Smart voice assistants are going mainstream. From Apple’s Siri to Google’s Assistant to Samsung’s Bixby, superior digital assistants are on a quest to make our lives easier, while taking us a step closer to a world where each one of us will have our own personal, 24/7 –all-ears AI assistants to fulfill our every wish and command.

Continue reading “AI-Smart Assistants: A New Tech Revolution in the Make”

How Can You Improve Your Business Figures with Data Lakes

Today, data lakes are springing up here and there. And with that, the composition structure of data lakes is changing. As more and more data are moving towards cloud, data lakes are shifting focus towards cutting edge sources, like NoSQL, while cloud data warehouses are emerging across hybrid deployments.

How Can You Improve Your Business Figures with Data Lakes

A humongous amount of data is being churned out on digital platform each day. IBM says as much as 2.5 quintillion bytes of data is created on a daily basis. Now, this ever-expanding amount of data needs for proper storage system – for that, data lakes have been constructed to hold data in its raw form. In these vast storehouses, data remain mostly in their unstructured state, which is pulled out by data scientists to remodel and transform them into versatile data sets for future use.

Continue reading “How Can You Improve Your Business Figures with Data Lakes”

Data Governance: How to Win Over Data and Rule the World

Data is the buzzword. It is conquering the world, but who conquers data: the companies that use them or the servers in which they are stored?


Data Governance: How to Win Over Data and Rule the World


Let’s usher you into the fascinating world of data, and data governance. FYI: the latter is weaving magic around the Business Intelligence community, but to optimize the results to the fullest, it needs to depend heavily on a single factor, i.e. efficient data management. For that, highly-skilled data analysts are called for – to excel on business analytics, opt for Business Analytics Online Certification by DexLab Analytics. It will feed you in the latest trends and meaningful insights surrounding the daunting domain of data analytics.

Continue reading “Data Governance: How to Win Over Data and Rule the World”

10 Frequently-asked Hadoop Interview Questions with Answers

10 Frequently-asked Hadoop Interview Questions with Answers

A substantial part of the Apache project, Hadoop is an open source, Java-based programming software framework that is used for storing data and running applications on different clusters of commodity hardware. Be it any kind of data, Hadoop acts as a massive storage unit backed by gargantuan processing power and an ability to tackle virtually countless tasks and jobs, simultaneously.

In this blogpost, we are going to discuss top 10 Hadoop interview questions – cracking these questions may help you bag the sexiest job of this decade.

What are the components of Hadoop?

There are 3 layers in Hadoop and they are as follows:

  • Storage layer (HDFS) – Also known as Hadoop Distributed File System, HDFS is responsible for storing various forms of data as blocks of information. It includes NameNode and DataNode.
  • Batch processing engine (MapReduce) For parallel processing of large data sets across a standard Hadoop cluster, MapReduce is the key.
  • Resource management layer (YARN) Yet Another Resource Negotiator is the powerful processing framework in Hadoop system that keeps a check on the resources.

Why is Hadoop streaming?

Hadoop distribution includes a generic application programming interface for drawing MapReduce jobs in programming languages like Ruby, Python, Perl, etc. and this is known as Hadoop streaming.

2

What are the different modes to run Hadoop?

  • Local (standalone) Mode
  • Pseudo-Distributed Mode
  • Fully-Distributed Mode

How to restart Namenode?

Begin by clicking on stop-all.sh and then on start-all.sh

OR

Write sudo hdfs (then press enter), su-hdfs (then press enter), /etc/init.d/ha (then press enter) and finally /etc/init.d/Hadoop-0.20-name node start (then press enter).

How can you copy files between HDFS clusters?

Use multiple nodes and the distcp command to ensure smooth copying of files between HDFS clusters.

What do you mean by speculative execution in Hadoop?

In case, a node executes a task slower, the master node has the ability to start the same task on another node. As a result, the task that finishes off first will be accepted and the other one will be rejected. This entire procedure is known as “speculative execution”.

What is “WAL” in HBase?

Here, WAL stands for “Write Ahead Log (WAL)”, which is a file located in every Region Server across the distributed environment. It is mostly used to recover data sets in case of mishaps.

How to do a file system check in HDFS?

FSCK command is your to-go option to do file system check in HDFS. This command is extensively used to block locations or names or check overall health of any files.

Follow

hdfs fsck /dir/hadoop-test -files -blocks –locations

What sets apart an InputSplit from a Block?

A block divides the data, physically without taking into account the logical equations. This signifies you can posses a record that originated in one block and stretches over to another. On the other hand, InputSplit includes the logical boundaries of records, which are crucial too.

Why should you use Storm for Real-Time Processing?

  • Easy to operate simple operating system makes it easy
  • Fast processing it can process around 100 messages per second per node
  • Fault detection it can easily detect faults and restarts functional attributes
  • Scores high on reliability expect execution of each data unit at least for once
  • High scalability it operates throughout clusters of machines


The article has been sourced from
– www.besthadooptraining.in/blog/top-100-hadoop-interview-questions


Learn how Big Data Hadoop can help you manage your business data decisions from DexLab Analytics. We are a leading Big Data Hadoop training institute in Delhi NCR region offering industry standard big data related courses for data-aspiring candidates. 


Interested in a career in Data Analyst?

To learn more about Data Analyst with Advanced excel course – Enrol Now.
To learn more about Data Analyst with R Course – Enrol Now.
To learn more about Big Data Course – Enrol Now.

To learn more about Machine Learning Using Python and Spark – Enrol Now.
To learn more about Data Analyst with SAS Course – Enrol Now.
To learn more about Data Analyst with Apache Spark Course – Enrol Now.
To learn more about Data Analyst with Market Risk Analytics and Modelling Course – Enrol Now.

Google is Back in China! It Decides to Open an AI Lab in the Far-East

Google is Back in China! It Decides to Open an AI Lab in the Far-East


Google is strengthening its artificial intelligence base, including China.


And it is so doing by establishing a new AI research center in Beijing. Google is digging deep into China, where it contravened the government in 2010 committing a spectacularly principled act of self-sabotage by refusing to self-censor search content and later found most of its services to be blocked. The company’s decision to return back to China is more about safeguarding its future, and acknowledging the supreme importance of technology’s most competitive field: AI.

Continue reading “Google is Back in China! It Decides to Open an AI Lab in the Far-East”

The Impact of Big Data on Marketing

The Impact of Big Data on Marketing

In marketing, the analysis of data is a highly established one but the marketers nowadays have a massive amount of public and proprietary data about the preferences, usage, and behavior of a customer. The term ‘big data’ points out to this data explosion and the capability to use the data insights to make informed decisions. Understanding the potential of big data presents various technical challenges but it also needs executive talent devoted to applying the solutions of big data. Today, the marketers are widely embracing big data and are confident in their use of analytics tools and techniques. Let us learn about the ways in which Big data and analytics can improve the marketing efforts of various businesses around the around.

Locating Prospective Customers

Previously, marketers had to frequently make guesses as to which sector of population comes under their ideal market segment but this is no longer the scenario today. The companies can exactly see who is buying and even extract more details about them with the help of big data. The other details include which buttons they generally click while on a website, which websites they visit frequently, and which social media channels they utilize.

Tracking Impact and ROI

Many retailers have introduced loyalty card systems that track the purchases of a customer, but these systems can also track which promotions and incentives are most effective in encouraging a group of customers or a single customer to make another purchase.

Handling Marketing Budgets

Because big data allows companies to optimize and monitor their marketing campaigns for performance, this implies they can allocate their budget for marketing for the highest return-on-investment (ROI).

Personalizing Offers in Real-Time

Marketers can personalize their offers to customers in real time with the combination of big data and machine learning algorithms. Think about the Amazon’s “customers also bought” section or the recommended list of TV shows and movies from Netflix. The organizations can personalize what promotions and products a particular customer views, even down to sending personalized offers and coupons to the mobile phone of a customer when he walks into a physical location. The role of Personalized Merchandising in the ecommerce industry will continue to increase in the years to come.

Improvement in Market Research

Companies can conduct quantitative and qualitative market research much more inexpensively and quickly than ever before. The tools for online survey mean that customer feedback and focus groups are inexpensive and easy to implement, and data analytics make the results easier to take action.

Prediction of Buyer Behavior and Sales

For the past several years, sales teams, in order to rate their hottest leads, have made use of lead scoring. But, with the help of predictive analytics, a model can be generated and it can successfully predict sales and buyer behavior.


2

Enhanced Content Marketing

Previously, the return-on-investment for a blog post used to be highly difficult to measure. But, with the help of big data and analytics, the marketers can effortlessly analyze which pieces of content are highly effective at moving leads via a sales and marketing funnel. Even a small firm can afford to use tools for implementing content scoring which can highlight the content pieces that are highly responsible for closing sales.

Optimize Customer Engagement

Data can provide more information about your customers which includes who they are, what they want, where they are, how often they purchase on your site, and how, when they prefer to be contacted, and various other major factors. The organizations can also examine how users interact not only with their website, but also their physical store to enhance the experience of the user.

Tracking Competitors

New tools for social monitoring have made it easy to gather and examine data about the competitors and their efforts regarding marketing as well. The organizations that can utilize this data will have a distinct competitive advantage.

Managing Reputation

With the help of big data, organizations can monitor their brand mentions very easily across different social channels and websites to locate unfiltered testimonials, reviews, and opinions about their company and products. The savviest can also utilize social media to offer service to the customers and create a trustworthy brand presence.

Marketing Optimization

It is quite difficult to track direct ROI and impact with traditional advertising. But, big data can help organizations to make optimal marketing buys across various channels and to optimize their marketing efforts continuously through analysis, measurement, and testing.

What is Needed for Big Data?

At this point, talent and leadership are the major things that big data needs. In most of the companies, the marketing teams don’t have the right talent in place to leverage analytics and data. Apart from people who possess analytical skills to understand the capability of big data and where to use it, companies require data scientists who can extract meaningful insights from data and the technologists who can develop include new technologies. Due to this, there is a high demand for experienced analytics talent today.

Big Data Limitations for Marketing

In spite of all the promise, there exist certain limits to the usefulness of big data analytics in its present state. Among them, the major one is the major one is the analytics tools’ and techniques’ complex “black box” nature which makes it hard to trust and interpret the output of the approaches of big data and to assure others of the accuracy and value of the insights generated by the tools. The difficulty of gathering and understanding data also limits the capability of marketing companies to more fully leverage big data. Beyond this, the marketers are identifying many hurdles to expanding their utilization of big data tools and they include lack of sufficient technology investment, the inability of senior team members to leverage big data tools for decision-making, and the lack of credible tools for measuring effectiveness.

Conclusion

Cloud computing is also playing a major role in marketing with the Cloud Marketing process. Cloud Marketing is a process that outlines the efforts of a company to market their services and goods online via integrated digital experiences. Once the data analytics tools become available and accessible to even the smallest businesses, there will be a much higher impact of big data on the marketing sector as there will be much broader utilization of data analytics. This can only be a boon as organizations enhance their marketing and reach their customers in innovative and new ways.

This article was produced by Savaram Ravindra, a content contributor at Mindmajix and not by the editorial team of DexLab Analytics, a leading Hadoop training institute in Gurgaon.


Author’s Bio: Savaram Ravindra was born and raised in Hyderabad, popularly known as the ‘City of Pearls’. He is presently working at Mindmajix.com. His previous professional experience includes Programmer Analyst at Cognizant Technology Solutions. He holds a Masters degree in Nanotechnology from VIT University. He can be contacted at savaramravindra4@gmail.com. Connect with him also on LinkedIn and Twitter.


Interested in a career in Data Analyst?

To learn more about Data Analyst with Advanced excel course – Enrol Now.
To learn more about Data Analyst with R Course – Enrol Now.
To learn more about Big Data Course – Enrol Now.

To learn more about Machine Learning Using Python and Spark – Enrol Now.
To learn more about Data Analyst with SAS Course – Enrol Now.
To learn more about Data Analyst with Apache Spark Course – Enrol Now.
To learn more about Data Analyst with Market Risk Analytics and Modelling Course – Enrol Now.

Call us to know more