Neural Networks Archives - Page 2 of 2 - DexLab Analytics | Big Data Hadoop SAS R Analytics Predictive Modeling & Excel VBA

What is a Neural Network?

What is a Neural Network?

Before we get started with the process of building a Neural Network, we need to understand first what a Neural Network is.

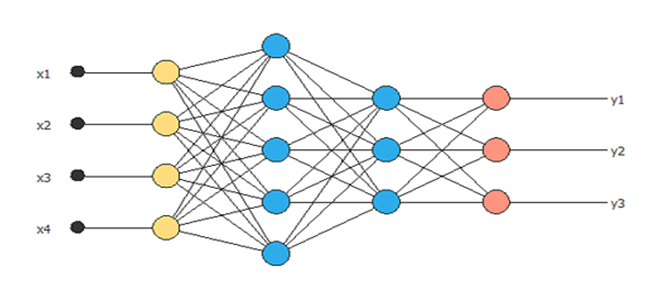
A neural network is a collection of neurons connected by synapses. This collection is organized into three main layers: the input layer, the hidden layer, and the output layer.

In an artificial neural network, there are several inputs, which are called features, producing a single output, known as a label.

Analogy between Human Mind and Neural Network

Scientists believe that a living creature’s brain processes information through the use of a biological neural network. The human brain has as many as 100 trillion synapses – gaps between neurons – which form specific patterns when activated.

In the field of Deep Learning, a neural network is represented by a series of layers that work much like a living brain’s synapses. It is becoming a popular course now, with an array of career opportunities. Thus, Deep learning Certification in Gurgaon is a must for everyone.

Scientists use neural networks to teach computers how to do things for themselves. The whole concept of Neural network and its varied applications are pretty interesting. Moreover, with the matchless Neural Networks Training in Delhi, you need not look any further.

There are numerous kinds of deep learning and neural networks:

  1. Feedforward Neural Network – Artificial Neuron
  2. Radial basis function Neural Network
  3. Kohonen Self Organizing Neural Network
  4. Recurrent Neural Network (RNN) – Long Short Term Memory
  5. Convolutional Neural Network
  6. Modular Neural Network
  7. Generative adversarial networks (GANs)

Data Science Machine Learning Certification

Working of a Simple Feedforward Neural Network

  1. It takes inputs as a matrix (2D array of numbers).
  2. Multiplies the input by a set weight (performs a dot product aka matrix multiplication).
  3. Applies an activation function.
  4. Returns an output.
  5. Error is calculated by taking the difference from the desired output from the data and the predicted output. This creates our gradient descent, which we can use to alter the weights.
  6. The weights are then altered slightly according to the error.
  7. To train, this process is repeated 1,000+ times. The more the data is trained upon, the more accurate our outputs will be.

Implementation of a Neural Network with Python and Keras

Keras has two types of models:

  • Sequential model
  • The model class used with functional API

Sequential model is probably the most used feature of Keras. Primarily, it represents the array of Keras Layers. It is convenient and builds different types of Neural Networks really quick, just by adding layers to it. Keras also has different types of Layers like Dense Layers, Convolutional Layers, Pooling Layers, Activation Layers, Dropout Layers etc.

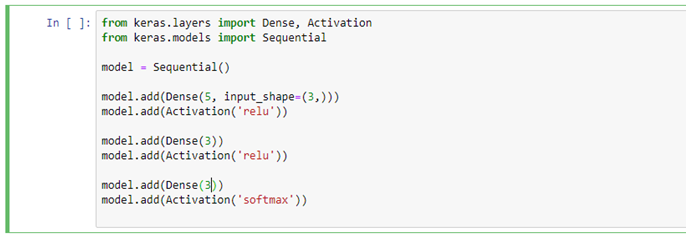
The most basic layer is Dense Layer. It has many options for setting the inputs, activation function and so on. So, let’s see how one can build a Neural Network using Sequential and Dense. 

First, let’s import the necessary code from Keras:

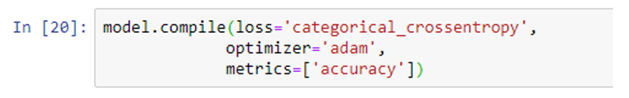
After this step, the model is ready for compilation. The compilation step asks to define the loss function and the kind of optimizer which should be used. These options depend on the problem one is trying to solve.

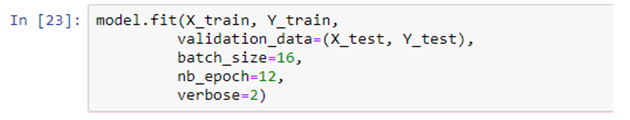
Now, the model is ready to get trained. Thus, the parameters get tuned to provide the correct outputs for a given input. This can be done by feeding inputs at the input layer and then, getting an output.

After this one can calculate the loss function using the output and use backpropagation to tune the model parameters. This will fit the model parameters to the data.

Output of the above cell:-

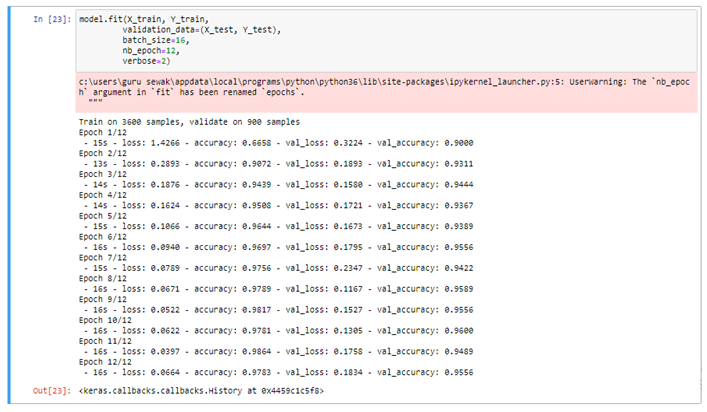
This output shows the loss decrease and the accuracy increase over time. At this point, one can experiment with the hyper-parameters and neural network architecture to get the best accuracy.

After getting the final model architecture, one can now take the model and use feed-forward passes and predict inputs. To start making predictions, one can use the testing dataset in the model that has been created previously. Keras enables one to make predictions by using the .predict() function.

Some points to be remembered while building a strong Neural Network

1. Adding Regularization to Fight Over-Fitting

The predictive models mentioned above are prone to a problem of overfitting. This is a scenario whereby the model memorizes the results in the training set and isn’t able to generalize on data that it hasn’t seen.

In neural networks, regularization is the technique that fights overfitting by adding a layer in the neural network. It can be done in 3 ways:

  • L1 Regularization
  • L2 Regularization
  • Dropout Regularization

Out of these, Dropout is a commonly used regularization technique. In every iteration, it adds a Dropout layer in the neural network and thereby, deactivates some neurons. The process of deactivating neurons is usually random.

2. Hyperparameter Tuning

Grid search is a technique that you can use to experiment with different model parameters to obtain the ones that give you the best accuracy. This is done by trying different parameters and returning those that give the best results. It helps in improving model accuracy.

Conclusion

Neural Network is coping with the fast pace of the technology of the age remarkably well and thereby, inducing the necessity of courses like Neural Network Machine Learning PythonNeural Networks in Python course and more. Though these advanced technologies are just at their nascent stage, they are promising enough to lead the way to the future. 

In this article, Building and Training our Neural Network is shown. This simple Neural Network can be extended to Convolutional Neural Network and Recurrent Neural Network for more advanced applications in Computer Vision and Natural Language Processing respectively.

Reference Blogs:

https://keras.rstudio.com

https://www.khanacademy.org/math/precalculus/x9e81a4f98389efdf:matrices/x9e81a4f98389efdf:multiplying-matrices-by-matrices/v/matrix-multiplication-intro


Interested in a career in Data Analyst?

To learn more about Data Analyst with Advanced excel course – Enrol Now.
To learn more about Data Analyst with R Course – Enrol Now.
To learn more about Big Data Course – Enrol Now.

To learn more about Machine Learning Using Python and Spark – Enrol Now.
To learn more about Data Analyst with SAS Course – Enrol Now.
To learn more about Data Analyst with Apache Spark Course – Enrol Now.
To learn more about Data Analyst with Market Risk Analytics and Modelling Course – Enrol Now.

Deep Learning and its Progress as Discussed at Intel’s AI Summit

Deep Learning and its Progress as Discussed at Intel’s AI Summit

At the latest AI summit organized by Intel, Mr. Naveen Rao, Vice President and General Manager of Intel’s AI Products Group, focused on the most vibrant age of computing that is the present age we are living. According to Rao, the widespread and sudden growth of neural networks is putting the capability of the hardware into a real test. Therefore, we now have to reflect deeply on “how processing, network, and memory work together” to figure a pragmatic solution, he said.

The storage of data has seen countless improvements in the last 20 years. We can now boast of our prowess of handling considerably large sets of data, with greater computing capability in a single place. This led to the expansion of the neural network models with an eye on the overall progress in neural Network Machine Learning Python and computing in general.

2

With the onset of exceedingly large data sets to work with, Deep learning for Computer Vision Course and the other models of Deep Learning to recognize speech, images, and text are extensively feeding on them. The technological giants were undoubtedly the early birds to grab the technical: the hardware and the software configuration to have an edge on the others.  

Surely, Deep Learning is on its peak now, where computers can identify the images with incredible vividness. On the other hand, chatbots can carry on with almost natural conversations with us. It is no wonder that the Deep learning Training Institutes all over the world are jumping in the race to bring all of these new technologies efficiently to the general mass.

The Big Problem

We are living in the dynamic age of AI and Machine Learning, with the biggies like Google, Facebook, and its peers, having the technical skills and configuration to take up the challenges. However, the neural networks have fattened up so much lately that it has already started to give the hardware a tough time, getting the better of them all the time.

Deep Learning and AI using Python

The number of parameters of the Neural network models is increasing as never before. They are “actually increasing on the order of 10x year on year”, as per Rao. Thus, it is a wall looming in AI. Though Intel is trying its best to tackle this obvious wall, which might otherwise give the industry a severe setback, with extensive research to bring new chip architectures and memory technologies into play, it cannot solve the AI processing problem single-handedly. Rao concluded on a note of requesting the partners in the present competitive scenario.


Sourced from: www.datanami.com/2019/11/13/deep-learning-has-hit-a-wall-intels-rao-says


Interested in a career in Data Analyst?

To learn more about Data Analyst with Advanced excel course – Enrol Now.
To learn more about Data Analyst with R Course – Enrol Now.
To learn more about Big Data Course – Enrol Now.

To learn more about Machine Learning Using Python and Spark – Enrol Now.
To learn more about Data Analyst with SAS Course – Enrol Now.
To learn more about Data Analyst with Apache Spark Course – Enrol Now.
To learn more about Data Analyst with Market Risk Analytics and Modelling Course – Enrol Now.

How progressive is an Artificial Neural Network? Tracking ANNs

How progressive is an Artificial Neural Network? Tracking ANNs

The major improvements that Artificial Neural Network is bringing about in favour of deep learning for computer vision with Python are ground-breaking. Machine vision, in general, is hugely benefitted with the inclusion of the computer vision course Pythonspurred by the all-new technology of Neural Networks. This is by and large a huge advancement in the field of computer science and gives much of an insight into what the future holds for us.

However, along with an array of experiments that are performed day in day out with Neural Network Machine Learning Python, numerous other fields are also likely to be revamped in much the same way. Predicting the weather, studying animals and other critical studies of cosmology are also believed to be easing soon holding the hands of the Artificial Neural Network technology.

2

Some Well-known Feats of the Artificial Neural Network

Artificial Neural networks (ANNs) are used in studying the patterns, relationships from the collected data just like humans. Going by the name, ANNs are modelled on the neural networks found in our brains, which are used to infuse the machines with the ability to learn by them. Besides, ANNs have been hugely successful in bringing about the concept of self-driving cars, boosting medical technology and numerous other fields. But, here we lay down some other fields which are soaking in the Artificial Neural Network extensively.

Meteorology

The accurate prediction of hailstorms and providing relevant alerts to the specific areas are expected to boost shortly. With the inclusion of Convolutional neural networks, (CNNs) the study of meteorology is deemed to achieve new heights. Besides, this improved technology would also be capable of identifying the size of the hails during this storm.

Tracking Bird Migration

We are all aware of the phenomenon of migration for the birds. But with the changing age, the routes of the birds are also different from what they used to be. However, if you need to track the migration of the birds, you can opt for the exclusive Neural Networks in Python course.

Deep Learning and AI using Python

Interpreting the Dark Matter

Dark matter has been a topic which remains largely unexplored till date. Nothing beyond the name and the fact that it binds the universe together is brought to light. However, with the marked progress of the premium institutes like the Neural Networks Training in Delhithe dark matter will no longer be a mystery.


Interested in a career in Data Analyst?

To learn more about Data Analyst with Advanced excel course – Enrol Now.
To learn more about Data Analyst with R Course – Enrol Now.
To learn more about Big Data Course – Enrol Now.

To learn more about Machine Learning Using Python and Spark – Enrol Now.
To learn more about Data Analyst with SAS Course – Enrol Now.
To learn more about Data Analyst with Apache Spark Course – Enrol Now.
To learn more about Data Analyst with Market Risk Analytics and Modelling Course – Enrol Now.

Straight Out of College? Grasp These Killer Data Science Skills

Straight Out of College? Grasp These Killer Data Science Skills

Data Science is one of the most demanding fields in the present world. Going hand in hand with the Artificial Intelligence, Data Science is showing a colossal growth in the coming years. So, honestly speaking, you should be prepared with all of the cutting-edge tools and up skill yourself accordingly to pace up with the modern world.

According to Derek Steer, CEO of Mode, the world will generate 50 times more data than what we were present in 2011. Moreover, with the data processing power becoming easy and inexpensive for most of the firms, candidates with real skill and a hunger for knowledge would only see their way through till the end, added Steer.

Among various other skills like retail analytics using Python, neural network machine learning Python, which are dominating and/or expected to rule the world of technology in the upcoming years, here we list you some of them:

2

Data Visualization

This is one of the top notch skills that you can find now. It is process of maintaining data with the help of graphical representations. This further makes the interpretation and thereby, the comprehension of data, much easier.

This is an extremely relevant skill which is not to be found among the high schoolers. This makes the undergraduates or post graduates with the knowhow of data visualisation all the more important everywhere.

Data Modelling

Data Modelling is the second most wanted skill that the entire world is seeking for. In a nutshell, Data Modelling is the process of understanding and using data to seek relationships across varied sets of information.

It is, in fact, a skill which is gaining an immense popularity among the fresh graduates. You can also reach Dexlab Analytics to gain an insight of all the industry relevant courses and enrol yourself asap to speed up your career!

Deep Learning and AI using Python

Python

Python is undoubtedly the most demanding language ever in the history of computer science; hence, it enjoys all the attention that it gets.

With its welcoming nature to every other architecture, which is in sharp contradiction to Java and C++, Python is preferred all the way. Secondly, Python is quite a powerful language and effective too, when it comes to bulk data and a need to process them faster.

It is basically an open source program which is easy accessible and largely customised. This is really a gift for upcoming world of Data Science. Thus, Python for data analysis is an invaluable skill that you can develop to make yourself marketable like never before.

We hope you liked our post! You can Take A Deep Look On How Machine Learning Boosts Business Growth! and more such topics on our website.


Interested in a career in Data Analyst?

To learn more about Data Analyst with Advanced excel course – Enrol Now.
To learn more about Data Analyst with R Course – Enrol Now.
To learn more about Big Data Course – Enrol Now.

To learn more about Machine Learning Using Python and Spark – Enrol Now.
To learn more about Data Analyst with SAS Course – Enrol Now.
To learn more about Data Analyst with Apache Spark Course – Enrol Now.
To learn more about Data Analyst with Market Risk Analytics and Modelling Course – Enrol Now.

Statistical Application of R & Python: Know Skewness & Kurtosis and Calculate it Effortlessly

Statistical Application of R & Python: Know Skewness & Kurtosis and Calculate it Effortlessly

This is a blog which shall widen your approach on the Statistical Application using R & Python. You perhaps already have been calculating Geometric Mean using R & Python and are already aware of the Application of Harmonic Mean using R & Python. However, if you are eager to further your knowledge about Skewness & Kurtosis and interested to know of their application using R and Python, then this is the right place.

Skewness:

Skewness is a metric which tells us about the location of my dataset. That is, if you want to know where most of the values are concentrated on an ascending scale.

Skewness is of two kinds: Positive skew and Negative skew. A positively skewed dataset will have most of the values concentrated at the beginning of the scale. Eg: If a woman is asked to rate 100 tinder profiles based on the looks on a scale of 1 – 10, 1 being the ugliest and 10 being the most handsome. Then the resulting ratings will be positively skewed. This is to say that women are harsh critiques of looks.

Now, consider another example: Say if the wealth of the 1% richest people were to be plotted on a scale of say $0 – $200 billion. Then, most of the values will be concentrated at the end of the scale. This will be an example of a negatively skewed dataset.

In essence, skewness is the third central moment about mean and gives us a feel for the location of the data set values. It is recommended to go through STATISTICAL APPLICATION IN R & PYTHON: CHAPTER 1 – MEASURE OF CENTRAL TENDENCY to have an understanding of the Central Tendency and its measures. Having no skewness will mean the data set is fairly symmetrical and has a bell shaped curve.

Where n is the sample size, Xi is the ith X value, X is the average and S is the sample standard deviation.  Note the exponent in the summation.  It is “3”.

Kurtosis:

Kurtosis is a statistical measure that’s used to describe, or Skewness, of observed data around the mean, sometimes referred to as the volatility to volatility. Kurtosis is used generally in the statistical field to describe trends in charts. Kurtosis can be present in a chart with fat tails and a low, even distribution, as well as be present in a chart with skinny tails and a distribution concentrated toward the mean.

Kurtosis for a normal distribution is 3.  Most software packages use the formula:


The types of kurtosis are:-


Application:

A person tries to analyze last 12months interest rate of the investment firm to understand the risk factor for the future investment.

The interest rates are:

12.05%, 13%, 11%, 18%, 10%, 11.5%, 15.08%, 21%, 6%, 8%, 13.2%, 7.5%.

Here is the table:

Months

(One Year)

Interest

Rate (%)

April12.05
May13
June11
July18
August10
September11.5
October15.08
November21
December6
January8
February13.2
March7.5


Calculate skewness & Kurtosis in R:

Calculate skewness & Kurtosis in R:
Calculating the Skewness & Kurtosis of interest rate in R, we get the positive skewed value, which is near to 0. The skewness of the interest rate is 0.5585253.

The kurtosis of the interest rate is 2.690519

Kurtosis is less than 3, so this is Platykurtic distribution.

Calculate Skewness & Kurtosis in Python:

Calculate Skewness & Kurtosis in Python:
Calculating the Skewness & Kurtosis of interest rate in Python, we get the positive skewed value and near from 0. The skewness of the interest rate is 0.641697.

The kurtosis of the interest rate is 0.241602.

Kurtosis is less than 3, so this is Platykurtic distribution.

Conclusion:

Firstly, according to the output of the data the value is positively skewed(R & Python), positive skewness indicates a distribution with an asymmetric tail extending toward more positive values.

And the kurtosis is less than 3 (R & Python), it is a platykurtic distribution. Positive kurtosis indicates a relatively peaked distribution. And the distribution is light tails.

Secondly, the value of the skewness and kurtosis are different in R and Python, but the actual effects are more or less the same. The results are different because skewness and kurtosis are calculated with different formulae or method for the measurement like Bowley’s measure, Pearson’s(First, Second) measures, Fisher’s measure & Moment’s measure. And different software (ex. R, Python, SAS, Excel etc) using different processes to calculate skewness & kurtosis brings the same ultimate result. The numerical values change only when the numbers are also changed. So, we sometimes get different results.

2

There are numerous other blogs that you can follow with Dexlab Analytics. Also, if you want to explore computer vision course Python, neural network machine learning Python and more extensive courses on R & Python, then you can also join us and boost both your passion and career.


Interested in a career in Data Analyst?

To learn more about Data Analyst with Advanced excel course – Enrol Now.
To learn more about Data Analyst with R Course – Enrol Now.
To learn more about Big Data Course – Enrol Now.

To learn more about Machine Learning Using Python and Spark – Enrol Now.
To learn more about Data Analyst with SAS Course – Enrol Now.
To learn more about Data Analyst with Apache Spark Course – Enrol Now.
To learn more about Data Analyst with Market Risk Analytics and Modelling Course – Enrol Now.

Call us to know more