marketing analytics course in delhi Archives - DexLab Analytics | Big Data Hadoop SAS R Analytics Predictive Modeling & Excel VBA

Time Series Analysis & Modelling with Python (Part II) – Data Smoothing

dexlab_time_series

Data Smoothing is done to better understand the hidden patterns in the data. In the non- stationary processes, it is very hard to forecast the data as the variance over a period of time changes, therefore data smoothing techniques are used to smooth out the irregular roughness to see a clearer signal.

In this segment we will be discussing two of the most important data smoothing techniques :-

  • Moving average smoothing
  • Exponential smoothing

Moving average smoothing

Moving average is a technique where subsets of original data are created and then average of each subset is taken to smooth out the data and find the value in between each subset which better helps to see the trend over a period of time.

Lets take an example to better understand the problem.

Suppose that we have a data of price observed over a period of time and it is a non-stationary data so that the tend is hard to recognize.

QTR (quarter)Price
110
211
318
414
515
6?


In the above data we don’t know the value of the 6th quarter.

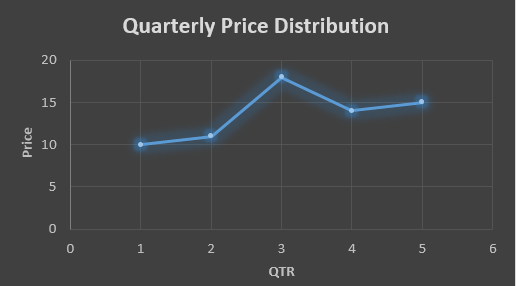
….fig (1)

The plot above shows that there is no trend the data is following so to better understand the pattern we calculate the moving average over three quarter at a time so that we get in between values as well as we get the missing value of the 6th quarter.

To find the missing value of 6th quarter we will use previous three quarter’s data i.e.

MAS =  = 15.7

QTR (quarter)Price
110
211
318
414
515
615.7

MAS =  = 13

MAS =  = 14.33

QTR (quarter)PriceMAS (Price)
11010
21111
31818
41413
51514.33
615.715.7


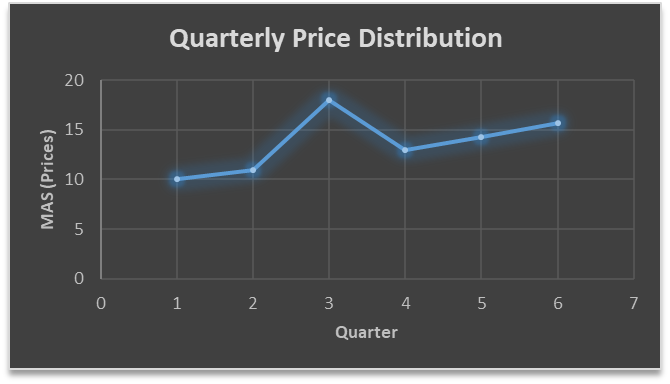
….. fig (2)

In the above graph we can see that after 3rd quarter there is an upward sloping trend in the data.

Exponential Data Smoothing

In this method a larger weight ( ) which lies between 0 & 1 is given to the most recent observations and as the observation grows more distant the weight decreases exponentially.

The weights are decided on the basis how the data is, in case the data has low movement then we will choose the value of  closer to 0 and in case the data has a lot more randomness then in that case we would like to choose the value of  closer to 1.

EMA= Ft= Ft-1 + (At-1 – Ft-1)

Now lets see a practical example.

For this example we will be taking  = 0.5

Taking the same data……

QTR (quarter)Price

(At)

EMS Price(Ft)
11010
211?
318?
414?
515?
6??


To find the value of yellow cell we need to find out the value of all the blue cells and since we do not have the initial value of F1 we will use the value of A1. Now lets do the calculation:-

F2=10+0.5(10 – 10) = 10

F3=10+0.5(11 – 10) = 10.5

F4=10.5+0.5(18 – 10.5) = 14.25

F5=14.25+0.5(14 – 14.25) = 14.13

F6=14.13+0.5(15 – 14.13)= 14.56

QTR (quarter)Price

(At)

EMS Price(Ft)
11010
21110
31810.5
41414.25
51514.13
614.5614.56

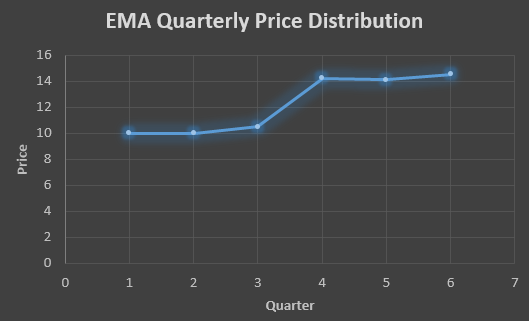
In the above graph we see that there is a trend now where the data is moving in the upward direction.

So, with that we come to the end of the discussion on the Data smoothing method. Hopefully it helped you understand the topic, for more information you can also watch the video tutorial attached down this blog. The blog is designed and prepared by Niharika Rai, Analytics Consultant, DexLab Analytics DexLab Analytics offers machine learning courses in Gurgaon. To keep on learning more, follow DexLab Analytics blog.


.
How Customer Data Analytics Can Help Drive Business Success?

How Customer Data Analytics Can Help Drive Business Success?

The customers are the backbone of a successful organization. No longer does one-size-fits-all kind of advertising or price-based competition reap results. Today, if you want a thriving business, customer interaction is the key. Building relationships based on that interaction will get you going.

Nevertheless, this isn’t enough. To survive in this contemporary competitive world, enterprises need data-driven, powerful insights that will help them comprehend their customers’ needs. The world is rapidly developing and so is the technology domain. Tech bigwigs, including Airbnb and Uber, are utilizing the nuanced concept of data analysis to reshape their way of interaction with the customers; so let’s dive down to know how they are putting their customer’s first and leveraging data analytics in a collective manner.

2

Segmentation

This step divides customer data into segments, for example, age, location, buying pattern, product usage, etc. It helps in messaging information to particular groups interested in particular activities. Tailor-made marketing strategies are in demand.

Segmentation also helps you decide which group is profitable and which isn’t. This way, you and your organization won’t end up wasting money on sections that are not likely to yield conversions.

Product Development

To stay ahead of the curve, your products need to be customized. This is done by gathering customer data from detailed reports or with the help of A/B testing.  You can also look up to customer feedback. It helps in determining chances for innovation and gauges the efficacy levels of the products.

Companies, such as Amazon and Netflix use data analytics effectively to understand the preferences of customers and craft recommendation list accordingly.

Agility

Instead of finding new customers, the companies are now focusing more on customer retention. In order to do so, the company executives are channelizing resources to keep their existing customers loyal to them. Nevertheless, this is no mean feat. A recent report has found out that two-thirds of the B2B customer base or even more are currently at risk. Hence, customer retention is a better alternative than luring newer customers.  

Innovation

For data-obsessed people, innovation is the lifeblood for their success. However, it has resulted in disrupting several established companies and industries. Use of chatbots, AI and apps has sparked a phenomenal change in the technology landscape.  Autonomous Vehicles are one of the best examples of disruptive technology, which is a brainchild of Tesla, Google and other path-breaking companies.

Insights Turned into Actions

Irrespective of the industry you work at, customer data analytics helps you tap into your customer’s choices and behaviors and predict how that pattern is going to modify in the future. It might aid you in understanding why customers leave giving you enough room to target retention programs at those who are at more risk of leaving.

No wonder, more and more companies are becoming data-centric. Nevertheless, out of all, very few have actually worked out the best way to use the data and hit notes of business success. Remember, insights are only effective when they trigger change!

Are you interested in customer analytics? Want to enroll in a good marketing analytics certification course? DexLab Analytics is here for help! Feel free to drop by their website and send enquiries. The expert team of the institute will be happy to guide you.


The blog first appeared in ― www.entrepreneur.com/article/310001


Interested in a career in Data Analyst?

To learn more about Data Analyst with Advanced excel course – Enrol Now.
To learn more about Data Analyst with R Course – Enrol Now.
To learn more about Big Data Course – Enrol Now.

To learn more about Machine Learning Using Python and Spark – Enrol Now.
To learn more about Data Analyst with SAS Course – Enrol Now.
To learn more about Data Analyst with Apache Spark Course – Enrol Now.
To learn more about Data Analyst with Market Risk Analytics and Modelling Course – Enrol Now.

Customer Analytics: A Basic Introduction

Customer Analytics: A Basic Introduction

Customer Analytics is today’s hottest kid on the block, especially for executives. In simple terms, customer analytics is the process of analyzing and evaluating a flood of data that is being collected every day from every possible and probable customer standpoint. This customer data is then used in building superior predictive models to ascertain who the best customers for the retailer are, where he can find this kind of customer base and the value-potential these customers possess – either in terms of visits or dollars.

Customer data provides valuable and actionable insights that help retailers in executing their future marketing and real estate strategies. Put simply, it basically uses the past to predict the future.

Inadequate Customer Data: The Problem

No wonder, Customer Analytics is indeed a wonderful tool yet it’s not as simple as it sounds. Basically, collecting and determining data is an expensive affair as well as time-consuming. However, it is an absolute necessity. If not this, the retailers won’t be able to realize the potentials of customer analytics to the fullest.

However, most of the retailers, at least 60% of the lot don’t have access to data or they possess unreliable data. Generally speaking, an average company’s data is nearly 55% accurate and 14 months old, which makes the data fundamentally useless.

Faulty data skews customer profiles – resulting in lost opportunities, escalating costs, poor use of analytic solutions, dwindling numbers of customers – effectively costing retailers $700 billion annually.

Interestingly, the companies that have mastered the art of Customer Analytics are 7.4 times more likely to outdo their rivals in terms of sales, 6.5 times more likely to retain existing customers and approximately 19 times more likely to hit above-average profitability.

2

Why Use Customer Analytics?

While there are retailers who have just grazed the layers of customer insights, you will find another set of retailers who are successfully utilizing the treasure trove of customer data merging analytics into it and identifying crucial information that leads to streamlining operations, accelerating productivity, personalizing marketing initiatives in accordance to both current and potential customers. This yields better profitability and detects locations where retailers can open new shops and target new customers.

With such intense market competition, retailers need to outnumber their tailing rivals and for that, they have to leverage the power of customer analytics. Instead of being an option, it has now become a necessity. So, say thanks to Customer Analytics, because of it, retailers are in a position to greatly enhance their potentials to target the right customers at the right time in the right place and in the most effective way.

If you are interested in customer marketing analytics courses in Delhi, feel free to reach us at DexLab Analytics. We offer excellent marketing analytics certification courses to the interested candidates at amazing prices! Contact us now.


The blog has been sourced from ―  www.buxtonco.com/blog/what-is-customer-analytics


Interested in a career in Data Analyst?

To learn more about Data Analyst with Advanced excel course – Enrol Now.
To learn more about Data Analyst with R Course – Enrol Now.
To learn more about Big Data Course – Enrol Now.

To learn more about Machine Learning Using Python and Spark – Enrol Now.
To learn more about Data Analyst with SAS Course – Enrol Now.
To learn more about Data Analyst with Apache Spark Course – Enrol Now.
To learn more about Data Analyst with Market Risk Analytics and Modelling Course – Enrol Now.

Risk Analytics Market: Serious Growth Rate Projection for 2017-2021

Want to get to the core of understanding risk within various business frameworks? The answer is Risk Analytics. This new breed of data analytics facilitates organizations in precisely defining, recognizing and managing their risk, and its need is going to increase in the coming few years. New developments in risk analytics are gaining limelight and bringing a notable transformation in the market, while enhancing its overall capability.

 
Risk Analytics Market: Serious Growth Rate Projection for 2017-2021
 

Recently, a team of analysts had eureka moment – they introduced a new concept of real-time risk analytics – it is nothing but a modern, more advanced version of traditional risk analytics methods. Here, the prediction is based on real-time data – it processes, examines and determines risk all on a real-time basis – hence top notch financial institutions are putting real-time risk analytics to best use to manage and mitigate associated risks. Several asset management, portfolio management and hedge fund firms, and investment banks are relying on this mode of risk analytics to modify their operating principles to play in accordance with investment and market shifts.

Continue reading “Risk Analytics Market: Serious Growth Rate Projection for 2017-2021”

Explaining the Everlasting Bond between Data and Risk Analytics

Explaining the Everlasting Bond between Data and Risk Analytics


The use of data analytics is robustly expanding in the financial sector – and the risk landscape is changing pretty fast. Every day a new innovation in the field of risk analytics is making its way, and sometimes some new risks and its respective strategies are popping up just around the corner. The rise of big data, artificial intelligence and advanced analytics helps companies gain valuable cognizance from data. Computing power, the Internet of Things, drones and machine learning are some of the latest new-age tools to assist companies in taking better decisions, hence increase future profitability. Alike, risk managers implement market risk analytics and big data to manage their day-to-day work activities, while identifying, ascertaining and mitigating risks.

Continue reading “Explaining the Everlasting Bond between Data and Risk Analytics”

Call us to know more