Market Risk Modelling interactive session Archives - DexLab Analytics | Big Data Hadoop SAS R Analytics Predictive Modeling & Excel VBA

ARIMA (Auto-Regressive Integrated Moving Average)

arima-time series-dexlab analytics

This is another blog added to the series of time series forecasting. In this particular blog  I will be discussing about the basic concepts of ARIMA model.

So what is ARIMA?

ARIMA also known as Autoregressive Integrated Moving Average is a time series forecasting model that helps us predict the future values on the basis of the past values. This model predicts the future values on the basis of the data’s own lags and its lagged errors.

When a  data does not reflect any seasonal changes and plus it does not have a pattern of random white noise or residual then  an ARIMA model can be used for forecasting.

There are three parameters attributed to an ARIMA model p, q and d :-

p :- corresponds to the autoregressive part

q:- corresponds to the moving average part.

d:- corresponds to number of differencing required to make the data stationary.

In our previous blog we have already discussed in detail what is p and q but what we haven’t discussed is what is d and what is the meaning of differencing (a term missing in ARMA model).

Since AR is a linear regression model and works best when the independent variables are not correlated, differencing can be used to make the model stationary which is subtracting the previous value from the current value so that the prediction of any further values can be stabilized .  In case the model is already stationary the value of d=0. Therefore “differencing is the minimum number of deductions required to make the model stationary”. The order of d depends on exactly when your model becomes stationary i.e. in case  the autocorrelation is positive over 10 lags then we can do further differencing otherwise in case autocorrelation is very negative at the first lag then we have an over-differenced series.

The formula for the ARIMA model would be:-

To check if ARIMA model is suited for our dataset i.e. to check the stationary of the data we will apply Dickey Fuller test and depending on the results we will  using differencing.

In my next blog I will be discussing about how to perform time series forecasting using ARIMA model manually and what is Dickey Fuller test and how to apply that, so just keep on following us for more.

So, with that we come to the end of the discussion on the ARIMA Model. Hopefully it helped you understand the topic, for more information you can also watch the video tutorial attached down this blog. The blog is designed and prepared by Niharika Rai, Analytics Consultant, DexLab Analytics DexLab Analytics offers machine learning courses in Gurgaon. To keep on learning more, follow DexLab Analytics blog.


.
Autocorrelation- Time Series – Part 3

Autocorrelation is a special case of correlation. It refers to the relationship between successive values of the same variables .For example if an individual with a consumption pattern:-

spends too much in period 1 then he will try to compensate that in period 2 by spending less than usual. This would mean that Ut is correlated with Ut+1 . If it is plotted the graph will appear as follows :

Positive Autocorrelation : When the previous year’s error effects the current year’s error in such a way that when a graph is plotted the line moves in the upward direction or when the error of the time t-1 carries over into a positive error in the following period it is called a positive autocorrelation.
Negative Autocorrelation : When the previous year’s error effects the current year’s error in such a way that when a graph is plotted the line moves in the downward direction or when the error of the time t-1 carries over into a negative error in the following period it is called a negative autocorrelation.

Now there are two ways of detecting the presence of autocorrelation
By plotting a scatter plot of the estimated residual (ei) against one another i.e. present value of residuals are plotted against its own past value.

If most of the points fall in the 1st and the 3rd quadrants , autocorrelation will be positive since the products are positive.

If most of the points fall in the 2nd and 4th quadrant , the autocorrelation will be negative, because the products are negative.
By plotting ei against time : The successive values of ei are plotted against time would indicate the possible presence of autocorrelation .If e’s in successive time show a regular time pattern, then there is autocorrelation in the function. The autocorrelation is said to be negative if successive values of ei changes sign frequently.
First Order of Autocorrelation (AR-1)
When t-1 time period’s error affects the error of time period t (current time period), then it is called first order of autocorrelation.
AR-1 coefficient p takes values between +1 and -1
The size of this coefficient p determines the strength of autocorrelation.
A positive value of p indicates a positive autocorrelation.
A negative value of p indicates a negative autocorrelation
In case if p = 0, then this indicates there is no autocorrelation.
To explain the error term in any particular period t, we use the following formula:-

Where Vt= a random term which fulfills all the usual assumptions of OLS
How to find the value of p?

One can estimate the value of ρ by applying the following formula :-

Time Series Analysis & Modelling with Python (Part II) – Data Smoothing

dexlab_time_series

Data Smoothing is done to better understand the hidden patterns in the data. In the non- stationary processes, it is very hard to forecast the data as the variance over a period of time changes, therefore data smoothing techniques are used to smooth out the irregular roughness to see a clearer signal.

In this segment we will be discussing two of the most important data smoothing techniques :-

  • Moving average smoothing
  • Exponential smoothing

Moving average smoothing

Moving average is a technique where subsets of original data are created and then average of each subset is taken to smooth out the data and find the value in between each subset which better helps to see the trend over a period of time.

Lets take an example to better understand the problem.

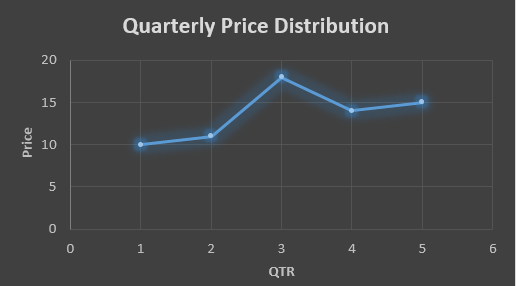
Suppose that we have a data of price observed over a period of time and it is a non-stationary data so that the tend is hard to recognize.

QTR (quarter)Price
110
211
318
414
515
6?


In the above data we don’t know the value of the 6th quarter.

….fig (1)

The plot above shows that there is no trend the data is following so to better understand the pattern we calculate the moving average over three quarter at a time so that we get in between values as well as we get the missing value of the 6th quarter.

To find the missing value of 6th quarter we will use previous three quarter’s data i.e.

MAS =  = 15.7

QTR (quarter)Price
110
211
318
414
515
615.7

MAS =  = 13

MAS =  = 14.33

QTR (quarter)PriceMAS (Price)
11010
21111
31818
41413
51514.33
615.715.7


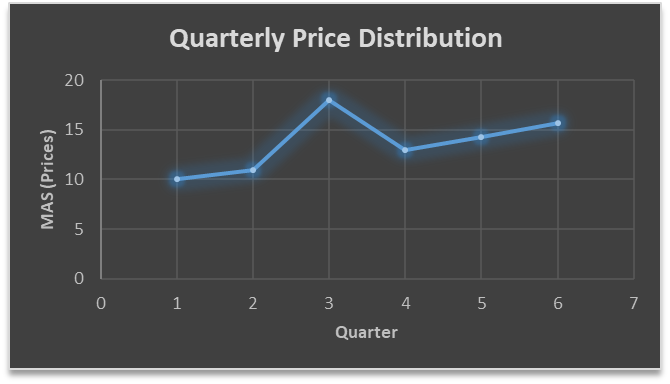
….. fig (2)

In the above graph we can see that after 3rd quarter there is an upward sloping trend in the data.

Exponential Data Smoothing

In this method a larger weight ( ) which lies between 0 & 1 is given to the most recent observations and as the observation grows more distant the weight decreases exponentially.

The weights are decided on the basis how the data is, in case the data has low movement then we will choose the value of  closer to 0 and in case the data has a lot more randomness then in that case we would like to choose the value of  closer to 1.

EMA= Ft= Ft-1 + (At-1 – Ft-1)

Now lets see a practical example.

For this example we will be taking  = 0.5

Taking the same data……

QTR (quarter)Price

(At)

EMS Price(Ft)
11010
211?
318?
414?
515?
6??


To find the value of yellow cell we need to find out the value of all the blue cells and since we do not have the initial value of F1 we will use the value of A1. Now lets do the calculation:-

F2=10+0.5(10 – 10) = 10

F3=10+0.5(11 – 10) = 10.5

F4=10.5+0.5(18 – 10.5) = 14.25

F5=14.25+0.5(14 – 14.25) = 14.13

F6=14.13+0.5(15 – 14.13)= 14.56

QTR (quarter)Price

(At)

EMS Price(Ft)
11010
21110
31810.5
41414.25
51514.13
614.5614.56

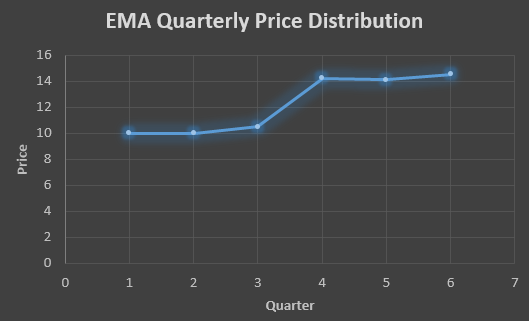
In the above graph we see that there is a trend now where the data is moving in the upward direction.

So, with that we come to the end of the discussion on the Data smoothing method. Hopefully it helped you understand the topic, for more information you can also watch the video tutorial attached down this blog. The blog is designed and prepared by Niharika Rai, Analytics Consultant, DexLab Analytics DexLab Analytics offers machine learning courses in Gurgaon. To keep on learning more, follow DexLab Analytics blog.


.
The Future of Risk Management: Triggering a Technology Dividend

The Future of Risk Management: Triggering a Technology Dividend

Many factors are constantly shaping and reshaping the structure of risk management today – including global geopolitical inconsistency, macroeconomic headwinds and increasing number of cyber activities – which is extensively damaging and recurring. All this is leading to elevated risk perceptions.

The nature of risks has changed over the years too, as well as the manner of addressing them. Today, to mitigate risk issues, technology plays a crucial role. Headwinds like global and Asian accelerating debt levels, lower projection of productivity growth, increasing levels of policy uncertainty and constant increase of US interest have created a lot of prominent macroeconomic challenges, especially in export-oriented Asian economies. Topping that, budding risks from technological advancements are on the rise, exposing industries to newer challenges like cybersecurity and data fraud.

Explaining the Everlasting Bond between Data and Risk Analytics – @Dexlabanalytics.

As a result, the regulatory scenario of the world is also changing, especially after the global financial crisis. With a wide array of regulations introduced, the issue of risk management has started getting the desired prominence. These increasing regulations have compelled banks to accelerate their compliance activities, while giving increasing pressure on risk-management policymaking. The risk management teams now need to be constantly on a lookout for newer uncertainties – the key to address this concern remains productivity gains, but for that technology needs to be employed to the vast extent.

Cyber Value-at-Risk Model: Quantifying the Value-at-Risk – @Dexlabanalytics.

Hitting a technology dividend

Advanced data analytics, contemporary data and NLP coupled with process digitization offers new robust opportunities for effective market risk management. The technological opportunities can be realized throughout various key functions and levels, but it is the duty of the risk professionals to chalk out a more affordable and fruitful approach to address risk-related issues.

A New Course Alert! DexLab Analytics Launches Market Risk Analytics and Modelling – @Dexlabanalytics.

Check out these 3 principal levers to nab potential opportunities:

Data – Data is the new powerful combat weapon. Financial institutions consist of huge piles of data, where internal and external sources of data continuously pour in at an accelerating rate.  Data, in every form – including transaction, social media, and other sources helps discover real-time customer insights and generate dividends thereafter.

Analytics – Nowadays, machine learning, NLP, advanced analytics and self-learning algorithms are widely available and at achievable prices. The best example to show how advanced analytics is boosting risk management is improving debt collection.

As per conventional debt repayment collection procedure, a lot many calls were asked to make, out of which very few turned out to be successful. But now, with advanced analytics, a set of high-end predictive models are developed to fire up decision-making process. After this, an improved insight about customers can be curated, which can further be developed with better prediction quality.

Processes – With digitization, one gets the opportunity to automate and design risk-monitoring processes to mitigate emerging risks. Nowadays, several financial institutions are implementing machine learning and transaction data to automate monitoring of conduct risk.

Subject to the extent of digitization, the change in factors for risk organization is proposed – in the beginning of digitization, one expects 15-20 percent efficiency gains, while a 60-70% improvement is to be expected in case of a fully digitized risk function, which is quite a show!

Market Risk Analytics: What It is All About – @Dexlabanalytics.

Do you want to know more about market risk modelling techniques? Drop by DexLab Analytics; being a one-stop-destination for Market Risk Modelling using SAS, it boasts of superior training and well-researched study materials.


Interested in a career in Data Analyst?

To learn more about Data Analyst with Advanced excel course – Enrol Now.
To learn more about Data Analyst with R Course – Enrol Now.
To learn more about Big Data Course – Enrol Now.

To learn more about Machine Learning Using Python and Spark – Enrol Now.
To learn more about Data Analyst with SAS Course – Enrol Now.
To learn more about Data Analyst with Apache Spark Course – Enrol Now.
To learn more about Data Analyst with Market Risk Analytics and Modelling Course – Enrol Now.

Cyber Value-at-Risk Model: Quantifying the Value-at-Risk

Cyber Value-at-Risk Model: Quantifying the Value-at-Risk

Cybersecurity attacks are the new potent threat to businesses. Diligent professionals and big mouth board members have started reviewing their company’s cybersecurity frameworks, while establishing better security controls and discerning deeper insights about the business impact of cybersecurity attacks: what kind of risks are they exposed to? Are they expending too much and need to curtail down? What amount of risk can be reduced using the proposed info security budget? Cyber-insurance, will it fetch better results?

What objectives to secure with Cyber value-at-risk models?

This is the epic question that has triggered the development of Value-at-risk models, especially in the domain of information security. Also known as Cyber VaR, these models are a game-changer. They offer a sound base for quantification of information risk coupled with infusing discipline into the whole process.

Market Risk Analytics: What It is All About – @Dexlabanalytics.

The objective of VaR is:

  • To help risk professionals formulate the notion of cyber risk in plain financial language without using any technical jargons.
  • To enable business professionals achieve a standard balance between safeguarding an organization and running the business by making cost-effective decisions.

Enterprises powered by VaR models for cybersecurity make complicated decision-making as easy as pie. They trigger risk-related discussions, where risks become more consistent, and business-goal driven.

A New Course Alert! DexLab Analytics Launches Market Risk Analytics and Modelling – @Dexlabanalytics.

What exactly is cyber VaR?

In the world of finance, value-at-risk modeling is the statistical methodology to appraise the level of financial risk that a firm is exposed to over a specific period of time.

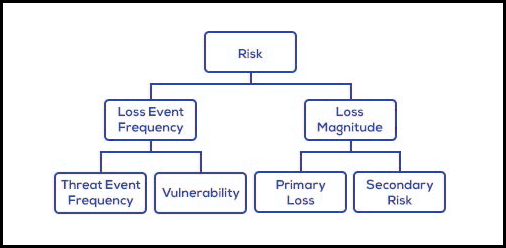
The VaR is ascertained using these three variables:

  • The amount of conjectured loss
  • The probability of that amount of loss
  • The time frame

Probabilities are effective to evaluate likely losses from the cyber attacks during a specific time period. Top notch global organizations, like World Economic Forum and several regulatory bodies, like The Open Group are revolutionizing the concept of cyber VaR models.

fi1-2

What is its benefit?

VaR was initially developed in 1990’s to boost the investment banking sector, wherein managers were to identify the risks that popped up daily in multiple market reports. From the name itself, you can understand, it is more likely a measurement tool to analyze the financial impact of risky events within a particular time frame.

The most beneficial effect of VaR is that it not only quantifies risk but also pens it down in economic terms that are easily understood by all. It also assists in mitigating long-term challenges by aggregating cyberrisk with various other operational risks within an enterprise risk management system.

Here’s All You Need to Know about DexLab Analytics’ Market Risk Modelling Live Demo Session – @Dexlabanalytics.

How to determine the value of cyber VaR?

 CISOs, Chief information security officers decipher what exactly VaR offers in terms of cyberrisk management. This hi-tech concept is too good to help with crucial decision-making, like addressing cyberrisk appetite and defining the optimal allocation of cyber risk management resources.

Market risk analytics is a new concept in the make. Many organizations have realized its crucial importance, while many are yet to decipher. For the best enterprise risk management certification, drop by DexLab Analytics. They are a leading economic capital model training institute offering state-of-the-art courses to the candidates.


Interested in a career in Data Analyst?

To learn more about Data Analyst with Advanced excel course – Enrol Now.
To learn more about Data Analyst with R Course – Enrol Now.
To learn more about Big Data Course – Enrol Now.

To learn more about Machine Learning Using Python and Spark – Enrol Now.
To learn more about Data Analyst with SAS Course – Enrol Now.
To learn more about Data Analyst with Apache Spark Course – Enrol Now.
To learn more about Data Analyst with Market Risk Analytics and Modelling Course – Enrol Now.

Here’s All You Need to Know about DexLab Analytics’ Market Risk Modelling Live Demo Session

DexLab Analytics brings Market Risk Modelling training to India. Internet has helped people become technology-driven. Digital transformation is evident all around us. No more, gaining knowledge is a task like moving mountains – right from the confinements of your home, you can now get access to a plethora of information and knowledge, thanks to online learning. Several professionals and students are opting for e-learning method of education, owing to its flexibility and ease of access. And India is not lagging behind in this. Several online classes and sessions are being organized by premier data science learning institutes in India, and DexLab Analytics is one of them. 

 
Here’s All You Need to Know about DexLab Analytics’ Market Risk Modelling Live Demo Session
 

DexLab Analytics is here with an intensive live demo session on Market Risk Modelling Online for free. The online workshop is taking place on 25th October, 2017 from 10:00PM IST onwards, and will solely focus on how Market Risk Analytics has grown to be the new in-demand analytics course for the financial sector. Our in-house trainers will extensively explain the nitty-gritty of MRM, including its importance, major components, and why is it a must-to-have skill for the future. The interested candidates are asked to register as soon as possible by penning down a mail to DexLab Analytics, mentioning they would attend the workshop on the specified date and time.

Continue reading “Here’s All You Need to Know about DexLab Analytics’ Market Risk Modelling Live Demo Session”

Banking Business and Banking Instruments-3: Mortgages

How to Leverage AI Strategy in Business?
 

In this blog we discuss the final banking instrument- Mortgages, for which models are developed extensively. A mortgage is a debt instrument, secured by the collateral of specified real estate property that the borrower is obliged to pay back with a pre-determined set of payments. Mortgages are used by individuals and businesses to make large real estate purchases without paying the entire value of the purchase upfront.


2


Mortgages are mainly of two types: (a) Traditional Mortgages (b) Adjusted Rate Mortgages.


Traditional Mortgage is a fixed rate mortgage, where the borrower pays the same a fixed rate of interest for the life of the mortgage. The monthly principal and the interest payments never change from the first payment to the last. Most fixed rate mortgages have a 15-30 year term. If the market interest rate rises, the borrowers’ payment does not change. If the market interest rate drops significantly, the borrower may secure the lower rate by re-financing the mortgage.

Continue reading “Banking Business and Banking Instruments-3: Mortgages”

Call us to know more