Market Analysis Archives - DexLab Analytics | Big Data Hadoop SAS R Analytics Predictive Modeling & Excel VBA

Autocorrelation- Time Series – Part 3

Autocorrelation is a special case of correlation. It refers to the relationship between successive values of the same variables .For example if an individual with a consumption pattern:-

spends too much in period 1 then he will try to compensate that in period 2 by spending less than usual. This would mean that Ut is correlated with Ut+1 . If it is plotted the graph will appear as follows :

Positive Autocorrelation : When the previous year’s error effects the current year’s error in such a way that when a graph is plotted the line moves in the upward direction or when the error of the time t-1 carries over into a positive error in the following period it is called a positive autocorrelation.
Negative Autocorrelation : When the previous year’s error effects the current year’s error in such a way that when a graph is plotted the line moves in the downward direction or when the error of the time t-1 carries over into a negative error in the following period it is called a negative autocorrelation.

Now there are two ways of detecting the presence of autocorrelation
By plotting a scatter plot of the estimated residual (ei) against one another i.e. present value of residuals are plotted against its own past value.

If most of the points fall in the 1st and the 3rd quadrants , autocorrelation will be positive since the products are positive.

If most of the points fall in the 2nd and 4th quadrant , the autocorrelation will be negative, because the products are negative.
By plotting ei against time : The successive values of ei are plotted against time would indicate the possible presence of autocorrelation .If e’s in successive time show a regular time pattern, then there is autocorrelation in the function. The autocorrelation is said to be negative if successive values of ei changes sign frequently.
First Order of Autocorrelation (AR-1)
When t-1 time period’s error affects the error of time period t (current time period), then it is called first order of autocorrelation.
AR-1 coefficient p takes values between +1 and -1
The size of this coefficient p determines the strength of autocorrelation.
A positive value of p indicates a positive autocorrelation.
A negative value of p indicates a negative autocorrelation
In case if p = 0, then this indicates there is no autocorrelation.
To explain the error term in any particular period t, we use the following formula:-

Where Vt= a random term which fulfills all the usual assumptions of OLS
How to find the value of p?

One can estimate the value of ρ by applying the following formula :-

Time Series Analysis & Modelling with Python (Part II) – Data Smoothing

dexlab_time_series

Data Smoothing is done to better understand the hidden patterns in the data. In the non- stationary processes, it is very hard to forecast the data as the variance over a period of time changes, therefore data smoothing techniques are used to smooth out the irregular roughness to see a clearer signal.

In this segment we will be discussing two of the most important data smoothing techniques :-

  • Moving average smoothing
  • Exponential smoothing

Moving average smoothing

Moving average is a technique where subsets of original data are created and then average of each subset is taken to smooth out the data and find the value in between each subset which better helps to see the trend over a period of time.

Lets take an example to better understand the problem.

Suppose that we have a data of price observed over a period of time and it is a non-stationary data so that the tend is hard to recognize.

QTR (quarter)Price
110
211
318
414
515
6?


In the above data we don’t know the value of the 6th quarter.

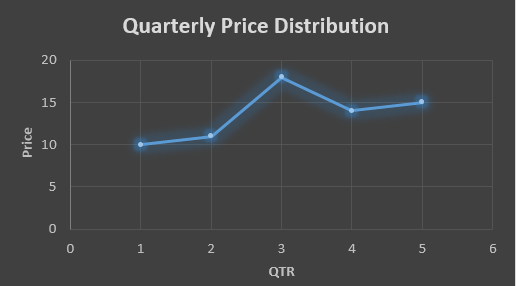
….fig (1)

The plot above shows that there is no trend the data is following so to better understand the pattern we calculate the moving average over three quarter at a time so that we get in between values as well as we get the missing value of the 6th quarter.

To find the missing value of 6th quarter we will use previous three quarter’s data i.e.

MAS =  = 15.7

QTR (quarter)Price
110
211
318
414
515
615.7

MAS =  = 13

MAS =  = 14.33

QTR (quarter)PriceMAS (Price)
11010
21111
31818
41413
51514.33
615.715.7


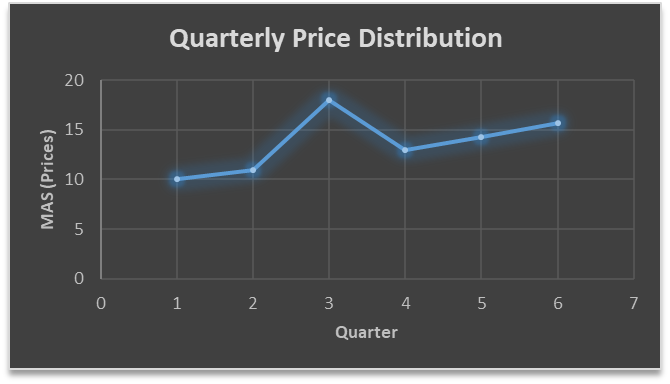
….. fig (2)

In the above graph we can see that after 3rd quarter there is an upward sloping trend in the data.

Exponential Data Smoothing

In this method a larger weight ( ) which lies between 0 & 1 is given to the most recent observations and as the observation grows more distant the weight decreases exponentially.

The weights are decided on the basis how the data is, in case the data has low movement then we will choose the value of  closer to 0 and in case the data has a lot more randomness then in that case we would like to choose the value of  closer to 1.

EMA= Ft= Ft-1 + (At-1 – Ft-1)

Now lets see a practical example.

For this example we will be taking  = 0.5

Taking the same data……

QTR (quarter)Price

(At)

EMS Price(Ft)
11010
211?
318?
414?
515?
6??


To find the value of yellow cell we need to find out the value of all the blue cells and since we do not have the initial value of F1 we will use the value of A1. Now lets do the calculation:-

F2=10+0.5(10 – 10) = 10

F3=10+0.5(11 – 10) = 10.5

F4=10.5+0.5(18 – 10.5) = 14.25

F5=14.25+0.5(14 – 14.25) = 14.13

F6=14.13+0.5(15 – 14.13)= 14.56

QTR (quarter)Price

(At)

EMS Price(Ft)
11010
21110
31810.5
41414.25
51514.13
614.5614.56

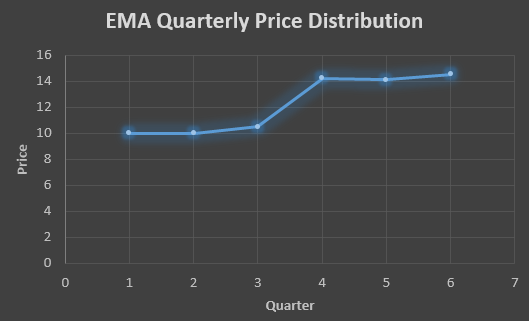
In the above graph we see that there is a trend now where the data is moving in the upward direction.

So, with that we come to the end of the discussion on the Data smoothing method. Hopefully it helped you understand the topic, for more information you can also watch the video tutorial attached down this blog. The blog is designed and prepared by Niharika Rai, Analytics Consultant, DexLab Analytics DexLab Analytics offers machine learning courses in Gurgaon. To keep on learning more, follow DexLab Analytics blog.


.

How to Effectively Pursue your Dream Career in Market Analysis? A Go To Guide!

How to Effectively Pursue your Dream Career in Market Analysis? A Go To Guide!

Being a Market Analyst in these days is synonymous to sealing the deal, where you don’t have to worry about your salary and many other perks which varies from company to company. But, it’s not an easy-peasy way to success in here.

A Market Analyst is heaped with a huge amount of responsibilities day in and day out, involving a colossal amount of data and analysing them to perfection. With the help of these data, they have to come up with innovative ideas to boost the business of the company.

2

Some of the other responsibilities include:

  • Exploring and analysing the tactics of the competitors, market conditions and the consumer demographics flawlessly.
  • Studying the customer opinions, buying habits, customers’ wants and needs.
  • Converting the collection of data into interactive presentations, tables and texts to bring them to the effective use for the benefit of the company.
  • Coming up with improved approach to collect data, comprising of surveys, interviews, questionnaires and more.

These are a few of the highlights of the jobs assigned to a Market Analyst. You can catch some more of them at A Market Analyst and His Job: An Overview!

Want to Become a Market Analyst? Here’s What You Should Go For!

Now, if you are a newbie and interested to pursue a career in Market Analysis, you shall always opt for the best customer marketing analysis training in the country, besides having:

  1. A Degree in Statistics, Computer Science, Economics or Business Administration – When it comes to Market Analysis, all they want is to interview the candidates with a Bachelor’s Degree in maths, statistics, computer science, business administration or economics. Some of the companies also shortlist the candidates from the field of communications. Furthermore, specialist degrees in marketing research and consumer psychology prove exceptional.
  2. Manoeuvre your Technical and Business Skills towards Analytic ThinkingAnalytic thinking is the thing that would take you for miles on end, regardless of your skill set. Besides, the skills which you should be needing are:

Deep Learning and AI using Python

Technical Skills:

  • Proficient with Statistical Analysis software, like, R, SAS and SPSS.
  • Well-versed in SQL databases and database querying languages.
  • Good programming skills.
  • Known to business intelligence and reporting software.
  • Customer Market Analysis courses.

At the end, we will provide you some business skills that you can develop to pursue your dreams smoothly:

  • Analytic problem solving skills.
  • Developing a habit of critical thinking.
  • Effective communication skills.
  • An impressive knowledge of the industry.

Grab an insight of this article in order to get a grasp of the stream of Market Analysis and how to become a Market Analyst! For more such informative blogs related to computer science and the evolving technologies of Python, Data Science, Big Data and AI, visit Dexlab Analytics. You can also follow us on Facebook and LinkedIn for any updates and queries about our courses and the teaching staffs.


Interested in a career in Data Analyst?

To learn more about Data Analyst with Advanced excel course – Enrol Now.
To learn more about Data Analyst with R Course – Enrol Now.
To learn more about Big Data Course – Enrol Now.

To learn more about Machine Learning Using Python and Spark – Enrol Now.
To learn more about Data Analyst with SAS Course – Enrol Now.
To learn more about Data Analyst with Apache Spark Course – Enrol Now.
To learn more about Data Analyst with Market Risk Analytics and Modelling Course – Enrol Now.

Risk Analytics Market: Serious Growth Rate Projection for 2017-2021

Want to get to the core of understanding risk within various business frameworks? The answer is Risk Analytics. This new breed of data analytics facilitates organizations in precisely defining, recognizing and managing their risk, and its need is going to increase in the coming few years. New developments in risk analytics are gaining limelight and bringing a notable transformation in the market, while enhancing its overall capability.

 
Risk Analytics Market: Serious Growth Rate Projection for 2017-2021
 

Recently, a team of analysts had eureka moment – they introduced a new concept of real-time risk analytics – it is nothing but a modern, more advanced version of traditional risk analytics methods. Here, the prediction is based on real-time data – it processes, examines and determines risk all on a real-time basis – hence top notch financial institutions are putting real-time risk analytics to best use to manage and mitigate associated risks. Several asset management, portfolio management and hedge fund firms, and investment banks are relying on this mode of risk analytics to modify their operating principles to play in accordance with investment and market shifts.

Continue reading “Risk Analytics Market: Serious Growth Rate Projection for 2017-2021”

A New Course Alert! DexLab Analytics Launches Market Risk Analytics and Modelling

We are back again with some great news! Technology enthusiasts and hardcore industry professionals got another reason to cheer for DexLab Analytics, as we feel extremely delighted to announce our new Market Risk Analytics and Modelling online live sessions. We welcome hundreds and thousands of young, aspiring data enthusiasts from various parts of the country who are driven by hunger, passion and robust dreams of a data-friendly future to get enrolled in our online course on Market Risk Analytics using SAS. In our quest for expanding our horizons, these types of analytics course play a significant role.

 
A New Course Alert! DexLab Analytics Launches Market Risk Analytics and Modelling
 

Recently, Market Risk Analytics have gained a lot of prominence – a lot of tech pundits and industry practitioners have repeatedly emphasized on the importance of having sound market risk management policies and strong internal controls. Especially, since the global financial crisis, the critical aspect of risk management analytic has doubled.

Continue reading “A New Course Alert! DexLab Analytics Launches Market Risk Analytics and Modelling”

Call us to know more