Machine Learning Archives - Page 6 of 14 - DexLab Analytics | Big Data Hadoop SAS R Analytics Predictive Modeling & Excel VBA

Machine Learning in the Healthcare Sector

Machine Learning in the Healthcare Sector

The healthcare industry is one of the most important industries when it comes to human welfare. Research analysis from the U.S. federal government actuaries say that Americans spent $3.65 trillion on health care in 2018(report from Axios) and the Indian healthcare market is expected to reach $ 372 billion by 2022. To reduce cost and to move towards a personalized healthcare system, the industry faces three major hurdles: –

1) Electronic record management
2) Data integration
3) Computer-aided diagnoses.

Machine learning in itself is a vast field with a wide array of tools, techniques, and frameworks that can be exploited and manipulated to cope with these challenges. In today’s time, Machine Learning Using Python is proving to be very helpful in streamlining the administrative processes in hospitals, map and treat life-threatening diseases and personalizing medical treatments.

This blog will focus primarily on the applications of Machine learning in the domain of healthcare.

Real-life Application of Machine learning in the Health Sector

  1. MYCIN system was incepted at Stanford University. The system was developed in order to detect specific strains of bacteria that cause infections. It proposed a good therapy in 69% of the cases which was at that time better than infectious disease experts.
  2. In the 1980s at the University of Pittsburgh, a diagnostic tool named INTERNIST-I was developed to diagnose symptoms of various diseases like flu, pneumonia, diabetes and more. One of the key functionalities of the INTERNIST-I was to be able to detect the problem areas. This is done with a view of being able to remove diagnostics’ likelihood.
  3. AI trained by researchers from Pennsylvania has been developed recently which is capable of predicting patients who are most likely to die within a year. This is assessed based on their heart test results. This AI is capable of predicting the death of patients even if the figures look quite normal to the doctors. The researchers have trained the AI with 1.77 million electrocardiograms (ECG) results. The researchers have made two versions of this Al: one with just the ECG data and the other one with ECG data along with the age and gender of the patients.
  4. P1vital’s PReDicT (Predicting Response to Depression Treatment) built on the Machine Learning algorithms aims to develop a commercially feasible way to diagnose and provide treatment of depression in clinical practice.
  5. KenSci has developed machine learning algorithms to predict illnesses and their cure to enable doctors with the ability to detect specific patterns and indicators of population health risks. This comes under the purview of model disease progression.
  6. Project Hanover developed by Microsoft is using Machine Learning-based technologies for multiple purposes, which includes the development of AI-based technology for cancer treatment and personalizing drug combination for Acute Myeloid Leukemia (AML).
  7. Preserving data in the health care industry has always been a daunting task. However, with the forward-looking steps in analytics-related technology, it has become more manageable over the years. The truth is that even now, a majority of the processes take a lot of time to complete.
  8. Machine learning can prove to be disruptive in the medical sector by automating processes relating to data collection and collation. This is highly profitable in terms of cost-effectiveness. Newer algorithms such as Vector Machines or OCR recognition are designed to automate the task of document reading and classification with high levels of precision and accuracy.

  9. PathAI’s technology uses machine learning to help pathologists make faster and more accurate diagnoses. Furthermore, it also helps in identifying patients who might benefit from a new and different type of treatments or therapies in the future.

Data Science Machine Learning Certification

To Sum Up:

As the modern technologies of Machine Learning, Artificial Intelligence and Big Data Analytics are tottering forth in multiple domains, there is a long path they need to walk to ensure an unflinching success. Besides, it is also important for every one of us to be accustomed to all these new-age technologies.

With an expansion of the quality Machine Learning course in India and Neural Network Machine learning Python, all the reputed institutes are joining hands together to bring in the revolution. The initial days will be slow and hard, but it is no doubt that these cutting edge technologies will transform the medical industry along with a range of other industries, making early diagnoses possible along with a reduction of the overall cost. Besides, with the introduction of successful recommender systems and other promises of personalized healthcare, coupled with systematic management of medical records, Machine Learning will surely usher in the future for good! 


.
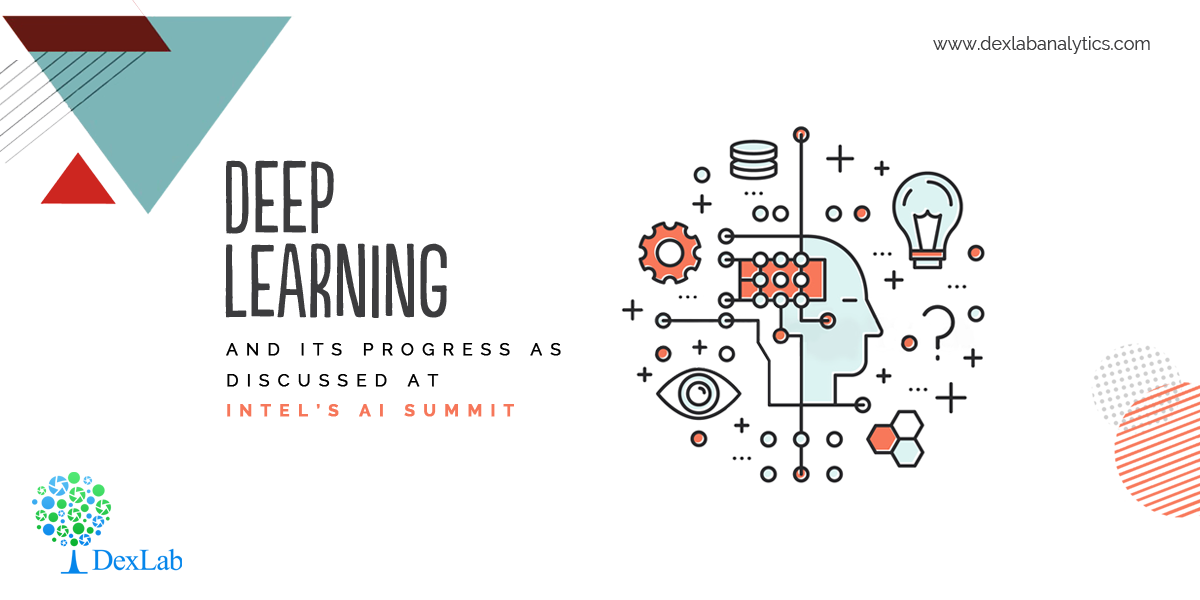
Deep Learning and its Progress as Discussed at Intel’s AI Summit

Deep Learning and its Progress as Discussed at Intel’s AI Summit

At the latest AI summit organized by Intel, Mr. Naveen Rao, Vice President and General Manager of Intel’s AI Products Group, focused on the most vibrant age of computing that is the present age we are living. According to Rao, the widespread and sudden growth of neural networks is putting the capability of the hardware into a real test. Therefore, we now have to reflect deeply on “how processing, network, and memory work together” to figure a pragmatic solution, he said.

The storage of data has seen countless improvements in the last 20 years. We can now boast of our prowess of handling considerably large sets of data, with greater computing capability in a single place. This led to the expansion of the neural network models with an eye on the overall progress in neural Network Machine Learning Python and computing in general.

2

With the onset of exceedingly large data sets to work with, Deep learning for Computer Vision Course and the other models of Deep Learning to recognize speech, images, and text are extensively feeding on them. The technological giants were undoubtedly the early birds to grab the technical: the hardware and the software configuration to have an edge on the others.  

Surely, Deep Learning is on its peak now, where computers can identify the images with incredible vividness. On the other hand, chatbots can carry on with almost natural conversations with us. It is no wonder that the Deep learning Training Institutes all over the world are jumping in the race to bring all of these new technologies efficiently to the general mass.

The Big Problem

We are living in the dynamic age of AI and Machine Learning, with the biggies like Google, Facebook, and its peers, having the technical skills and configuration to take up the challenges. However, the neural networks have fattened up so much lately that it has already started to give the hardware a tough time, getting the better of them all the time.

Deep Learning and AI using Python

The number of parameters of the Neural network models is increasing as never before. They are “actually increasing on the order of 10x year on year”, as per Rao. Thus, it is a wall looming in AI. Though Intel is trying its best to tackle this obvious wall, which might otherwise give the industry a severe setback, with extensive research to bring new chip architectures and memory technologies into play, it cannot solve the AI processing problem single-handedly. Rao concluded on a note of requesting the partners in the present competitive scenario.


Sourced from: www.datanami.com/2019/11/13/deep-learning-has-hit-a-wall-intels-rao-says


Interested in a career in Data Analyst?

To learn more about Data Analyst with Advanced excel course – Enrol Now.
To learn more about Data Analyst with R Course – Enrol Now.
To learn more about Big Data Course – Enrol Now.

To learn more about Machine Learning Using Python and Spark – Enrol Now.
To learn more about Data Analyst with SAS Course – Enrol Now.
To learn more about Data Analyst with Apache Spark Course – Enrol Now.
To learn more about Data Analyst with Market Risk Analytics and Modelling Course – Enrol Now.

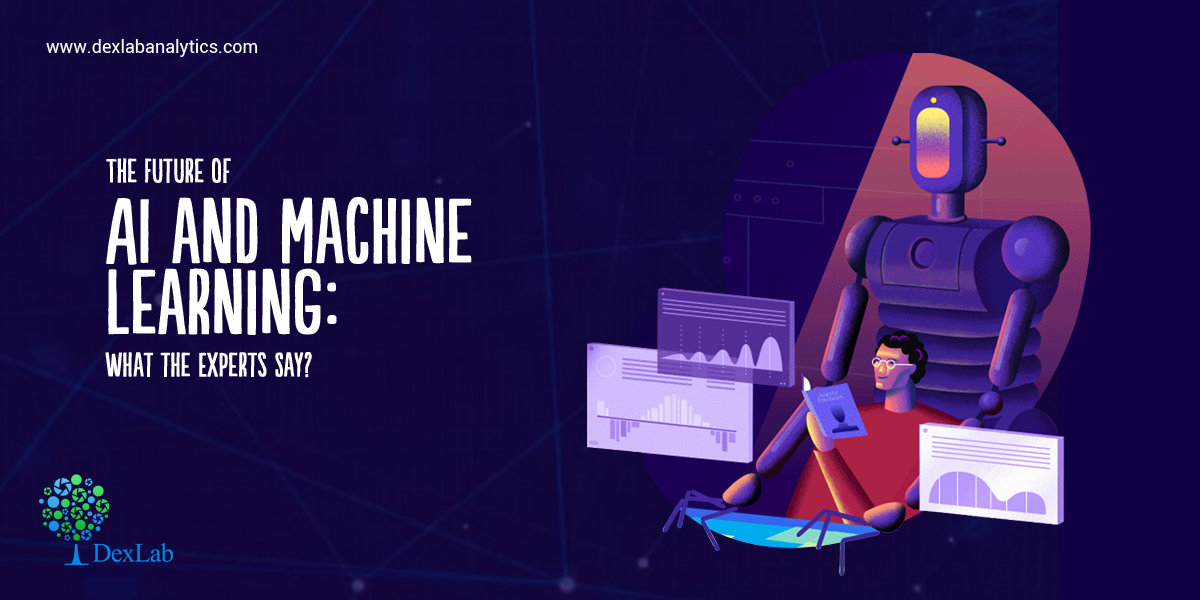
The Future of AI and Machine Learning: What the Experts Say?

The Future of AI and Machine Learning: What the Experts Say?

It’s hard to ignore the growing prowess of AI and machine learning.

Previously, Gartner predicted that AI will become one of the key priorities for more than 30% C-Suite professionals by 2020. Indeed, it’s true; software vendors across the globe are following this new gold rush. For them, data is like new oil. In this blog, we explore the future of this budding technology and gain some new insights and ideas. Let’s see what the heavyweights from the digital industry have to say:

Hyper-targeting and Personalization

Ben Wald, Co-Founder & VP of Solutions Implementation at Very

Though machine learning is a subset of data analysis, it’s rapidly influencing the IoT industry and its respective devices. In the last couple of years, nearly 90% of data was generated through an array of smartphones, watches and cars. These mountains of data help in forming better customer relationships.

How? Using Machine Learning Using Python of course! With this power tool, the corporate houses are trying to understand their target audience and extract crucial information regarding how well they receive their products and related after-sales services. Fine-tuning personalization on a wider scale is the key. Hopefully, soon, we will be able to achieve this goal. We are still in the nascent stage.

Improved Search Engine Experiences

Dorit Zilbershot, Chief Product Officer at Attivio

Did you know that AI algorithms have a massive impact on search engine results?

In the next few years, search engines are expected to enhance user and admin experience: courtesy breakthroughs in neural networks and deep learning technologies. These revolutionary technologies, especially deep learning for computer vision with Python will make sure users enjoy a fabulous searching experience and will deliver highly relevant answers. Currently, we are working on delivering results that are based on user’s query and profile. The process requires a lot of manual configurations and a fundamental understanding of how search engines work. Later, the results will be customized based on individuals’ past preferences, interactions and words used. It will be fun to see how machine learning algorithms transform the dynamo of content publishing and search engines.

Quantum Computing

Matt Reaney, Founder & CEO of Big Cloud

Real and revolutionary, the concept of quantum computing is wreaking havoc in the domain of science and technology. It is the future of machine learning triggering an array of innovations. Integrating quantum computing with machine learning is expected to transform the field triggering accelerated learning, quicker processing and better capabilities. This means the intricate challenges that we can’t solve now could be done in a fraction of time then.

The potential of quantum computing is huge in the future and is likely affect millions of lives, notably in medicine and healthcare industry.

Currently, there are no commercially-built quantum algorithms or hardware available in the market. However, several research facilities and government agencies have been investing in this new field of science of late.

Data Science Machine Learning Certification

End Notes

At DexLab Analytics, we love to craft and curate insights from industry pundits, especially when it comes to something as significant as technological innovations that transform lives altogether. Follow us and stay updated!


.

A Nifty Guide to Initiate AIOps in 2019

A Nifty Guide to Initiate AIOps in 2019

AIOps (artificial intelligence for IT operations) is the buzz word of the 21st century.

In this digitally-charged world, AIOps platforms are the key. They fuse ML and big data functionalities to boost and partly replace primary IT operations’ programs, including event correlation and analysis, performance monitoring and IT service automation and management.

In simple terms, AIOps is the combined application of data science and machine learning to help mitigate IT operations-related challenges and find faster insights. It fixes high-severity outages in a jiffy. 

The main objective of revolutionary AIOps platforms is to ingest and analyze the aggravating volume, variety and velocity of data and deliver it in a useful manner.

Deep Learning and AI using Python

IT bigwigs are excited about the prospects of applying AI and ML to IT operations.

Gartner expects that big enterprises’ usage of AIOps and other monitoring tools and applications will rise from 5% in 2018 to 30% in 2023. The long-term impact of AIOps on IT operations is predicted to be transformative.

Fortunately, AI capabilities are making headway, and more real-time solutions are being formulated and made available each day.

Read on to know how to get started with AIOPs:

Be prepared

First and foremost, you have to familiarize yourself with all the ML and AI capabilities and vocabulary. It doesn’t matter if you are gearing up for an AIOps project or not. Capabilities and priorities change; so be ready to implement the platform anytime soon.

Select the first few test cases carefully

Small and steady wins the race. The same phrase applies to transformation initiatives. They start small, seize knowledge and iterate from there. Imbibe the same approach for AIOps success.

Enhance your proficiency

Decode the intricacies of AIOps amongst your colleagues by displaying simple techniques. Ascertain your skills and identify the loopholes, then devise a relevant plan to fill up those gaps in-between.

Feel free to experiment

Although a majority of AIOps platforms are complex and costly, there is a substantial number of open-source and relatively low-cost ML software available in the market that lets you evaluate the efficacy of AIOps and ML applications and their uses.

Look beyond IT

Don’t forget to leverage all kinds of data analytics resources available in your organization. Data management is the cornerstone of AIOps. Most of the teams are already skilled in it. Statistical analytics and business analysis are key components of contemporary business frameworks, and many techniques traverse public domains. 

2

Standardize and modernize, as and when required

Prepare your work infrastructure to implement a robust AIOps adoption by embracing secure automation architecture, immutable infrastructure patterns and infrastructure as code (IaC).

Interested in learning more about Machine Learning Using Python? Feel free to reach us at DexLab Analytics. We’re a premier learning platform specialized in offering in-demand skill training courses to the interested candidates.


The blog has been sourced from ― www.gartner.com/smarterwithgartner/how-to-get-started-with-aiops


Interested in a career in Data Analyst?

To learn more about Data Analyst with Advanced excel course – Enrol Now.
To learn more about Data Analyst with R Course – Enrol Now.
To learn more about Big Data Course – Enrol Now.

To learn more about Machine Learning Using Python and Spark – Enrol Now.
To learn more about Data Analyst with SAS Course – Enrol Now.
To learn more about Data Analyst with Apache Spark Course – Enrol Now.
To learn more about Data Analyst with Market Risk Analytics and Modelling Course – Enrol Now.

Statistical Application of R & Python: Know Skewness & Kurtosis and Calculate it Effortlessly

Statistical Application of R & Python: Know Skewness & Kurtosis and Calculate it Effortlessly

This is a blog which shall widen your approach on the Statistical Application using R & Python. You perhaps already have been calculating Geometric Mean using R & Python and are already aware of the Application of Harmonic Mean using R & Python. However, if you are eager to further your knowledge about Skewness & Kurtosis and interested to know of their application using R and Python, then this is the right place.

Skewness:

Skewness is a metric which tells us about the location of my dataset. That is, if you want to know where most of the values are concentrated on an ascending scale.

Skewness is of two kinds: Positive skew and Negative skew. A positively skewed dataset will have most of the values concentrated at the beginning of the scale. Eg: If a woman is asked to rate 100 tinder profiles based on the looks on a scale of 1 – 10, 1 being the ugliest and 10 being the most handsome. Then the resulting ratings will be positively skewed. This is to say that women are harsh critiques of looks.

Now, consider another example: Say if the wealth of the 1% richest people were to be plotted on a scale of say $0 – $200 billion. Then, most of the values will be concentrated at the end of the scale. This will be an example of a negatively skewed dataset.

In essence, skewness is the third central moment about mean and gives us a feel for the location of the data set values. It is recommended to go through STATISTICAL APPLICATION IN R & PYTHON: CHAPTER 1 – MEASURE OF CENTRAL TENDENCY to have an understanding of the Central Tendency and its measures. Having no skewness will mean the data set is fairly symmetrical and has a bell shaped curve.

Where n is the sample size, Xi is the ith X value, X is the average and S is the sample standard deviation.  Note the exponent in the summation.  It is “3”.

Kurtosis:

Kurtosis is a statistical measure that’s used to describe, or Skewness, of observed data around the mean, sometimes referred to as the volatility to volatility. Kurtosis is used generally in the statistical field to describe trends in charts. Kurtosis can be present in a chart with fat tails and a low, even distribution, as well as be present in a chart with skinny tails and a distribution concentrated toward the mean.

Kurtosis for a normal distribution is 3.  Most software packages use the formula:


The types of kurtosis are:-


Application:

A person tries to analyze last 12months interest rate of the investment firm to understand the risk factor for the future investment.

The interest rates are:

12.05%, 13%, 11%, 18%, 10%, 11.5%, 15.08%, 21%, 6%, 8%, 13.2%, 7.5%.

Here is the table:

Months

(One Year)

Interest

Rate (%)

April12.05
May13
June11
July18
August10
September11.5
October15.08
November21
December6
January8
February13.2
March7.5


Calculate skewness & Kurtosis in R:

Calculate skewness & Kurtosis in R:
Calculating the Skewness & Kurtosis of interest rate in R, we get the positive skewed value, which is near to 0. The skewness of the interest rate is 0.5585253.

The kurtosis of the interest rate is 2.690519

Kurtosis is less than 3, so this is Platykurtic distribution.

Calculate Skewness & Kurtosis in Python:

Calculate Skewness & Kurtosis in Python:
Calculating the Skewness & Kurtosis of interest rate in Python, we get the positive skewed value and near from 0. The skewness of the interest rate is 0.641697.

The kurtosis of the interest rate is 0.241602.

Kurtosis is less than 3, so this is Platykurtic distribution.

Conclusion:

Firstly, according to the output of the data the value is positively skewed(R & Python), positive skewness indicates a distribution with an asymmetric tail extending toward more positive values.

And the kurtosis is less than 3 (R & Python), it is a platykurtic distribution. Positive kurtosis indicates a relatively peaked distribution. And the distribution is light tails.

Secondly, the value of the skewness and kurtosis are different in R and Python, but the actual effects are more or less the same. The results are different because skewness and kurtosis are calculated with different formulae or method for the measurement like Bowley’s measure, Pearson’s(First, Second) measures, Fisher’s measure & Moment’s measure. And different software (ex. R, Python, SAS, Excel etc) using different processes to calculate skewness & kurtosis brings the same ultimate result. The numerical values change only when the numbers are also changed. So, we sometimes get different results.

2

There are numerous other blogs that you can follow with Dexlab Analytics. Also, if you want to explore computer vision course Python, neural network machine learning Python and more extensive courses on R & Python, then you can also join us and boost both your passion and career.


Interested in a career in Data Analyst?

To learn more about Data Analyst with Advanced excel course – Enrol Now.
To learn more about Data Analyst with R Course – Enrol Now.
To learn more about Big Data Course – Enrol Now.

To learn more about Machine Learning Using Python and Spark – Enrol Now.
To learn more about Data Analyst with SAS Course – Enrol Now.
To learn more about Data Analyst with Apache Spark Course – Enrol Now.
To learn more about Data Analyst with Market Risk Analytics and Modelling Course – Enrol Now.

Application of Mode using R and Python

Application of Mode using R and Python

Mode, for a given set of observations, is that value of the variable, where the variable occurs with the maximum or the highest frequency.

This blog is in continuation with STATISTICAL APPLICATION IN R & PYTHON: CHAPTER 1 – MEASURE OF CENTRAL TENDENCY. However, here we will elucidate the Mode and its application using Python and R.

Mode is the most typical or prevalent value, and at times, represents the true characteristics of the distribution as a measure of central tendency.

Application:

The numbers of the telephone calls received in 245 successive one minute intervals at an exchange are shown in the following frequency distribution table:


No of Calls
Frequency
0
14
1
21
2
25
3
43
4
51
5
40
6
51
7
51
8
39
9
12
Total
245


 [Note: Here we assume total=245 when we calculate Mean from the same data]

Evaluate the Mode from the data.

Evaluate the Mode from the data

Calculate Mode in R:

Calculate mode in R from the data, i.e. the most frequent number in the data is 51.

The number 51 repeats itself in 5, 7 and 8 phone calls respectively.

Calculate Median in Python:

First, make a data frame for the data.

Now, calculate the mode from the data frame.

Calculate mode in Python from the data, i.e. the most frequent number in the data is 51.

The number 51 repeats itself in 5, 7 and 8 phone calls respectively.

Mode is used in business, because it is most likely to occur. Meteorological forecasts are, in fact, based on mode calculations.

The modal wage of a group of the workers is the wages which the largest numbers of workers receive, and as such, this wage may be considered as the representative wage of the group.

In this particular data set we use the mode function to know the occurrence of the highest number of phone calls.

It will thus, help the Telephone Exchange to analyze their data flawlessly.

2

Note – As you have already gone through this post, now, if you are interested to know about the Harmonic Mean, you can check our post on the APPLICATION OF HARMONIC MEAN USING R AND PYTHON.

Dexlab Analytics is a formidable institute for Deep learning for computer vision with PythonHere, you would also find more information about courses in Python, Deep LearningMachine Learning, and Neural Networks which will come with proper certification at the end.

We are there in the Social Media where you can follow us both in Facebook and Instagram.


Interested in a career in Data Analyst?

To learn more about Data Analyst with Advanced excel course – Enrol Now.
To learn more about Data Analyst with R Course – Enrol Now.
To learn more about Big Data Course – Enrol Now.

To learn more about Machine Learning Using Python and Spark – Enrol Now.
To learn more about Data Analyst with SAS Course – Enrol Now.
To learn more about Data Analyst with Apache Spark Course – Enrol Now.
To learn more about Data Analyst with Market Risk Analytics and Modelling Course – Enrol Now.

Know the Trending Machine Learning Toolkits: For More Intelligent Mobile Apps

Know the Trending Machine Learning Toolkits: For More Intelligent Mobile Apps

With the progressive age, innovative and effective technologies like Artificial Intelligence and Machine Learning is dominating the scene of the present. Therefore, developers are rooting for machine learning models to be up to date with the present era. You can also avail of Neural Network Machine learning Python to keep pace with the modern advancements.

To say it, even mobile applications have come a long way from what they were earlier. With the cutting edge technologies of face recognition, speech recognition, recognition of different gestures and movements, mobile apps are really smart now. Furthermore, with the popularity of AI and machine learning, the mobile industry is looking forward to introducing them into the mobiles.

So, here you can catch a glimpse of the top 5 machine learning toolkits for a mobile developer to be aware of.

Apache PredictionIO

Apache PredictionIO is an effective machine learning server. It is open source in nature and acts as a source stack for the developers and data scientists. Through this tool, a developer can easily build and deploy an engine as a web service on production. It can then be easily utilised by the users, where they can run their own machine learning models seamlessly.

Caffe

The Convolutional Architecture for Fast Feature Embedding or Caffe, is an open-source framework developed by the AI Research of Berkeley. Caffe is growing up to be both powerful and popular as a computer vision framework that the developers can use to run machine vision tasks, image classification and more.

CoreML

CoreML is a machine learning framework from the house of Apple Inc. Through this app, you can implement machine learning models on your iOS. CoreML supports the vision to analyse images, natural language for processing natural language, speech for converting audio to text and even sound analysis for the identification of sounds in audio.

Eclipse Deeplearning4j

Eclipse Deeplearning4j is a formidable deep-learning library and is, in fact, the first commercial-grade, open-source one for Java and Scala. You can also integrate Eclipse with Hadoop and Apache Spark if you want to bring AI into the business environment.

Besides, it also acts as a DIY tool where, the programmers of Java, Scala and Clojure can configure the deep neural networks without any hassles. 

Data Science Machine Learning Certification

Google ML Kit

This is a machine learning software development kit for mobile app developers. Through this app, you can develop countless interactive features that you can run on Android and iOS. Here you will also get some readily available APIs for face recognition, to scan barcodes, labelling images and landmarks. With this app, you just need to feed in the data and see the app at its optimum performance.

These are some peerless Machine Learning toolkits to be incorporated into the mobiles. You can also avail of the Machine Learning course in Delhi if you are interested. 


.

AI-Related Tech Jargons You Need To Learn Right Now

AI-Related Tech Jargons You Need To Learn Right Now

As artificial intelligence gains momentum and becomes more intricate in nature, technological jargons may turn unfamiliar to you. Evolving technologies give birth to a smorgasbord of new terminologies. In this article, we have tried to compile a few of such important terms that are related to AI. Learn, assimilate and flaunt them in your next meeting.

Artificial Neuron Networks – Not just an algorithm, Artificial Neuron Networks is a framework containing different machine learning algorithms that work together and analyzes complex data inputs.

Backpropagation – It refers to a process in artificial neural networks used to discipline deep neural networks. It is widely used to calculate a gradient that is required in calculating weights found across the network.

2

Bayesian Programming – Revolving around the Bayes’ Theorem, Bayesian Programming declares the probability of something happening in the future based on past conditions relating to the event.

Analogical Reasoning – Generally, the term analogical indicates non-digital data but when in terms of AI, Analogical Reasoning is the method of drawing conclusions studying the past outcomes. It’s quite similar to stock markets.

Data Mining – It refers to the process of identifying patterns from fairly large data sets with the help statistics, machine learning and database systems in combination.

Decision Tree LearningUsing a decision tree, you can move seamlessly from observing an item to drawing conclusions about the item’s target value. The decision tree is represented as a predictive model, the observation as the branches and the conclusion as the leaves.  

Behavior Informatics (BI) – It is of extreme importance as it helps obtain behavior intelligence and insights.

Case-based Reasoning (CBR) – Generally speaking, it defines the process of solving newer challenges based on solutions that worked for similar past issues.

Feature Extraction – In machine learning, image processing and pattern recognition plays a dominant role. Feature Extraction begins from a preliminary set of measured data and ends up building derived values that intend to be non-redundant and informative – leading to improved subsequent learning and even better human interpretations.

Forward Chaining – Also known as forward reasoning, Forward Chaining is one of two main methods of reasoning while leveraging an inference engine. It is a widely popular implementation strategy best suited for business and production rule systems. Backward Chaining is the exact opposite of Forwarding Chaining.

Genetic Algorithm (GA) – Inspired by the method of natural selection, Genetic Algorithm (GA) is mainly used to devise advanced solutions to optimization and search challenges. It works by depending on bio-inspired operators like crossover, mutation and selection.

Pattern Recognition – Largely dependent on machine learning and artificial intelligence, Pattern Recognition also involves applications, such as Knowledge Discovery in Databases (KDD) and Data Mining.

Reinforcement Learning (RL) – Next to Supervised Learning and Unsupervised Learning, Reinforcement Learning is another machine learning paradigms. It’s reckoned as a subset of ML that deals with how software experts should take actions in circumstances so as to maximize notions of cumulative reward.

Looking for artificial intelligence certification in Delhi NCR? DexLab Analytics is a premier big data training institute that offers in-demand skill training courses to interested candidates. For more information, drop by our official website.

The article first appeared on— www.analyticsindiamag.com/25-ai-terminologies-jargons-you-must-assimilate-to-sound-like-a-pro


Interested in a career in Data Analyst?

To learn more about Data Analyst with Advanced excel course – Enrol Now.
To learn more about Data Analyst with R Course – Enrol Now.
To learn more about Big Data Course – Enrol Now.

To learn more about Machine Learning Using Python and Spark – Enrol Now.
To learn more about Data Analyst with SAS Course – Enrol Now.
To learn more about Data Analyst with Apache Spark Course – Enrol Now.
To learn more about Data Analyst with Market Risk Analytics and Modelling Course – Enrol Now.

A Beginner’s Guide to Learning Data Science Fundamentals

A Beginner’s Guide to Learning Data Science Fundamentals

I’m a data scientist by profession with an actuarial background.

I graduated with a degree in Criminology; it was during university that I fell in love with the power of statistics. A typical problem would involve estimating the likelihood of a house getting burgled on a street, if there has already been a burglary on that street. For the layman, this is part of predictive policing techniques used to tackle crime. More technically, “It involves a Non-Markovian counting process called the “Hawkes Process” which models for “self-exciting” events (like crimes, future stock price movements, or even popularity of political leaders, etc.)

Being able to predict the likelihood of future events (like crimes in this case) was the main thing which drew me to Statistics. On a philosophical level, it’s really a quest for “truth of things” unfettered by the inherent cognitive biases humans are born with (there are 25 I know of).

2

Arguably, Actuaries are the original Data Scientists, turning data in actionable insights since the 18th Century when Alexander Webster with Robert Wallace built a predictive model to calculate the average life expectancy of soldiers going to war using death records. And so, “Insurance” was born to provide cover to the widows and children of the deceased soldiers.

Of course, Alan Turing’s contribution cannot be ignored, which eventually afforded us with the computational power needed to carry out statistical testing on entire populations – thereby Machine Learning was born. To be fair, the history of Data Science is an entire blog of its own. More on that will come later.

The aim of this series of blogs is to initiate anyone daunted by the task of acquiring the very basics of Statistics and Mathematics used in Machine Learning. There are tonnes of online resources which will only list out the topics but will rarely explain why you need to learn them and to what extent. This series will attempt to address this problem adopting a “first principle” approach. Its best to refer back to this article a second time after gaining the very basics of each Topic discussed below:

We will be discussing:

  • Central Limit Theorem
  • Bayes Theorem
  • Probability Theory
  • Point Estimation – MLE’s
  • Confidence Intervals
  • P-values and Significance Test.

This list is by no means exhaustive of the statistical and mathematical concepts you will need in your career as a data scientist. Nevertheless, it provides a solid grounding going into more advanced topics.

Without further due, here goes:

Central Limit Theorem

Central Limit Theorem (CLT) is perhaps one of the most important results in all of Statistics. Essentially, it allows making large sample inference about the Population Mean (μ), as well as making large sample inference about population proportion (p).

So what does this really means?

Consider (X1, X2, X3……..Xn) samples, where n is a large number say, 100. Each sample will have its own respective sample Mean (x̅). This will give us “n” number of sample means. Central Limit Theorem now states:

                                                                                                &

Try to visualise the distribution “of the average of lots of averages”… Essentially, if we have a large number of averages that have been taken from a corresponding large number of samples; then Central Limit theorem allows us to find the distribution of those averages. The beauty of it is that we don’t have to know the parent distribution of the averages. They all tend to Normal… eventually!

Similarly if we were to add up independent and identically distributed (iid) samples, then their corresponding distribution will also tend to a Normal.

Very often in your work as a data scientist a lot of the unknown distributions will tend to Normal, now you can visualise how and more importantly why!

Stay tuned to DexLab Analytics for more articles discussing the topics listed above in depth. To deep dive into data science, I strongly recommend this Big Data Hadoop institute in Delhi NCR. DexLab offers big data courses developed by industry experts, helping you master in-demand skills and carve a successful career as a data scientist.

About the Author: Nish Lau Bakshi is a professional data scientist with an actuarial background and a passion to use the power of statistics to tackle various pressing, daily life problems.


Interested in a career in Data Analyst?

To learn more about Data Analyst with Advanced excel course – Enrol Now.
To learn more about Data Analyst with R Course – Enrol Now.
To learn more about Big Data Course – Enrol Now.

To learn more about Machine Learning Using Python and Spark – Enrol Now.
To learn more about Data Analyst with SAS Course – Enrol Now.
To learn more about Data Analyst with Apache Spark Course – Enrol Now.
To learn more about Data Analyst with Market Risk Analytics and Modelling Course – Enrol Now.

Call us to know more