Machine Learning Training Archives - Page 8 of 18 - DexLab Analytics | Big Data Hadoop SAS R Analytics Predictive Modeling & Excel VBA

A Nifty Guide to Initiate AIOps in 2019

A Nifty Guide to Initiate AIOps in 2019

AIOps (artificial intelligence for IT operations) is the buzz word of the 21st century.

In this digitally-charged world, AIOps platforms are the key. They fuse ML and big data functionalities to boost and partly replace primary IT operations’ programs, including event correlation and analysis, performance monitoring and IT service automation and management.

In simple terms, AIOps is the combined application of data science and machine learning to help mitigate IT operations-related challenges and find faster insights. It fixes high-severity outages in a jiffy. 

The main objective of revolutionary AIOps platforms is to ingest and analyze the aggravating volume, variety and velocity of data and deliver it in a useful manner.

Deep Learning and AI using Python

IT bigwigs are excited about the prospects of applying AI and ML to IT operations.

Gartner expects that big enterprises’ usage of AIOps and other monitoring tools and applications will rise from 5% in 2018 to 30% in 2023. The long-term impact of AIOps on IT operations is predicted to be transformative.

Fortunately, AI capabilities are making headway, and more real-time solutions are being formulated and made available each day.

Read on to know how to get started with AIOPs:

Be prepared

First and foremost, you have to familiarize yourself with all the ML and AI capabilities and vocabulary. It doesn’t matter if you are gearing up for an AIOps project or not. Capabilities and priorities change; so be ready to implement the platform anytime soon.

Select the first few test cases carefully

Small and steady wins the race. The same phrase applies to transformation initiatives. They start small, seize knowledge and iterate from there. Imbibe the same approach for AIOps success.

Enhance your proficiency

Decode the intricacies of AIOps amongst your colleagues by displaying simple techniques. Ascertain your skills and identify the loopholes, then devise a relevant plan to fill up those gaps in-between.

Feel free to experiment

Although a majority of AIOps platforms are complex and costly, there is a substantial number of open-source and relatively low-cost ML software available in the market that lets you evaluate the efficacy of AIOps and ML applications and their uses.

Look beyond IT

Don’t forget to leverage all kinds of data analytics resources available in your organization. Data management is the cornerstone of AIOps. Most of the teams are already skilled in it. Statistical analytics and business analysis are key components of contemporary business frameworks, and many techniques traverse public domains. 

2

Standardize and modernize, as and when required

Prepare your work infrastructure to implement a robust AIOps adoption by embracing secure automation architecture, immutable infrastructure patterns and infrastructure as code (IaC).

Interested in learning more about Machine Learning Using Python? Feel free to reach us at DexLab Analytics. We’re a premier learning platform specialized in offering in-demand skill training courses to the interested candidates.


The blog has been sourced from ― www.gartner.com/smarterwithgartner/how-to-get-started-with-aiops


Interested in a career in Data Analyst?

To learn more about Data Analyst with Advanced excel course – Enrol Now.
To learn more about Data Analyst with R Course – Enrol Now.
To learn more about Big Data Course – Enrol Now.

To learn more about Machine Learning Using Python and Spark – Enrol Now.
To learn more about Data Analyst with SAS Course – Enrol Now.
To learn more about Data Analyst with Apache Spark Course – Enrol Now.
To learn more about Data Analyst with Market Risk Analytics and Modelling Course – Enrol Now.

Statistical Application in R & Python: Normal Probability Distribution

Statistical Application in R & Python: Normal Probability Distribution

Gauss, the famous French Mathematician is responsible for developing one of the most significant distributions in all of statistics, i.e. – The Normal Distribution. Please refer to the blog on Central Limit Theorem: www.dexlabanalytics.com/blog/the-almighty-central-limit-theorem. It will help you fully grasp the significance of the Normal Distribution. However, if you want to revisit our series of blogs by following it from the start, you can reach STATISTICAL APPLICATION IN R & PYTHON: CHAPTER 1 – MEASURE OF CENTRAL TENDENCY right now!

Essentially, the Normal Distribution provides “approximations” to most other distributions such as the Binomial, Poisson, Gamma, Exponential, etc. This is to say as sample sizes get statistically large enough, most distributions approximate into a normal shaped curve.

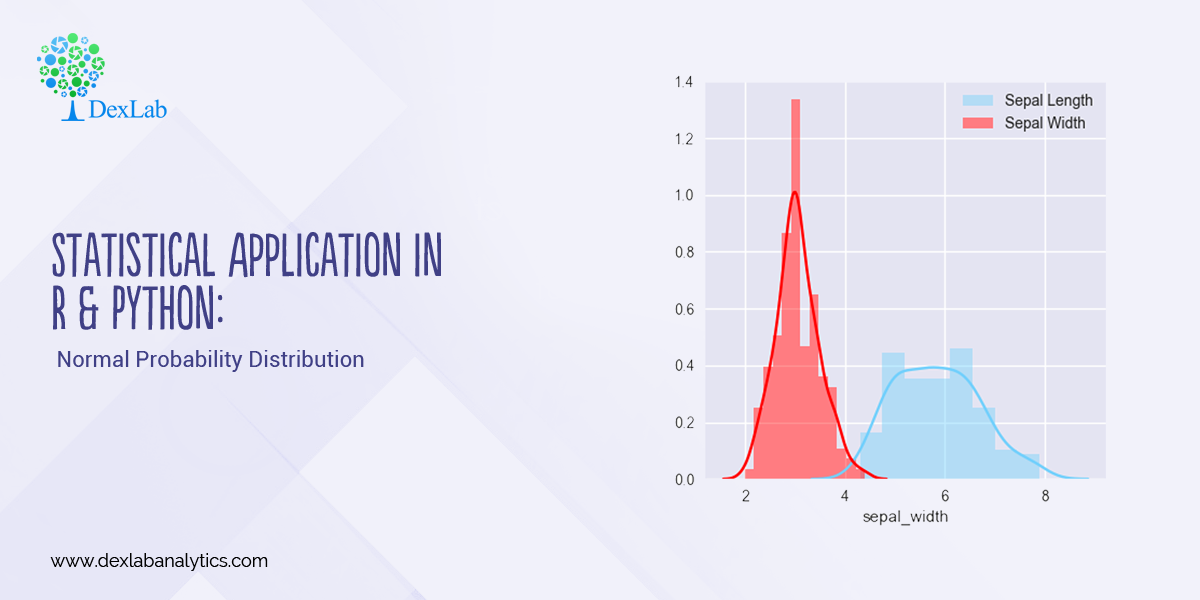
Every distribution has important features known as its “parameters”. Normal distribution has two parameters. These are Mean ( ) and Variance (σ²). The normal distribution has a bell-shaped curve, where the probability of likelihood peaks at its mean in the middle.

The Normal Distribution has vast practical applications in the field of Business, Finance, Medicine, and Physics and so on. Things like weights, heights, IQ scores follow the Normal Distribution.

Normal Distribution, Gaussian distribution, is a continuous probability distribution and is defined by the Probability Density Function (PDF).

Where,

Application:

Assume that the credit score fits a Normal Distribution.

Suppose Mr. Arjun’s last 10 month’s credit score are:

789, 635, 739, 687, 724, 810, 817, 735, 819, 820

What is the probability that the percentage of credit score will 825 or more in the 11th month?

Months

Credit Score

January

789

February

635

March

739

April

687

May

724

June

810

July

817

August

735

September

819

October

820


Calculating Normal Distribution in R:

If we go to calculate Normal Probability Distribution in R, we can predict that the probability of the 11th month credit score will be 825 or greater than that is 14.60%, whereas in another case, the probability of the 11th month credit score will be 825 or less than that is 85.40%.

Calculate Normal Distribution in Python:

Make a data frame of the data and calculate Mean and Standard Deviation for calculate Normal Distribution.

Now, we can easily calculate Normal Distribution in Python

So, in calculating the Normal Probability Distribution in Python, we can predict that the probability of the 11th month credit score will be 825 or greater than that is 14.60%, whereas in another case, the probability of the 11th month credit score will be 825 or less than that is 85.40%.

Conclusion:

Normal Distribution is used for calculating parameters. It is represented by the bell curve, where the total area of the curve is 1. Normal Distribution has its use in Finance, Business, Salaries, Blood Pressures, Measurement etc and many other fields.

Here, we have used Normal Distribution to predict Mr. Arjun’s 11th month credit score, and set the target (825). By Normal Distribution we can predict the percentage of possibility to achieve the target.

Calculating Binomial Distribution might be tricky for many but with Dexlab Analytics it won’t be hassle anymore. So, get hold of our STATISTICAL APPLICATION IN R AND PYTHON: CALCULATING BINOMIAL DISTRIBUTION blog, to get around all your problems.


Interested in a career in Data Analyst?

To learn more about Data Analyst with Advanced excel course – Enrol Now.
To learn more about Data Analyst with R Course – Enrol Now.
To learn more about Big Data Course – Enrol Now.

To learn more about Machine Learning Using Python and Spark – Enrol Now.
To learn more about Data Analyst with SAS Course – Enrol Now.
To learn more about Data Analyst with Apache Spark Course – Enrol Now.
To learn more about Data Analyst with Market Risk Analytics and Modelling Course – Enrol Now.
Machine Learning Significantly Aids in Improving the Business Performance: Learn the Hows

Machine Learning Significantly Aids in Improving the Business Performance: Learn the Hows

According to Forbes, Machine Learning is quickly growing up to be the biggest technology for the progress of businesses of the future. Furthermore, it will be able to add another $2.6 trillion in value, to the sales and marketing industry by 2020. Even in the field of manufacturing and logistics, it is estimated to add up to $2 trillion.

We are already seeing the extensive support that the AI-driven technology is lending to varied businesses which have joined hands with Machine Learning. This collaboration is bringing forth shocking results for the businesses, improving customer relationships, fueling sales and increasing the overall efficiency of the industry.

The total investments in Machine Learning are estimated to scale up reaching the $77 billion mark. So, if you want to enrol yourself for quality Machine Learning courses then, avail of the best Machine Learning course in India.

2

To Brief About Machine Learning

Machine Learning is a brand new and extremely progressive discipline at the core of which lies mathematics, statics and artificial intelligence (AI).

The basic difference between Artificial Intelligence and Machine Learning is that the former deals with the engineers writing programs for the AI to carry out specific tasks. Whereas, Machine Learning demands the engineers to write algorithms that can teach computers to write programs for themselves.

Machine Learning stresses primarily on developing the intelligence of a program and its capability of learning from past experiences. Thus, they learn from every previous interaction and each of the experiences from the past and finally, churns out the fitting solution, no matter what the circumstance is.

Therefore, a large number of businesses are incorporating Machine Learning, leading to the growth of their businesses and making their business future proof.

Deep Learning and AI using Python

To list down some of the ways how Machine Learning boosts the business performance are:

  • This new technology aids in developing software to understand the natural human language.
  • Machine Learning further improves the efficiency of logistics and transportation networks.
  • It also aids in building preventive maintenance, thereby lessening the equipment breakdowns and increasing profits.
  • Machine Learning can also be extremely useful in collecting consumer data to analyse customer profiles. This, in turn, will maximise sales and improve brand loyalty.

If you like our article, you can also find us on Facebook, Linkedin and subscribe for more such interesting articles on technology from Dexlab Analytics.


Interested in a career in Data Analyst?

To learn more about Data Analyst with Advanced excel course – Enrol Now.
To learn more about Data Analyst with R Course – Enrol Now.
To learn more about Big Data Course – Enrol Now.

To learn more about Machine Learning Using Python and Spark – Enrol Now.
To learn more about Data Analyst with SAS Course – Enrol Now.
To learn more about Data Analyst with Apache Spark Course – Enrol Now.
To learn more about Data Analyst with Market Risk Analytics and Modelling Course – Enrol Now.

Know the Trending Machine Learning Toolkits: For More Intelligent Mobile Apps

Know the Trending Machine Learning Toolkits: For More Intelligent Mobile Apps

With the progressive age, innovative and effective technologies like Artificial Intelligence and Machine Learning is dominating the scene of the present. Therefore, developers are rooting for machine learning models to be up to date with the present era. You can also avail of Neural Network Machine learning Python to keep pace with the modern advancements.

To say it, even mobile applications have come a long way from what they were earlier. With the cutting edge technologies of face recognition, speech recognition, recognition of different gestures and movements, mobile apps are really smart now. Furthermore, with the popularity of AI and machine learning, the mobile industry is looking forward to introducing them into the mobiles.

So, here you can catch a glimpse of the top 5 machine learning toolkits for a mobile developer to be aware of.

Apache PredictionIO

Apache PredictionIO is an effective machine learning server. It is open source in nature and acts as a source stack for the developers and data scientists. Through this tool, a developer can easily build and deploy an engine as a web service on production. It can then be easily utilised by the users, where they can run their own machine learning models seamlessly.

Caffe

The Convolutional Architecture for Fast Feature Embedding or Caffe, is an open-source framework developed by the AI Research of Berkeley. Caffe is growing up to be both powerful and popular as a computer vision framework that the developers can use to run machine vision tasks, image classification and more.

CoreML

CoreML is a machine learning framework from the house of Apple Inc. Through this app, you can implement machine learning models on your iOS. CoreML supports the vision to analyse images, natural language for processing natural language, speech for converting audio to text and even sound analysis for the identification of sounds in audio.

Eclipse Deeplearning4j

Eclipse Deeplearning4j is a formidable deep-learning library and is, in fact, the first commercial-grade, open-source one for Java and Scala. You can also integrate Eclipse with Hadoop and Apache Spark if you want to bring AI into the business environment.

Besides, it also acts as a DIY tool where, the programmers of Java, Scala and Clojure can configure the deep neural networks without any hassles. 

Data Science Machine Learning Certification

Google ML Kit

This is a machine learning software development kit for mobile app developers. Through this app, you can develop countless interactive features that you can run on Android and iOS. Here you will also get some readily available APIs for face recognition, to scan barcodes, labelling images and landmarks. With this app, you just need to feed in the data and see the app at its optimum performance.

These are some peerless Machine Learning toolkits to be incorporated into the mobiles. You can also avail of the Machine Learning course in Delhi if you are interested. 


.

Application of Harmonic Mean using R and Python

Application of Harmonic Mean using R and Python

Harmonic mean, for a set of observations is the number of observations divided by the sum of the reciprocals of the values and it cannot be defined if some of the values are zero.

This blog is in continuation with STATISTICAL APPLICATION IN R & PYTHON: CHAPTER 1 – MEASURE OF CENTRAL TENDENCY. However, here we will discover Harmonic mean and its application using Python and R.

2

Application:

A milk company sold milk at the rates of 10,16.5,5,13.07,15.23,14.56,12.5,12,30,32, 15.5, 16 rupees per liter in twelve different months (January-December), If an equal amount of money is spent on milk by a family in the ten months. Calculate the average price in rupees per month.

Table for the problem:

Month

Rates (Rupees/Liter)

January

10

February

16.5

March

5

April

13.07

May

15.23

June

14.56

July

12.5

August

12

September

30

October

32

November

15.5

December

16

Calculate Harmonic Mean in R:-

So, the average rate of the milk in rupees/liter is 12.95349 = 13 Rs/liter (Approx)

We get this answer from the Harmonic Mean, calculated in R.

Calculate Harmonic Mean in Python:-

First, make a data frame of the available data in Python.

Now, calculate the Harmonic mean from the following data frame.

So, the average rate of the milk in rupees/liter is 12.953491609077956 = 13 Rs/Liter (Approx)

We get this answer from Harmonic mean, calculated in Python.

Summing it Up:

In this data, we have a few large values which are putting an effect on the average value, if we calculate the average in Arithmetic mean, but in Harmonic mean, we get a perfect average from the data, and also for calculating the average rate.

Use of Harmonic mean is very limited. Harmonic mean gives the largest value to the smallest item and smallest value to the largest item.

Where there are a few extremely large or small values, Harmonic mean is preferable to Arithmetic mean as an average.

The Harmonic mean is mainly useful in averages involving time, rate & price.

Deep Learning and AI using Python

Note – If you want to learn the calculation of Geometric Mean, you can check our post on CALCULATING GEOMETRIC MEAN USING R AND PYTHON.

Dexlab Analytics is a peerless institute for Python Certification Training in Delhi. Therefore, for tailor-made courses in Python, Deep Learning, Machine Learning, Neural Networks, reach us ASAP!

You can even follow us on Social Media. We are available both in Facebook and Instagram.


Interested in a career in Data Analyst?

To learn more about Data Analyst with Advanced excel course – Enrol Now.
To learn more about Data Analyst with R Course – Enrol Now.
To learn more about Big Data Course – Enrol Now.

To learn more about Machine Learning Using Python and Spark – Enrol Now.
To learn more about Data Analyst with SAS Course – Enrol Now.
To learn more about Data Analyst with Apache Spark Course – Enrol Now.
To learn more about Data Analyst with Market Risk Analytics and Modelling Course – Enrol Now.

Summer Internship/Training 101

Summer Internship/Training 101

Hard Fact: Nowadays, all major organizations seek candidates who are technically sound, knowledgeable and creative. They don’t prefer spending time and money on employee training.  Thus, fresh college graduates face a tricky situation.

Summer internship is a quick solution for them. Besides guaranteeing a valuable experience to the fresh graduates, internship helps them secure a quick job. However, the question is what exactly is a summer internship program and how does it help bag the best job in town?

What Is a Summer Internship?

Summer internships are mostly industrial-level training programs for students who are interested in core technical industry domain. Such internships offer students hands-on learning experience while letting them gain glimpses of the real world – following a practical approach. Put simply, summer trainings enhance skills, sharpen theoretical knowledge and are a great way to pursue a flourishing career. In most cases, the candidates are hired by the companies in which they are interning.

The duration of such internships is mostly between eight to twelve weeks following the college semesters. Mostly, they start from May or June and proceeds through August. So, technically, this is the time for summer internships and at DexLab Analytics, we offer industry-relevant certification courses that break open a gamut of job opportunities. Also, such accredited certifications add value to your CV. They help build powerful CVs.

If you are a college student and from Delhi, NCR, drop by DexLab Analytics! Browse through our business analytics, risk analytics, machine learning and data science course sections. Summer internships are your key to success. Hurry now!

Deep Learning and AI using Python

Why Is It Important?

Summers are crucial. If you are college-goer, you will understand that summertime is the most opportune time to explore diverse career interests without being bogged down by homework or classroom assignments.

Day by day, summer internships are becoming popular. Not only do they expose aspiring candidates to the nuances of the big bad world but also hone their communication skills, create great resumes and make them super confident. Building confidence is extremely important. If you want to survive in this competitive industry, you have to present a confident version of you. Summer training programs are great in this respect. Plus, they add value to your resume. A good internship will help you get noticed by the prospective employers. Always, try to add references; however, ask permission from your supervisors before including their names as references in your resume.

Moreover, summer training gives you the scope to experiment and explore options. Suppose, you are pursuing Marketing Major and bagged an internship in the same, but you are not happy with it. Maybe, marketing is not your thing. No worries! Complete your internship and move on.  

On the other hand, let’s say you are very happy with your selected internship and want to do something in the respective field! Finish the internship, wait for some time and then try for recruitment in the same company where you interned or explore possibilities in the same domain.

2

It’s no wonder that summer internships open a roadway of opportunities. The technical aptitude and in-demand skills learned during the training help you accomplish your desired goal in life.

For more advice or expert guide, follow DexLab Analytics.


Interested in a career in Data Analyst?

To learn more about Data Analyst with Advanced excel course – Enrol Now.
To learn more about Data Analyst with R Course – Enrol Now.
To learn more about Big Data Course – Enrol Now.

To learn more about Machine Learning Using Python and Spark – Enrol Now.
To learn more about Data Analyst with SAS Course – Enrol Now.
To learn more about Data Analyst with Apache Spark Course – Enrol Now.
To learn more about Data Analyst with Market Risk Analytics and Modelling Course – Enrol Now.

AI-Related Tech Jargons You Need To Learn Right Now

AI-Related Tech Jargons You Need To Learn Right Now

As artificial intelligence gains momentum and becomes more intricate in nature, technological jargons may turn unfamiliar to you. Evolving technologies give birth to a smorgasbord of new terminologies. In this article, we have tried to compile a few of such important terms that are related to AI. Learn, assimilate and flaunt them in your next meeting.

Artificial Neuron Networks – Not just an algorithm, Artificial Neuron Networks is a framework containing different machine learning algorithms that work together and analyzes complex data inputs.

Backpropagation – It refers to a process in artificial neural networks used to discipline deep neural networks. It is widely used to calculate a gradient that is required in calculating weights found across the network.

2

Bayesian Programming – Revolving around the Bayes’ Theorem, Bayesian Programming declares the probability of something happening in the future based on past conditions relating to the event.

Analogical Reasoning – Generally, the term analogical indicates non-digital data but when in terms of AI, Analogical Reasoning is the method of drawing conclusions studying the past outcomes. It’s quite similar to stock markets.

Data Mining – It refers to the process of identifying patterns from fairly large data sets with the help statistics, machine learning and database systems in combination.

Decision Tree LearningUsing a decision tree, you can move seamlessly from observing an item to drawing conclusions about the item’s target value. The decision tree is represented as a predictive model, the observation as the branches and the conclusion as the leaves.  

Behavior Informatics (BI) – It is of extreme importance as it helps obtain behavior intelligence and insights.

Case-based Reasoning (CBR) – Generally speaking, it defines the process of solving newer challenges based on solutions that worked for similar past issues.

Feature Extraction – In machine learning, image processing and pattern recognition plays a dominant role. Feature Extraction begins from a preliminary set of measured data and ends up building derived values that intend to be non-redundant and informative – leading to improved subsequent learning and even better human interpretations.

Forward Chaining – Also known as forward reasoning, Forward Chaining is one of two main methods of reasoning while leveraging an inference engine. It is a widely popular implementation strategy best suited for business and production rule systems. Backward Chaining is the exact opposite of Forwarding Chaining.

Genetic Algorithm (GA) – Inspired by the method of natural selection, Genetic Algorithm (GA) is mainly used to devise advanced solutions to optimization and search challenges. It works by depending on bio-inspired operators like crossover, mutation and selection.

Pattern Recognition – Largely dependent on machine learning and artificial intelligence, Pattern Recognition also involves applications, such as Knowledge Discovery in Databases (KDD) and Data Mining.

Reinforcement Learning (RL) – Next to Supervised Learning and Unsupervised Learning, Reinforcement Learning is another machine learning paradigms. It’s reckoned as a subset of ML that deals with how software experts should take actions in circumstances so as to maximize notions of cumulative reward.

Looking for artificial intelligence certification in Delhi NCR? DexLab Analytics is a premier big data training institute that offers in-demand skill training courses to interested candidates. For more information, drop by our official website.

The article first appeared on— www.analyticsindiamag.com/25-ai-terminologies-jargons-you-must-assimilate-to-sound-like-a-pro


Interested in a career in Data Analyst?

To learn more about Data Analyst with Advanced excel course – Enrol Now.
To learn more about Data Analyst with R Course – Enrol Now.
To learn more about Big Data Course – Enrol Now.

To learn more about Machine Learning Using Python and Spark – Enrol Now.
To learn more about Data Analyst with SAS Course – Enrol Now.
To learn more about Data Analyst with Apache Spark Course – Enrol Now.
To learn more about Data Analyst with Market Risk Analytics and Modelling Course – Enrol Now.

A Beginner’s Guide to Learning Data Science Fundamentals

A Beginner’s Guide to Learning Data Science Fundamentals

I’m a data scientist by profession with an actuarial background.

I graduated with a degree in Criminology; it was during university that I fell in love with the power of statistics. A typical problem would involve estimating the likelihood of a house getting burgled on a street, if there has already been a burglary on that street. For the layman, this is part of predictive policing techniques used to tackle crime. More technically, “It involves a Non-Markovian counting process called the “Hawkes Process” which models for “self-exciting” events (like crimes, future stock price movements, or even popularity of political leaders, etc.)

Being able to predict the likelihood of future events (like crimes in this case) was the main thing which drew me to Statistics. On a philosophical level, it’s really a quest for “truth of things” unfettered by the inherent cognitive biases humans are born with (there are 25 I know of).

2

Arguably, Actuaries are the original Data Scientists, turning data in actionable insights since the 18th Century when Alexander Webster with Robert Wallace built a predictive model to calculate the average life expectancy of soldiers going to war using death records. And so, “Insurance” was born to provide cover to the widows and children of the deceased soldiers.

Of course, Alan Turing’s contribution cannot be ignored, which eventually afforded us with the computational power needed to carry out statistical testing on entire populations – thereby Machine Learning was born. To be fair, the history of Data Science is an entire blog of its own. More on that will come later.

The aim of this series of blogs is to initiate anyone daunted by the task of acquiring the very basics of Statistics and Mathematics used in Machine Learning. There are tonnes of online resources which will only list out the topics but will rarely explain why you need to learn them and to what extent. This series will attempt to address this problem adopting a “first principle” approach. Its best to refer back to this article a second time after gaining the very basics of each Topic discussed below:

We will be discussing:

  • Central Limit Theorem
  • Bayes Theorem
  • Probability Theory
  • Point Estimation – MLE’s
  • Confidence Intervals
  • P-values and Significance Test.

This list is by no means exhaustive of the statistical and mathematical concepts you will need in your career as a data scientist. Nevertheless, it provides a solid grounding going into more advanced topics.

Without further due, here goes:

Central Limit Theorem

Central Limit Theorem (CLT) is perhaps one of the most important results in all of Statistics. Essentially, it allows making large sample inference about the Population Mean (μ), as well as making large sample inference about population proportion (p).

So what does this really means?

Consider (X1, X2, X3……..Xn) samples, where n is a large number say, 100. Each sample will have its own respective sample Mean (x̅). This will give us “n” number of sample means. Central Limit Theorem now states:

                                                                                                &

Try to visualise the distribution “of the average of lots of averages”… Essentially, if we have a large number of averages that have been taken from a corresponding large number of samples; then Central Limit theorem allows us to find the distribution of those averages. The beauty of it is that we don’t have to know the parent distribution of the averages. They all tend to Normal… eventually!

Similarly if we were to add up independent and identically distributed (iid) samples, then their corresponding distribution will also tend to a Normal.

Very often in your work as a data scientist a lot of the unknown distributions will tend to Normal, now you can visualise how and more importantly why!

Stay tuned to DexLab Analytics for more articles discussing the topics listed above in depth. To deep dive into data science, I strongly recommend this Big Data Hadoop institute in Delhi NCR. DexLab offers big data courses developed by industry experts, helping you master in-demand skills and carve a successful career as a data scientist.

About the Author: Nish Lau Bakshi is a professional data scientist with an actuarial background and a passion to use the power of statistics to tackle various pressing, daily life problems.


Interested in a career in Data Analyst?

To learn more about Data Analyst with Advanced excel course – Enrol Now.
To learn more about Data Analyst with R Course – Enrol Now.
To learn more about Big Data Course – Enrol Now.

To learn more about Machine Learning Using Python and Spark – Enrol Now.
To learn more about Data Analyst with SAS Course – Enrol Now.
To learn more about Data Analyst with Apache Spark Course – Enrol Now.
To learn more about Data Analyst with Market Risk Analytics and Modelling Course – Enrol Now.

Now Machine Learning Can Predict Premature Death, Says Research

Now Machine Learning Can Predict Premature Death, Says Research

Machine Learning yet again added another feather in its cap; a team of researchers tried and tested a suave machine learning system that can now predict early death. Yes, premature death can now be estimated, courtesy a robust technology and an outstanding panel of researchers from the University of Nottingham! At first, it may sound weird and something straight out of a science fiction novel, but fret not – machine learning has proved itself in improving the status of preventive healthcare and now it’s ready to venture into new unexplored medical territories.

Prediction at Its Best

Published in PLOS ONE in one of their special editions of Machine Learning in Health and Biomedicine, the study delves into how myriad AI and ML tools can be leveraged across diverse healthcare fields. The technology of ML is already reaping benefits in cancer detection, thanks to its sophisticated quantitative power. These new age algorithms are well-equipped to predict death risks of chronic diseases way ahead of time from a widely distributed middle-aged population.

To draw clear conclusions, the team collected data of more than half a million people falling within the age group of 40 and 69 from the UK Biobank. The data collection is from the period 2006-2010, followed up till 2016. With this data in tow, the experts analyze biometric, demographic, lifestyle and clinical factors in each individual subject. Robust machine learning models are used in the process.

Adding in, the team observed dietary consumption of vegetables, fruits and meat per day of each subject. Later, the team from Nottingham University proceeded to predict the mortality of these individuals.

“We mapped the resulting predictions to mortality data from the cohort, using Office of National Statistics death records, the UK cancer registry and ‘hospital episodes’ statistics,” says Dr. Stephen Weng, assistant professor of Epidemiology and Data Science.  “We found machine-learned algorithms were significantly more accurate in predicting death than the standard prediction models developed by a human expert.”

Accuracy and Outcome

The researchers involved in this ambitious project are excited to the bones. They are eager about the outcomes. They are in fact looking forward to a time where medical professionals would be able to distinguish potential health hazards in patients with on-point accuracy and evaluate the following steps that would lead the way towards prevention. “We believe that by clearly reporting these methods in a transparent way, this could help with scientific verification and future development of this exciting field for health care”, shares Dr. Stephen Weng.

As closing thoughts, the research is expected to build the foundation of enhanced medicine capabilities and deliver customized healthcare facilities tailoring risk management for each individual patient. The Nottingham research draws inspiration from a similar study where machine learning techniques were used to predict cardiovascular diseases.

Data Science Machine Learning Certification

In case, you are interested in Machine Learning Using Python training course, DexLab Analytics is the place to be. With a volley of in-demand skill training courses, including Python certification training and AI training, we are one of the best in town. For details, check out our official website RN.

 
The blog has been sourced from
interestingengineering.com/machine-learning-algorithms-are-now-able-to-predict-premature-death


.

Call us to know more