Machine Learning Training Archives - Page 17 of 18 - DexLab Analytics | Big Data Hadoop SAS R Analytics Predictive Modeling & Excel VBA

Can We Fight Discrimination With Better Machine Learning?

Can We Fight Discrimination With Better Machine Learning?

With the increase in use of machine learning, for taking important corporate as well as national operational decisions, it is important to set across some core social domains. They will work to make sure that these decisions are not biased with discrimination against certain categories whatever they may be applied into.

In this post, we will discuss the crucial matters of “threshold classifiers”, a part of some machine learning operations that is critical to the issues of discrimination. With a threshold classifier one can essentially make a yes/no decision, which in turn helps to put things in perspective with one category or the other. Here we will take a look at how these classifiers work, the ways in which they can potentially be biased and how one may be able to turn an unfair classifier into a much fairer one.

By opting for a course on Machine Learning Using Python, you will be able to grasp the subject matter of this topic better.

In order to provide an illustrative example, we will concentrate on loan granting scenarios where the bank may approve or deny a loan based on one single, number computed automatically like a Credit score.

"<center

In the above-mentioned diagram, the dark dots represent people who do pay off their loans and debts, while the lighter dots show those who would not. In an ideal scenario, we may get to work with statistics that cleanly distinguish the classes as in the left example. However, sadly this is far more common to see a situation wherein at the right where the group overlaps.

A standalone statistic can stand in for several different variables, and boiling them down to just one number. In case of the credit score, which is evaluated by looking at several numbers of factors, that include income, promptness in debt repayment and much more. The number might even correctly represent the likelihood that a person may pay off a debt or also default, or might not. This relationship is actually pretty blurred and it is rare to find a statistic that correlates perfectly with real-world outcomes.

And that is exactly where the idea of a “threshold classifier” comes in: the bank selects a particular cut-off or threshold, and the people who have their credit scores are mentioned below it, will be denied of loans and people above it are usually granted the lending. However, real banks have several more additional complexities, but this simple model is often useful for studying some of the fundamental issues. Also to be clear, Google does not use credit scores for their products!

"<center
Take our credit risk management courses in Delhi to know more about financial management with data driven insights.

The above-mentioned diagram makes use of synthetic data to show how a threshold classifier works. For further simplification of the explanation, we will be staying away from realistic credit scores  or the data what you see shows just the simulated data with a score based on the range of 0 to 100.

As can be well understood, selecting a threshold needs some tradeoffs. Too low and the bank wil l end up giving loans to many people who default; if too high many people who actually do deserve a loan will not get them.

So, how to determine the right threshold? That is subjective. One important goal may be to maximize the number of appropriate decisions. (Can you tell us what threshold will do that in this example scenario?)

Another financial situational goal may be to, maximize profit. At the bottom of the above mentioned diagram, is a readout hypothetical “profit” which is based on the model wherein a successful loan will make USD 300, but a default will cost a bank USD 700. So what will be the most profitable threshold? And does it match the threshold with the maximum correct decisions?

Discrimination and categorization:

The aspect of how to make a correct decision is defined, and with sensitivities to which factors will become particularly thorny, when a statistic like a credit score ends up distributed separately in between the two teams.

Let us imagine that we have two teams of people ‘orange’ and ‘blue’. We are keen on making small loans, subject to the following rules:

  • A successful loan will make USD 300
  • But an unsuccessful loan will make USD 700
  • Everyone will have a credit score of range 0 to 100

DexLab Analytics offers credit risk analysis course online for the ease of promoting financial credit risk knowledge and data analytics know-how to the right personnel conveniently.

How to simulate loan decisions for different groups:

Drag the black threshold bars either left or right to alter the cut-offs for loans. Click on the varying preset loan strategies:

In the above mentioned case, the distributions of the two groups are slightly varying. While the blue and the orange people are equivalently likely to pay off a debt. But if you take look for a pair of thresholds that maximize total profit (or click on max profit button), then you will be able to see that the blue group is held in a slightly higher standard than the orange one.

How to improve machine-learning systems:

An important outcome of the paper by Hardt, Price, and Srebro depicted that – when mentioned essentially in any scoring system, it will be possible to efficiently to find the thresholds that meet any of the above mentioned criteria. Put in other words, even if you do not posses control over   the underlying scoring system (which is quite a common case) it will still be possible to attack the issue of discrimination.


Interested in a career in Data Analyst?

To learn more about Data Analyst with Advanced excel course – Enrol Now.
To learn more about Data Analyst with R Course – Enrol Now.
To learn more about Big Data Course – Enrol Now.

To learn more about Machine Learning Using Python and Spark – Enrol Now.
To learn more about Data Analyst with SAS Course – Enrol Now.
To learn more about Data Analyst with Apache Spark Course – Enrol Now.
To learn more about Data Analyst with Market Risk Analytics and Modelling Course – Enrol Now.
Pandora: Blending Music with Machine Learning

Pandora: Blending Music with Machine Learning
 

Erik Schmidt, a Senior Scientist at Pandora is going to propose an insight of recommendations and deeper challenges involved with Pandora at the Machine Intelligence Summit. This global tech event will take place in San Francisco on 23rd and 24th of March 2017. Continue reading “Pandora: Blending Music with Machine Learning”

Uber: Pioneering Machine Learning into Everything it Does

Uber is here as a mobile app, which allows you to request for a ride, but this company has never deemed itself to be a mere transportation service provider, rather it prefers to call itself a technology service provider, more like some logistics company.

 
Uber: Pioneering Machine Learning Into Everything It Does
 

More than a year ago, Danny Lange was appointed as the head of Machine Learning at Uber and he along with his team associates started operations from San Francisco. Being an ardent believer of the benefits that Machine learning can bring upon the society, Lange considers that AI and Machine Learning, if combined together can absolutely solve any business discrepancies, irrespective of the nature of the problem.

Continue reading “Uber: Pioneering Machine Learning into Everything it Does”

Facebook is planning to evaluate its quest for generalised AI

Facebook Artificial Intelligence Researchers

A major misconception about artificial intelligence is the fact that today’s robots possess a very generalized intelligence, however, we are fairly efficient in leveraging large datasets to accomplish otherwise complex tasks. Nevertheless we still fail and fall flat at the prospect of replicating the breadth of human intelligence.

Care to contribute to AI development in today’s world? Then take up a Machine Learning course online with us. But in order to move forward a generalized intelligence, Facebook is ensure that we know how to evaluate the process. In a recently released paper, Facebook’s AI research (FAIR) lab has outlined just that as a part of its CommAI framework.

2

We will need our systems to be able to communicate and will be able to learn through language effectively even when they lack in context and discussing thing in undefined terms.

Furthermore, such systems should be capable of learning up new skills, fairly simply. As per Facebook this skill set is called “learning to learn”. Present machine learning models may be trained on data and be used for classifying defined objects. We can also make use of transfer learning to quickly adapt a model to achieve the same task on the new data, however our machines cannot completely teach themselves without heavy to moderate intervention from the developers.

It is in general agreed upon, that in order to generalize across several tasks, a program should be capable of compositional training. And that is of storing and recombination solutions to sub-problems across the different tasks, as per the team from Facebook.

As per Facebook they consider these capabilities to be of more of a prerequisite to being a generalized AI than the true Turing test. Alan Turing created the original Turing test in the 1950s. It is usually understood to be a means of assessing machine learning intelligence with respect to human intelligence.

However, with the maturation of the field of Ai the Turing test has lost a lot of its relevance. Facebook hopes to offer a nice alternative way to think about the necessary requirements of a modern generalized AI which should be less of a research distraction than the more rigid Turing Test.

The team at FAIR which include – Marco Baroni, Armand Joulin, Allan Jabri, Germán Kruszewski, Angeliki Lazaridou, Klemen Simonic and Tomas Mikolov have also developed another open source platform for the testing and training of AI systems.

For more information on Machine Learning training in Gurgaon or in Delhi NCR, drop by our institute at DexLab Analytics.


Interested in a career in Data Analyst?

To learn more about Data Analyst with Advanced excel course – Enrol Now.
To learn more about Data Analyst with R Course – Enrol Now.
To learn more about Big Data Course – Enrol Now.

To learn more about Machine Learning Using Python and Spark – Enrol Now.
To learn more about Data Analyst with SAS Course – Enrol Now.
To learn more about Data Analyst with Apache Spark Course – Enrol Now.
To learn more about Data Analyst with Market Risk Analytics and Modelling Course – Enrol Now.
How to Parse Data with Python

How to Parse Data with Python

Before we begin with our Python tutorial on how to parse data with Python, we would like you to download this machine learning data file, and then get set to learn how to parse data.

The data set we have provided in the above link, mimics exactly the way the data was when we visited the web pages at that point of time, but the interesting thing about this is we need not visit the page even. We actually have the full HTML source code, so it is just like parsing the website without the annoying bandwidth use.

Now, the first thing to do when we start is to correspond the date to our data, and then we will pull the actual data.

Here is how we start:

import pandas as pd
import os
import time
from datetime import datetime

path = "X:/Backups/intraQuarter"

Looking for a Machine Learning course online? We have Big Data courses that will bring big dreams to reality.

As given above, we are importing the Pandas for the Pandas module, OS, that is so we can interact with the directories, date and time for managing the date and time information.

Furthermore, we will finally define the path, which is the path to the intraQuarter folder than one will need to unzip the original zip file, which you just downloaded from the website.

def Key_Stats(gather="Total Debt/Equity (mrq)"):
    statspath = path+'/_KeyStats'
    stock_list = [x[0] for x in os.walk(statspath)]
    #print(stock_list)

We began our functions, with the specification that we are going to try to collect all the Debt/equity values.

The path to the stats directory is Statspath.

To list all the contents in the directory, you can use stock_list which is a fast one-liner for the loop that uses os.walk.

Take up our Machine Learning training course with Python to know more about this in-demand skill!

Then the next step is to do this:

    for each_dir in stock_list[1:]:
        each_file = os.listdir(each_dir)
        if len(each_file) > 0:

Mentioned above is a cycling through of directory (which is every stock ticker). Then the next step is to list “each_file”, which is each file within that very stock’s directory. If in case the length of each_file which is in fact is a list of all of the files in the stock’s directory, is greater than 0 only then will we want to proceed. However, there are some stocks with no files or data:

            for file in each_file:

                date_stamp = datetime.strptime(file, '%Y%m%d%H%M%S.html')
                unix_time = time.mktime(date_stamp.timetuple())
                print(date_stamp, unix_time)
                #time.sleep(15)

Key_Stats()

Finally, at the end, we must run a loop that pulls the date_stamp, from each file. All our files are actually stored under their ticket, with a file name for the exact date and time from which the information is being taken out.

It is from there that we will explain to date-time what the format for our date stamp is, and then we will convert it to a Unix time stamp.

To know more about data parsing or anything else in python, learn Machine Learning Using Python with the experts at DexLab Analytics.


This post originally appeared onpythonprogramming.net/parsing-data-website-machine-learning


.

The Math Behind Machine Learning: How it Works

The Math Behind Machine Learning: How it Works

It is evident that in the last few months, we have had several people showcase their enthusiasm about venturing into the world of data science using Machine Learning techniques. They are keen on probing the statistical regularities and building impeccable data-driven products. but we have made an observation that some may actually lack the necessary mathematical knowledge and intuition to get the framework for achieving results with data. And this is why we have decided to discuss this lacking through our blog.

In the recent times, there has been a noticeable upsurge in the availability of several easy-to-use machine and deep learning packages such as Weka, Tensorflow, scikit learn etc. But you must understand that machine learning as a field is one that has both statistical concepts, probabilistic concepts, computer science and algorithmic concepts to arise from learning intuitively from available data and also is about determining the patterns and hidden insights, which can be used to build intelligent applications. While still having the immense possibilities of Machine Learning and Deep Learning which is a thorough mathematical understanding of many of these techniques which is necessary for a good grasp of the internal workings of algorithms to achieve a good result.

Enrol in the most comprehensive machine learning course in India with us.

Why we must think about the math?

To explain why it is necessary to behind the scenes into the mathematical details of Machine Learning, we have put own a few important points:

  1. To choose the right algorithm which will include giving considerations, to accuracy, to the right training time, complexity of model, number of parameters and the number of features.
  2. To choose parameter settings and to validate the strategies
  3. To indentify the under-fitting and over-fitting by understanding the bias-variance trade off.
  4. For acquiring ample confidence about the interval and uncertainty

 The level of math one will need:

The primary question when one tries to understand an interdisciplinary field such as Machine Learning, is the amount of math needed and the level of math needed to understand these techniques.

The answer to this question is not as simple as it may seem and is multidimensional which, depends upon the level and interest of the individual. Research conducted in these mathematical formulations and theoretical advancements for Machine Learning is an ongoing process and a few researchers are already working on few more advanced techniques. However, we will state the least amount of math that is a must have skill for being a successful Machine learning Engineer/ Scientist is the importance of each and every mathematical concept.

Linear algebra:

This is the math skill to have for the 21st century. One must be well-versed with the topics of Principal Component Analysis (PCA), Singular Value Decomposition (SVD), Eigendecomposition of a matrix, LU Decomposition, QR Decomposition/Factorization, Symmetric Matrices, Orthogonalization & Orthonormalization, Matrix Operations, Projections, Eigenvalues & Eigenvectors, Vector Spaces as these norms are absolutely necessary for the understanding and the optimization methods for machine learning. The best thing about linear algebra is that there are a lot of online resources.

Probability theory and statistics:

Machine learning and statistics are not too different a field. And in reality some people have actually defined Machine Learning as “doing statistics on a Mac”. A few fundamentals that are a must have for machine learning are – Combinatorics, Probability Rules & Axioms, Bayes’ Theorem, Random Variables, Variance and Expectation, Conditional and Joint Distributions, Standard Distributions (Bernoulli, Binomial, Multinomial, Uniform and Gaussian), Moment Generating Functions, Maximum Likelihood Estimation (MLE), Prior and Posterior, Maximum a Posteriori Estimation (MAP) and Sampling Methods.

Multivariate calculus:

Differential and Integral Calculus, Partial Derivatives, Vector-Values Functions, Directional Gradient, Hessian, Jacobian, Laplacian and Lagragian Distribution are some of the necessary topics necessary for understanding ML.

Data Science Machine Learning Certification

Algorithms and Complex Optimizations:

In order to realize the computational efficiency and scalability of our Machine Learning Algorithm and for exploiting the sparsity in the dataset, this concept is necessary. One must have knowledge of data structures such as Binary Trees, Hashing, Heap, Stack etc, and Dynamic Programming, Randomized & Sublinear Algorithm, Graphs, Gradient/Stochastic Descents and Primal-Dual methods.

A few other mathematical skills that are often necessary for understanding ML are the following Real and Complex Analysis (Sets and Sequences, Topology, Metric Spaces, Single-Valued and Continuous Functions, Limits), Information Theory (Entropy, Information Gain), Function Spaces and Manifolds.

Machine learning training in Gurgaon from experts with in-depth instruction on math skills is offered at DexLab Analytics. Check out our Machine learning certification brochure for the same at the website. 


.

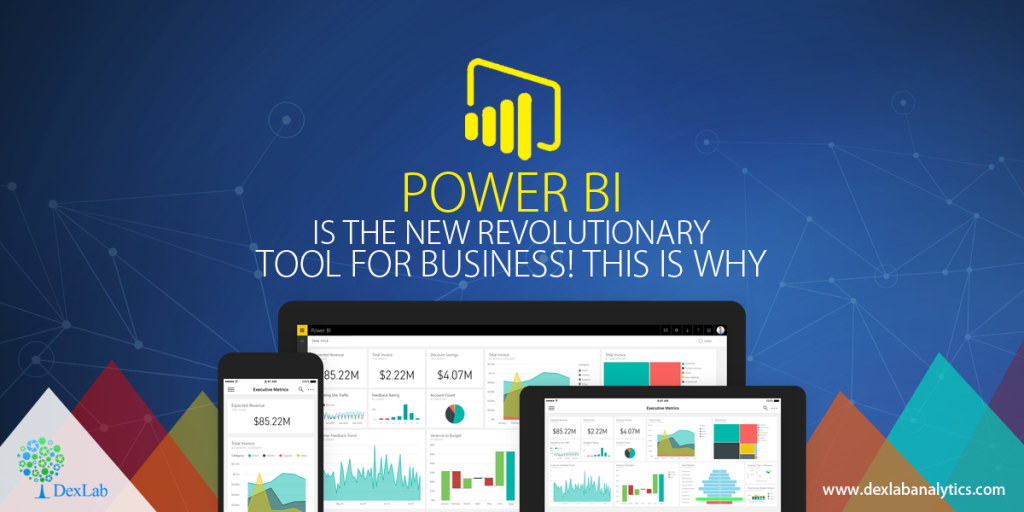
Power BI is The New Revolutionary Tool For Business! This is Why

Power BI is The New Revolutionary Tool For Business! This is Why

Microsoft launched its Power BI tool quite some time ago now, and the way things seem to advance is pretty amazing to say the least. This is a great Business Intelligence and analytics tool and it seems it is only a matter of time before the Power BI becomes the tool of choice for Business Intelligence and analytical works in almost all of the foresighted corporations.

This is a powerful BI tool now available in the hands of enterprises, who are looking to extract data from multiple disparate sources in order to derive meaningful insights from it. The tool offers unprecedented interactive visualization opportunities along with true self-servicing analytical capacities.

With all of these it helps the whole look of the same data to appear from varying angles and also allows the reports and dashboards to be made by anybody within the organization without assistance from IT administrators and developers.

The international analytics and BI market is to reach the mark of  USD 16.9 Billion in 2016 says Gartner!

Are you keen on acquiring a Big Data certification then check out DexLab Analytic’s Machine Learning courses in Delhi now!

Power BI is leading the way in cloud business analytics and intelligence. It offers the services, which can directly be harnessed from the cloud, and it is a huge advantage when it comes to how BI can be utilized. The desktop version of power BI is also available and is known as the Power BI desktop.

The entire range of ordinary tasks can be performed with this Power BI like – data discovery, data preparation, designing of the interactive dashboards. Microsoft also went a step ahead by putting up the embedded version of Power BI in its highly revered Azure cloud platform.

The company already has a pretty good presence in the analytics environment with its popular products like SSAS – SQL Server Analysis Service. However, it did not have any strong presence in the BI delivery system and OLAP segment i.e. Online Analytical Processing.

Excel for a long time has been Microsoft’s attempt at being a presentation layer for its data analysis tools. However, Excel has a lot of disadvantages like limited memory, integrity issues with data which are the main reasons why it is often not very appealing to the corporate clients who want something more malleable for business analytics.

You can give your career a powerful boost with Big Data training from the leading Big Data training institute in Delhi NCR.

Data Science Machine Learning Certification

However, a really powerful BI tool is what takes Excel to a great new level; it helps to offer a whole new experience to working with tools like Power Query for data extraction and its transformation. The Power Pivot tool which, is deployed for data analysis and modelling and lastly, the Power View which, is used to map the data and visualize it distinctly in unprecedented ways. With Power Bi one can put all of these tools into a consolidated manner and will make it easier to work without having to depend on to MS Office solely.

In closing thoughts, thus, it is safe to say that Power Bi is putting the right use of power in the right hands of the customers. so, a power BI training can be a good decision for one’s career at this point, for those who consider themselves as a forward-thinking IT professional.  


.

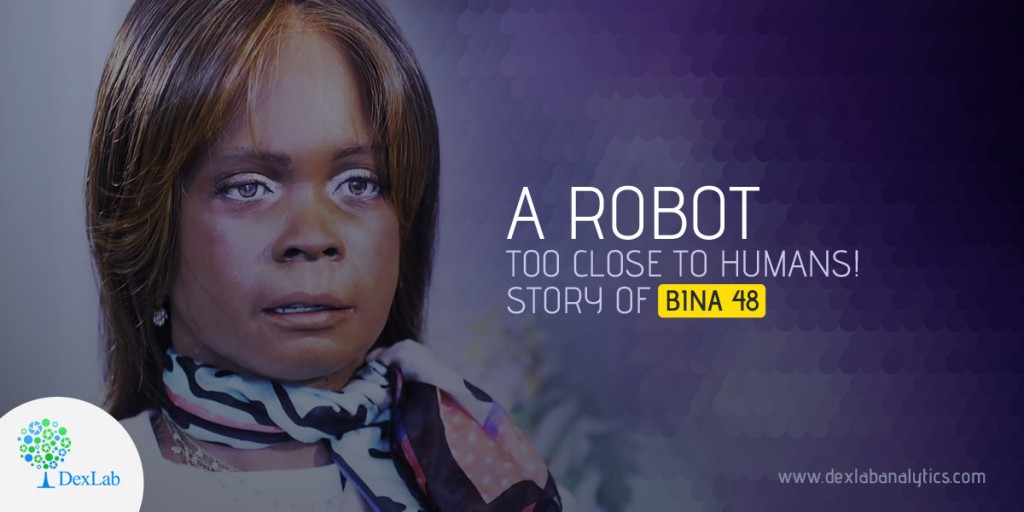
A robot too close to humans! Story of BINA 48

BINA 48 is the world’s most renowned and highly sought after humanoid robot in America. You can visit her there, by driving down a long winding dirt road just west of the Lincoln Gap in Bristol, Vt. Where sits two large yellow houses on a sprawling property that features ten solar panels and a dock over-looking the sunlit pond filled with trout, a homely porch decorated with rocking chairs.

Advances in Machine Learning and Data Analysis Bina 48


In the smaller of the two houses resides BINA 48, who is one of the most sought after humanoid who is based on a real personality – Bina Rothblatt.

Continue reading “A robot too close to humans! Story of BINA 48”

How to Assess Clustering Tendency: Unsupervised Machine Learning

How To Assess Clustering Tendency: Unsupervised Machine Learning

The meaning of clustering algorithms include partitioning methods (PAM, K-means, FANNY, CLARA etc) along with hierarchical clustering which are used to split the dataset into two groups or clusters of similar objects.

A natural question that comes, before applying any clustering method on the dataset is:

Does the dataset comprise of any inherent clusters?

A big problem associated to this, in case of unsupervised machine learning is that clustering methods often return clusters even though the data does not include any clusters. Put in other words, if one blindly applies a clustering analysis on a dataset, it will divide the data into several clusters because that is precisely what they are supposed to do. Continue reading “How to Assess Clustering Tendency: Unsupervised Machine Learning”

Call us to know more