Machine Learning Courses Archives - Page 7 of 16 - DexLab Analytics | Big Data Hadoop SAS R Analytics Predictive Modeling & Excel VBA

Python Statistics Fundamentals: How to Describe Your Data? (Part II)

Python Statistics Fundamentals: How to Describe Your Data? (Part II)

In the first part of this article, we have seen how to describe and summarize datasets and how to calculate types of measures in descriptive statistics in Python. It’s possible to get descriptive statistics with pure Python code, but that’s rarely necessary.

Python is an advanced programming language extensively used in all of the latest technologies of Data Science, Deep Learning and Machine learning. Furthermore, it is particularly responsible for the growth of the Machine Learning course in IndiaMoreover, numerous courses like Deep Learning for Computer vision with Python, Text Mining with Python course and Retail Analytics using Python are pacing up with the call of the age. You must also be in line with the cutting-edge technologies by enrolling with the best Python training institute in Delhi now, not to regret it later.

In this part, we will see the Python statistics libraries which are comprehensive, popular, and widely used especially for this purpose. These libraries give users the necessary functionality when crunching data. Below are the major Python libraries that are used for working with data.

Data Science Machine Learning Certification

NumPy and SciPy – Fundamental Scientific Computing

NumPy stands for Numerical Python. The most powerful feature of NumPy is the n-dimensional array. This library also contains basic linear algebra functions, Fourier transforms, advanced random number capabilities. NumPy is much faster than the native Python code due to the vectorized implementation of its methods and the fact that many of its core routines are written in C (based on the CPython framework).

For example, let’s create a NumPy array and compute basic descriptive statistics like mean, median, standard deviation, quantiles, etc.

SciPy stands for Scientific Python, which is built on NumPy. NumPy arrays are used as the basic data structure by SciPy.

Scipy is one of the most useful libraries for a variety of high-level science and engineering modules like discrete Fourier transforms, Linear Algebra, Optimization and Sparse matrices. Specifically in statistical modelling, SciPy boasts of a large collection of fast, powerful, and flexible methods and classes. It can run popular statistical tests such as t-test, chi-square, Kolmogorov-Smirnov, Mann-Whitney rank test, Wilcoxon rank-sum, etc. It can also perform correlation computations, such as Pearson’s coefficient, ANOVA, Theil-Sen estimation, etc.

Pandas – Data Manipulation and Analysis

Pandas library is used for structured data operations and manipulations. It is extensively used for data preparation. The DataFrame() function in Pandas takes a list of values and outputs them in a table. Seeing data enumerated in a table gives a visual description of a data set and allows for the formulation of research questions on the data.

The describe() function outputs various descriptive statistics values, except for the variance. The variance is calculated using the var() function in Pandas.

The mean() function, returns the mean of the values for the requested axis.

Matplotlib – Plotting and Visualization

Matplotlib is a Python library for creating 2D plots. It is used for plotting a wide variety of graphs, starting from histograms to line plots to heat plots. One can use Pylab feature in IPython notebook (IPython notebook –pylab = inline) to use these plotting features inline. If the inline option is ignored, then pylab converts IPython environment to an environment, very similar to Matlab.

matplotlib.pylot is a collection of command style functions.

If a single list array is provided to the plot() command, matplotlib assumes it is a sequence of Y values and internally generates the X value for you.

Each function makes some change to a figure, like creating a figure, creating a plotting area in a figure, decorating the plot with labels, etc. Now, let us create a very simple plot for some given data, as shown below:

Scikit-learn – Machine Learning and Data Mining

Scikit-learn built on NumPy, SciPy and matplotlib. Scikit-learn is the most widely used Python library for classical machine learning. But, it is necessary to include it in the discussion of statistical modeling as many classical machine learning (i.e. non-deep learning) algorithms can be classified as statistical learning techniques. This library contains a lot of efficient tools for machine learning and statistical modeling including classification, regression, clustering and dimensional reduction.

Conclusion

In this article, we covered a set of Python open-source libraries that form the foundation of statistical modelling, analysis, and visualization. On the data side, these libraries work seamlessly with the other data analytics and data engineering platforms, such as Pandas and Spark (through PySpark). For advanced machine learning tasks (e.g. deep learning), NumPy knowledge is directly transferable and applicable in popular packages such as TensorFlow and PyTorch. On the visual side, libraries like Matplotlib, integrate nicely with advanced dashboarding libraries like Bokeh and Plotly.


https://pandas.pydata.org/pandas-docs/stable/reference/api/pandas.DataFrame.html


Interested in a career in Data Analyst?

To learn more about Data Analyst with Advanced excel course – Enrol Now.
To learn more about Data Analyst with R Course – Enrol Now.
To learn more about Big Data Course – Enrol Now.

To learn more about Machine Learning Using Python and Spark – Enrol Now.
To learn more about Data Analyst with SAS Course – Enrol Now.
To learn more about Data Analyst with Apache Spark Course – Enrol Now.
To learn more about Data Analyst with Market Risk Analytics and Modelling Course – Enrol Now.

Automation is to Highly Impact the Knowledge Workers

Automation is to Highly Impact the Knowledge Workers

Automation will mainly target the knowledge workers, who are highly paid and educated and involved in thinking and analytical jobs.

The robot revolution is anticipated for quite some time now and with the ongoing advancements in Machine Learning, Artificial Intelligence and Data Science, the future is near. However, it is also one of the most dreaded events for the workers going forward, who would be vulnerable to losing their respective jobs.

Going back to the 2017 McKinsey study, around 50% of the jobs in the manufacturing industries are automatable using the latest technology. However, according to the latest report, the white-collar workers, who are well-read and engaged in thinking and analytical jobs, are more likely to suffer the most.

According to a new study conducted by Michael Webb, Stanford University Economist, the powerful technologies of computer science like Artificial Intelligence and Machine Learning, which can make human-like decisions and grow using real-time data, will eventually target the white-collar workers. Artificial Intelligence has already made marked intrusions in the white-collar jobs, like telemarketing, which are primarily overseen by the bots. However, with the tireless efforts of the Data Scientists, along with the expansion of the Machine Learning course in India, it is believed to oust the majority of the knowledge workers, like chemical engineers, market researchers, market analysts, physicists, librarians and more.

Data Science Machine Learning Certification

The new research focuses on the intersecting subject-noun pairs in AI patents and job descriptions to find out the jobs that will be heavily affected by the Ai technology. For example, the job descriptions of market research analysts comprise of “data analysis”, “identifying markets” and “track market trends”, which are in fact, all covered by the AI patents that are existing. This new study looks far more progressive than the previous ones because it analyzes patents for the technology which are yet to develop completely.

With the rising trends of Data Science and Machine Learning, Artificial Intelligence has really come a long way from what an imaginary concept. Thus, courses like Machine Learning Using Python and Python for Data Analysis, are in heavy demands. 


This article has been sourced fromwww.vox.com/recode/2019/11/20/20964487/white-collar-automation-risk-stanford-brookings


Interested in a career in Data Analyst?

To learn more about Data Analyst with Advanced excel course – Enrol Now.
To learn more about Data Analyst with R Course – Enrol Now.
To learn more about Big Data Course – Enrol Now.

To learn more about Machine Learning Using Python and Spark – Enrol Now.
To learn more about Data Analyst with SAS Course – Enrol Now.
To learn more about Data Analyst with Apache Spark Course – Enrol Now.
To learn more about Data Analyst with Market Risk Analytics and Modelling Course – Enrol Now.

Decoding Advanced Loss Functions in Machine Learning: A Comprehensive Guide

Decoding Advanced Loss Functions in Machine Learning: A Comprehensive Guide

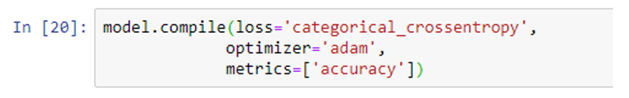
Every Machine Learning algorithm (Model) learns by the process of optimizing the loss functions. The loss function is a method of evaluating how accurate the given prediction is made. If predictions are off, then loss function will output a higher number. If they’re pretty good, it’ll output a lower number. If someone makes changes in the algorithm to improve the model, loss function will show the path in which one should proceed.

Machine Learning is growing as fast as ever in the age we are living, with a host of comprehensive Machine Learning course in India pacing their way to usher the future. Along with this, a wide range of courses like Machine Learning Using Python, Neural Network Machine Learning Python is becoming easily accessible to the masses with the help of Machine Learning institute in Gurgaon and similar institutes.

Data Science Machine Learning Certification

We are having different types of loss functions.

  • Regression Loss Functions
  • Binary Classification Loss Functions
  • Multi-class Classification Loss Functions

Regression Loss Functions

  1. Mean Squared Error
  2. Mean Absolute Error
  3. Huber Loss Function

Binary Classification Loss Functions

  1. Binary Cross-Entropy
  2. Hinge Loss

Multi-class Classification Loss Functions

  1. Multi-class Cross Entropy Loss
  2. Kullback Leibler Divergence Loss

Mean Squared Error

Mean squared error is used to measure the average of the squared difference between predictions and actual observations. It considers the average magnitude of error irrespective of their direction.

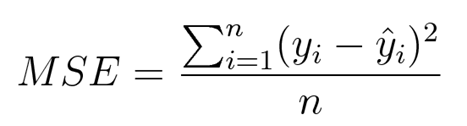
This expression can be defined as the mean value of the squared deviations of the predicted values from that of true values. Here ‘n’ denotes the total number of samples in the data.

Mean Absolute Error

Absolute Error for each training example is the distance between the predicted and the actual values, irrespective of the sign.

MAE = | y-f(x) |

Absolute Error is also known as the L1 loss. The MAE cost is more robust to outliers as compared to MSE.
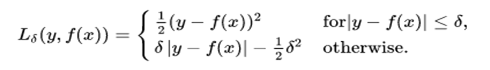
Huber Loss

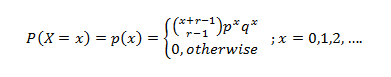
Huber loss is a loss function used in robust regression. This is less sensitive to outliers in data than the squared error loss. The Huber loss function describes the penalty incurred by an estimation procedure f. Huber (1964) defines the loss function piecewise by:

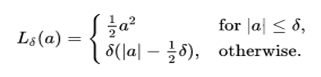
This function is quadratic for small values of a, and linear for large values, with equal values and slopes of the different sections at the two points where |a|= 𝛿. The variable “a” often refers to the residuals, that is to the difference between the observed and predicted values a=y-f(x), so the former can be expanded to: –

Binary Classification Loss Functions

Binary classifications are those predictive modelling problems where examples are assigned one of two labels.

Binary Cross-Entropy

Cross-Entropy is the loss function used for binary classification problems. It is intended for use with binary classification.

Mathematically, it is the preferred loss function under the inference framework of maximum likelihood. Cross-entropy will calculate a score that summarizes the average difference between the actual and predicted probability distributions for predicting class 1. The score is minimized and a perfect cross-entropy value is 0.

Hinge Loss

The hinge loss function is popular with Support Vector Machines (SVMs). These are used for training the classifiers,

l(y) = max(0, 1- t•y)

where ‘t’ is the intended output and ‘y’ is the classifier score.

Hinge loss is convex function but is not differentiable which reduces its options for minimizing with few methods.

Multi-Class Classification Loss Functions

Multi-Class classifications are those predictive modelling problems where examples are assigned one of more than two classes.

Multi-Class Cross-Entropy

Cross-Entropy is the loss function used for multi-class classification problems. It is intended for use with multi-class classification.

Mathematically, it is the preferred loss function under the inference framework of maximum likelihood. Cross-entropy will calculate a score that summarizes the average difference between the actual and predicted probability distributions for all classes. The score is minimized and a perfect cross-entropy value is 0.

Kullback Leibler Divergence Loss

KL divergence is a natural way to measure the difference between two probability distributions.

A KL divergence loss of 0 suggests the distributions are identical. In practice, the behaviour of KL Divergence is very similar to cross-entropy. It calculates how much information is lost (in terms of bits) if the predicted probability distribution is used to approximate the desired target probability distribution.

There are also some advanced loss functions for machine learning models which are used for specific purposes.

  1. Robust Bi-Tempered Logistic Loss based on Bregman Divergences
  2. Minimax loss for GANs
  3. Focal Loss for Dense Object Detection
  4. Intersection over Union (IoU)-balanced Loss Functions for Single-stage Object Detection
  5. Boundary loss for highly unbalanced segmentation
  6. Perceptual Loss Function

Robust Bi-Tempered Logistic Loss based on Bregman Divergences

In this loss function, we introduce a temperature into the exponential function and replace the softmax output layer of the neural networks by a high-temperature generalization. Similarly, the logarithm in the loss we use for training is replaced by a low-temperature logarithm. By tuning the two temperatures, we create loss functions that are non-convex already in the single-layer case. When replacing the last layer of the neural networks by our bi-temperature generalization of the logistic loss, the training becomes more robust to noise. We visualize the effect of tuning the two temperatures in a simple setting and show the efficacy of our method on large datasets. Our methodology is based on Bregman divergences and is superior to a related two-temperature method that uses the Tsallis divergence.

Minimax loss for GANs

Minimax GAN loss refers to the minimax simultaneous optimization of the discriminator and generator models.

Minimax refers to an optimization strategy in two-player turn-based games for minimizing the loss or cost for the worst case of the other player.

For the GAN, the generator and discriminator are the two players and take turns involving updates to their model weights. The min and max refer to the minimization of the generator loss and the maximization of the discriminator’s loss.

Focal Loss for Dense Object Detection

The Focal Loss is designed to address the one-stage object detection scenario in which there is an extreme imbalance between foreground and background classes during training (e.g., 1:1000). Therefore, the classifier gets more negative samples (or more easy training samples to be more specific) compared to positive samples, thereby causing more biased learning.

The large class imbalance encountered during the training of dense detectors overwhelms the cross-entropy loss. Easily classified negatives comprise the majority of the loss and dominate the gradient. While the weighting factor (alpha) balances the importance of positive/negative examples, it does not differentiate between easy/hard examples. Instead, we propose to reshape the loss function to down-weight easy examples and thus, focus training on hard negatives. More formally, we propose to add a modulating factor (1 − pt) γ to the cross-entropy loss, with tunable focusing parameter γ ≥ 0. 

We define the focal loss as

FL(pt) = −(1 − pt) γ log(pt)


Intersection over Union (IoU)-balanced Loss Functions for Single-stage Object Detection

The IoU-balanced classification loss focuses on positive scenarios with high IoU can increase the correlation between classification and the task of localization. The loss aims at decreasing the gradient of the examples with low IoU and increasing the gradient of examples with high IoU. This increases the localization accuracy of models.

Boundary loss for highly unbalanced segmentation

Boundary loss takes the form of a distance metric on the space of contours (or shapes), not regions. This can mitigate the difficulties of regional losses in the context of highly unbalanced segmentation problems because it uses integrals over the boundary (interface) between regions instead of unbalanced integrals over regions. Furthermore, a boundary loss provides information that is complementary to regional losses. Unfortunately, it is not straightforward to represent the boundary points corresponding to the regional softmax outputs of a CNN. Our boundary loss is inspired by discrete (graph-based) optimization techniques for computing gradient flows of curve evolution.

Following an integral approach for computing boundary variations, we express a non-symmetric L2L2 distance on the space of shapes as a regional integral, which avoids completely local differential computations involving contour points. This yields a boundary loss expressed with the regional softmax probability outputs of the network, which can be easily combined with standard regional losses and implemented with any existing deep network architecture for N-D segmentation. We report comprehensive evaluations on two benchmark datasets corresponding to difficult, highly unbalanced problems: the ischemic stroke lesion (ISLES) and white matter hyperintensities (WMH). Used in conjunction with the region-based generalized Dice loss (GDL), our boundary loss improves performance significantly compared to GDL alone, reaching up to 8% improvement in Dice score and 10% improvement in Hausdorff score. It also yielded a more stable learning process.

Perceptual Loss Function

We consider image transformation problems, where an input image is transformed into an output image. Recent methods for such problems typically train feed-forward convolutional neural networks using a \emph{per-pixel} loss between the output and ground-truth images. Parallel work has shown that high-quality images can be generated by defining and optimizing \emph{perceptual} loss functions based on high-level features extracted from pre-trained networks. We combine the benefits of both approaches and propose the use of perceptual loss functions for training feed-forward networks for image transformation tasks. We show results on image style transfer, where a feed-forward network is trained to solve the optimization problem proposed by Gatys et al in real-time. Compared to the optimization-based method, our network gives similar qualitative results but is three orders of magnitude faster. We also experiment with single-image super-resolution, where replacing a per-pixel loss with a perceptual loss gives visually pleasing results.

Conclusion

Loss function takes the algorithm from theoretical to practical and transforms neural networks from matrix multiplication into deep learning. In this article, initially, we understood how loss functions work and then, we went on to explore a comprehensive list of loss functions also we have seen the very recent — advanced loss functions.

References: –
 
https://arxiv.org
https://www.wikipedia.org
 

Interested in a career in Data Analyst?

To learn more about Data Analyst with Advanced excel course – Enrol Now.
To learn more about Data Analyst with R Course – Enrol Now.
To learn more about Big Data Course – Enrol Now.

To learn more about Machine Learning Using Python and Spark – Enrol Now.
To learn more about Data Analyst with SAS Course – Enrol Now.
To learn more about Data Analyst with Apache Spark Course – Enrol Now.
To learn more about Data Analyst with Market Risk Analytics and Modelling Course – Enrol Now.

A Step-by-Step Guide on Python Variables

A Step-by-Step Guide on Python Variables

Variable is the name given to the memory location where data is stored. Once a variable is stored, space is allocated in memory. Variables are named locations that are used to store references to the object stored in memory.

With the rapid rise of the advanced programming techniques, matching with the pacing advancements of Machine Learning and Artificial Intelligence, the need for Python for Data Analysis an Machine Learning Using Python is growing. However, when it comes to trustworthy courses, it is better to go for the best Python Certification Training in Delhi.

Now, coming to this article, here are some of the topics that will be covered in this article:

  • Rules to Define a Variable
  • Assigning Values to a Variable
  • Re-declaring a Variable in Python
  • Variable Scope
  • Deleting a Variable

Data Science Machine Learning Certification

Rules to Define a Variable

These are the few rules to define a python variable:

  1. Python variable name can contain small case letters (a-z), upper case letters (A-Z), numbers (0-9), and underscore (_).
  2. A variable name can’t start with a number.
  3. We can’t use reserved keywords as a variable name.
  4. The variable name can be of any length.
  5. Python variable can’t contain only digits.
  6. The variable names are case sensitive.

Assigning Values to a Variable

There is no need for an explicit declaration to reserve memory. The assignment is done using the equal to (=) operator.

Multiple Assignment in Python

Multiple variables can be assigned to the same variable.

Multi-value Assignment in Python

Multiple variables can be assigned to multiple objects.

Re-declaring a Variable in Python

After declaring a variable, one can again declare it and assign a new value to it. Python interpreter discards the old value and only considers the new value. The type of the new value can be different than the type of the old value.

Variable Scope

A variable scope defines the area of accessibility of the variable in the program. A Python variable has two scopes:

  1. Local Scope
  2. Global Scope

Python Local Variable

When a variable is defined inside a function or a class, then it’s accessible only inside it. They are called local variables and their scope is only limited to that function or class boundary.

If we try to access a local variable outside its scope, we get an error that the variable is not defined.

Python Global Variable

When the variable is not inside a function or a class, it’s accessible from anywhere in the program. These variables are called global variables.

Deleting a Variable

One can delete variable using the command “del”.

In the example below, the variable “d” is deleted by using command Del and when it is further proceeded to print, we get an error “variable name is not defined” which means the variable is already deleted.

Conclusion

In this article we have learned the concepts of Python variables which are used in every program. We also learned the rules associated to the naming of a variable, assigning value to a variable, scope of a variable and deleting a variable.

So, if you are also hooked into Python and looking for the best courses, Python course in Gurgaon is certainly a gem of a course!


This technical blog is sourced from: www.askpython.com and intellipaat.com


Interested in a career in Data Analyst?

To learn more about Data Analyst with Advanced excel course – Enrol Now.
To learn more about Data Analyst with R Course – Enrol Now.
To learn more about Big Data Course – Enrol Now.

To learn more about Machine Learning Using Python and Spark – Enrol Now.
To learn more about Data Analyst with SAS Course – Enrol Now.
To learn more about Data Analyst with Apache Spark Course – Enrol Now.
To learn more about Data Analyst with Market Risk Analytics and Modelling Course – Enrol Now.

What is a Neural Network?

What is a Neural Network?

Before we get started with the process of building a Neural Network, we need to understand first what a Neural Network is.

A neural network is a collection of neurons connected by synapses. This collection is organized into three main layers: the input layer, the hidden layer, and the output layer.

In an artificial neural network, there are several inputs, which are called features, producing a single output, known as a label.

Analogy between Human Mind and Neural Network

Scientists believe that a living creature’s brain processes information through the use of a biological neural network. The human brain has as many as 100 trillion synapses – gaps between neurons – which form specific patterns when activated.

In the field of Deep Learning, a neural network is represented by a series of layers that work much like a living brain’s synapses. It is becoming a popular course now, with an array of career opportunities. Thus, Deep learning Certification in Gurgaon is a must for everyone.

Scientists use neural networks to teach computers how to do things for themselves. The whole concept of Neural network and its varied applications are pretty interesting. Moreover, with the matchless Neural Networks Training in Delhi, you need not look any further.

There are numerous kinds of deep learning and neural networks:

  1. Feedforward Neural Network – Artificial Neuron
  2. Radial basis function Neural Network
  3. Kohonen Self Organizing Neural Network
  4. Recurrent Neural Network (RNN) – Long Short Term Memory
  5. Convolutional Neural Network
  6. Modular Neural Network
  7. Generative adversarial networks (GANs)

Data Science Machine Learning Certification

Working of a Simple Feedforward Neural Network

  1. It takes inputs as a matrix (2D array of numbers).
  2. Multiplies the input by a set weight (performs a dot product aka matrix multiplication).
  3. Applies an activation function.
  4. Returns an output.
  5. Error is calculated by taking the difference from the desired output from the data and the predicted output. This creates our gradient descent, which we can use to alter the weights.
  6. The weights are then altered slightly according to the error.
  7. To train, this process is repeated 1,000+ times. The more the data is trained upon, the more accurate our outputs will be.

Implementation of a Neural Network with Python and Keras

Keras has two types of models:

  • Sequential model
  • The model class used with functional API

Sequential model is probably the most used feature of Keras. Primarily, it represents the array of Keras Layers. It is convenient and builds different types of Neural Networks really quick, just by adding layers to it. Keras also has different types of Layers like Dense Layers, Convolutional Layers, Pooling Layers, Activation Layers, Dropout Layers etc.

The most basic layer is Dense Layer. It has many options for setting the inputs, activation function and so on. So, let’s see how one can build a Neural Network using Sequential and Dense. 

First, let’s import the necessary code from Keras:

After this step, the model is ready for compilation. The compilation step asks to define the loss function and the kind of optimizer which should be used. These options depend on the problem one is trying to solve.

Now, the model is ready to get trained. Thus, the parameters get tuned to provide the correct outputs for a given input. This can be done by feeding inputs at the input layer and then, getting an output.

After this one can calculate the loss function using the output and use backpropagation to tune the model parameters. This will fit the model parameters to the data.

Output of the above cell:-

This output shows the loss decrease and the accuracy increase over time. At this point, one can experiment with the hyper-parameters and neural network architecture to get the best accuracy.

After getting the final model architecture, one can now take the model and use feed-forward passes and predict inputs. To start making predictions, one can use the testing dataset in the model that has been created previously. Keras enables one to make predictions by using the .predict() function.

Some points to be remembered while building a strong Neural Network

1. Adding Regularization to Fight Over-Fitting

The predictive models mentioned above are prone to a problem of overfitting. This is a scenario whereby the model memorizes the results in the training set and isn’t able to generalize on data that it hasn’t seen.

In neural networks, regularization is the technique that fights overfitting by adding a layer in the neural network. It can be done in 3 ways:

  • L1 Regularization
  • L2 Regularization
  • Dropout Regularization

Out of these, Dropout is a commonly used regularization technique. In every iteration, it adds a Dropout layer in the neural network and thereby, deactivates some neurons. The process of deactivating neurons is usually random.

2. Hyperparameter Tuning

Grid search is a technique that you can use to experiment with different model parameters to obtain the ones that give you the best accuracy. This is done by trying different parameters and returning those that give the best results. It helps in improving model accuracy.

Conclusion

Neural Network is coping with the fast pace of the technology of the age remarkably well and thereby, inducing the necessity of courses like Neural Network Machine Learning PythonNeural Networks in Python course and more. Though these advanced technologies are just at their nascent stage, they are promising enough to lead the way to the future. 

In this article, Building and Training our Neural Network is shown. This simple Neural Network can be extended to Convolutional Neural Network and Recurrent Neural Network for more advanced applications in Computer Vision and Natural Language Processing respectively.

Reference Blogs:

https://keras.rstudio.com

https://www.khanacademy.org/math/precalculus/x9e81a4f98389efdf:matrices/x9e81a4f98389efdf:multiplying-matrices-by-matrices/v/matrix-multiplication-intro


Interested in a career in Data Analyst?

To learn more about Data Analyst with Advanced excel course – Enrol Now.
To learn more about Data Analyst with R Course – Enrol Now.
To learn more about Big Data Course – Enrol Now.

To learn more about Machine Learning Using Python and Spark – Enrol Now.
To learn more about Data Analyst with SAS Course – Enrol Now.
To learn more about Data Analyst with Apache Spark Course – Enrol Now.
To learn more about Data Analyst with Market Risk Analytics and Modelling Course – Enrol Now.

Statistical Application in R & Python: Negative Binomial Distribution

Statistical Application in R & Python: Negative Binomial Distribution

Negative binomial distribution is a special case of Binomial distribution. If you haven’t checked the Exponential Distribution, then read through the Statistical Application in R & Python: EXPONENTIAL DISTRIBUTION.

It is important to know that the Negative Binomial distribution could be of two different types, i.e. – Type 1 and Type 2. In many ways, it could be seen as a generalization of the geometric distribution. The Negative Binomial Distribution essentially operates on the same principals as the binomial distribution but the objective of the former is to model for the success of an event happening in “n” number of trials. Here it is worth observing that the Geometric distribution models for the first success whereas a Negative Binomial distribution models for the Kth 

Data Science Machine Learning Certification

This is explained below.

Type 1 Binomial distribution  aims to model the trails up to and including the “kth success” in “n number of trials”. To give a simple example, imagine you are asked to predict the probability that the fourth person to hear a gossip will believe that! This kind of prediction could be made using the negative binomial type 1 distribution. 

Conversely, Type 2 Binomial distribution is used to model the number of failures before the “kth success”. To give an example, imagine you are asked about how many penalty kicks it will take before a goal is scored by a particular football player. This could be modeled using a negative binomial type 2 distribution, which might be pretty tricky or almost impossible with any other methods.

The probability distribution function is given below: 

In the next section, we will take you through its practical application in Python and R. 

Application:

Mr. Singh works in an Insurance Company where his target is to sale a minimum of five policies in a day. On a particular day, he had already sold 2 policies after numerous attempts. The probability of sales on each policy is 0.6. Now, if the policies may be considered as independent Bernoulli trials, then:

  1. What is the probability that he has exactly 4 failed attempts before his 3rd successful sales of the day?
  2. What is the probability that he was fewer than 4 failed attempts before his 3rd successful sales of the day?

So, the number of sales = 3.

The probability of failed attempts is 4.

The success of each sale is 0.6.

Calculate Negative Binomial Distribution in R:

In R, we calculate negative binomial distribution to find the probability of insurance sales. Thus, we get,

  1. The probability that he has exactly 4 failed attempts before his 3rd successful sales are 8.29%.
  2. The probability that he has fewer than 4 failed attempts before his 3rd successful sales is 82.08%.

Hence, we can see that chances are quite high that Mr. Singh will succeed in making a sale after 4 failed attempts.

Calculate Negative Binomial Distribution in Python:

In Python, we get the same results as above.

Conclusion:

Negative Binomial distribution is the discrete probability distribution that is actually used for calculating the success and failure of any observation. When applied to real-world problems, the outcomes of the successes and failures may or may not be the outcomes we ordinarily view as good and bad, respectively.

Suppose we used the negative binomial distribution to model the number of days a certain machine works before it breaks down. In this case, “success” would be the days that the machine worked properly, whereas the day when the machine breaks down would be a “failure”. Another example would be, if we used the negative binomial distribution to model the number of attempts an athlete makes on goal before scoring r goals, though, then each unsuccessful attempt would be a “success”, and scoring a goal would be “failure”.

This blog will surely aid in developing a better understanding of how negative binomial distribution works in practice. If you have any comments please leave them below. Besides, if you are interested in catching up with the cutting edge technologies, then reach the premium training institute of Data Science and Machine Learning leading the market with the top-notch Machine Learning course in India.


Interested in a career in Data Analyst?

To learn more about Data Analyst with Advanced excel course – Enrol Now.
To learn more about Data Analyst with R Course – Enrol Now.
To learn more about Big Data Course – Enrol Now.

To learn more about Machine Learning Using Python and Spark – Enrol Now.
To learn more about Data Analyst with SAS Course – Enrol Now.
To learn more about Data Analyst with Apache Spark Course – Enrol Now.
To learn more about Data Analyst with Market Risk Analytics and Modelling Course – Enrol Now.

How to Structure Python Programs? An Extensive Guide

How to Structure Python Programs? An Extensive Guide

Python is an extremely readable and versatile high-level programming language. It supports both Object-oriented programming as well as Functional programming. It is generally referred to as an interpreted language which means that each line of code is executed one by one and if the interpreter finds an error it stops proceeding further and gives an error message to the user. This makes Python a widely regarded language, fueling Machine Learning Using Python, Text Mining with Python course and more. Furthermore, with such a high-end programming language, Python for data analysis looks ahead for a bright future.

Data Science Machine Learning Certification

In the Structure of Python

Computer languages have a structure just like human languages. Therefore, even in Python, we have comments, variables, literals, operators, delimiters, and keywords.

To understand the program structure of Python we will look at the following in this article: –

  1. Python Statement
    • Simple Statement
    • Compound Statement
  2. Multiple Statements Per Line
  3. Line Continuation
    • Implicit Line Continuation
    • Explicit Line Continuation
  4. Comments
  5. Whitespace
  6. Indentation
  7. Conclusion

Python Statement

A statement in Python is a logical instruction that the interpreter reads and executes. The interpreter executes statements sequentially, one by one. In Python, it could be an assignment statement or an expression. The statements are mostly written in such a style so that each statement occupies a single line.

Simple Statements

A simple statement is one that contains no other statements. Therefore, it lies entirely within a logical line. An assignment is a simple statement that assigns values to variables, unlike in some other languages; an assignment in Python is a statement and can never be part of an expression.

Compound Statement

A compound statement contains one or more other statements and controls their execution. A compound statement has one or more clauses, aligned at the same indentation. Each clause has a header starting with a keyword and ending with a colon (:), followed by a body, which is a sequence of one or more statements. When the body contains multiple statements, also known as blocks, these statements should be placed on separate logical lines after the header line, indented four spaces rightward.

Multiple Statements per Line

Although it is not considered good practice multiple statements can be written in a single line in Python. It is advisable to avoid multiple statements in a single line. But, if it is necessary, then it can be written with the help of semicolon (;) as the terminator of every statement.

Line Continuation

In Python there might be some cases when a single statement is too long that does not fit the browser window and one needs to scroll the screen left or right. This can be a case of assignment statement with many terms or defining a lengthy nested list. These long statements of code are generally considered a poor practice.

To maintain readability, it is advisable to split the long statement into parts across several lines. In Python code, a statement can be continued from one line to the next in two different ways: implicit and explicit line continuation.

Implicit Line Continuation

This is the more straightforward technique for line continuation. In implicit line continuation, one can split a statement using either of parentheses ( ), brackets [ ] and braces { }. Here, one needs to enclose the target statement using the mentioned construct.

Explicit Line Continuation

In cases where implicit line continuation is not readily available or practicable, there is another option. This is referred to as an explicit line continuation or explicit line joining. Here, one can right away use the line continuation character (\) to split a statement into multiple lines.

Comments

A comment is text that doesn’t affect the outcome of a code; it is just a piece of text to let someone know what you have done in a program or what is being done in a block of code. This is especially helpful when a code is written and someone is analyzing it for bug fixing or making a change in logic, by reading a comment one can understand the purpose of code much faster than by just going through the actual code.

There are two types of comments in Python.
1. Single line comment
2. Multiple line comment

Single line comment

In python, one can use # special character to start the comment.

Multi-line comment

To have a multi-line comment in Python, one can use Triple Double Quotation at the beginning and the end of the comment.

Whitespace

One can improve the readability of the code with the use of whitespaces. Whitespaces are necessary for separating the keywords from the variables or other keywords. Whitespace is mostly ignored by the Python interpreter.

Indentation

Most of the programming languages provide indentation for better code formatting and don’t enforce to have it. However, in Python, it is mandatory to obey the indentation rules. Typically, we indent each line by four spaces (or by the same amount) in a block of code. Also for creating compound statements, the indentation will be of utmost necessity.

Conclusion

So, this article was all about how to structure the Python program. Here, one can learn what constitutes a valid Python statement and how to use implicit and explicit line continuation to write a statement that spans multiple lines. Furthermore, one can also learn about commenting Python code, and about the use of whitespace and indentation to enhance the overall readability.

Our Machine Learning Certifications have undergone an industrial upgradation

We hope this article was helpful to y ou. If you are interested in similar blogs, stay glued to our website, and keep following all the news and updates from Dexlab Analytics.


Interested in a career in Data Analyst?

To learn more about Data Analyst with Advanced excel course – Enrol Now.
To learn more about Data Analyst with R Course – Enrol Now.
To learn more about Big Data Course – Enrol Now.

To learn more about Machine Learning Using Python and Spark – Enrol Now.
To learn more about Data Analyst with SAS Course – Enrol Now.
To learn more about Data Analyst with Apache Spark Course – Enrol Now.
To learn more about Data Analyst with Market Risk Analytics and Modelling Course – Enrol Now.

Machine Learning in the Healthcare Sector

Machine Learning in the Healthcare Sector

The healthcare industry is one of the most important industries when it comes to human welfare. Research analysis from the U.S. federal government actuaries say that Americans spent $3.65 trillion on health care in 2018(report from Axios) and the Indian healthcare market is expected to reach $ 372 billion by 2022. To reduce cost and to move towards a personalized healthcare system, the industry faces three major hurdles: –

1) Electronic record management
2) Data integration
3) Computer-aided diagnoses.

Machine learning in itself is a vast field with a wide array of tools, techniques, and frameworks that can be exploited and manipulated to cope with these challenges. In today’s time, Machine Learning Using Python is proving to be very helpful in streamlining the administrative processes in hospitals, map and treat life-threatening diseases and personalizing medical treatments.

This blog will focus primarily on the applications of Machine learning in the domain of healthcare.

Real-life Application of Machine learning in the Health Sector

  1. MYCIN system was incepted at Stanford University. The system was developed in order to detect specific strains of bacteria that cause infections. It proposed a good therapy in 69% of the cases which was at that time better than infectious disease experts.
  2. In the 1980s at the University of Pittsburgh, a diagnostic tool named INTERNIST-I was developed to diagnose symptoms of various diseases like flu, pneumonia, diabetes and more. One of the key functionalities of the INTERNIST-I was to be able to detect the problem areas. This is done with a view of being able to remove diagnostics’ likelihood.
  3. AI trained by researchers from Pennsylvania has been developed recently which is capable of predicting patients who are most likely to die within a year. This is assessed based on their heart test results. This AI is capable of predicting the death of patients even if the figures look quite normal to the doctors. The researchers have trained the AI with 1.77 million electrocardiograms (ECG) results. The researchers have made two versions of this Al: one with just the ECG data and the other one with ECG data along with the age and gender of the patients.
  4. P1vital’s PReDicT (Predicting Response to Depression Treatment) built on the Machine Learning algorithms aims to develop a commercially feasible way to diagnose and provide treatment of depression in clinical practice.
  5. KenSci has developed machine learning algorithms to predict illnesses and their cure to enable doctors with the ability to detect specific patterns and indicators of population health risks. This comes under the purview of model disease progression.
  6. Project Hanover developed by Microsoft is using Machine Learning-based technologies for multiple purposes, which includes the development of AI-based technology for cancer treatment and personalizing drug combination for Acute Myeloid Leukemia (AML).
  7. Preserving data in the health care industry has always been a daunting task. However, with the forward-looking steps in analytics-related technology, it has become more manageable over the years. The truth is that even now, a majority of the processes take a lot of time to complete.
  8. Machine learning can prove to be disruptive in the medical sector by automating processes relating to data collection and collation. This is highly profitable in terms of cost-effectiveness. Newer algorithms such as Vector Machines or OCR recognition are designed to automate the task of document reading and classification with high levels of precision and accuracy.

  9. PathAI’s technology uses machine learning to help pathologists make faster and more accurate diagnoses. Furthermore, it also helps in identifying patients who might benefit from a new and different type of treatments or therapies in the future.

Data Science Machine Learning Certification

To Sum Up:

As the modern technologies of Machine Learning, Artificial Intelligence and Big Data Analytics are tottering forth in multiple domains, there is a long path they need to walk to ensure an unflinching success. Besides, it is also important for every one of us to be accustomed to all these new-age technologies.

With an expansion of the quality Machine Learning course in India and Neural Network Machine learning Python, all the reputed institutes are joining hands together to bring in the revolution. The initial days will be slow and hard, but it is no doubt that these cutting edge technologies will transform the medical industry along with a range of other industries, making early diagnoses possible along with a reduction of the overall cost. Besides, with the introduction of successful recommender systems and other promises of personalized healthcare, coupled with systematic management of medical records, Machine Learning will surely usher in the future for good! 


.

Deep Learning and its Progress as Discussed at Intel’s AI Summit

Deep Learning and its Progress as Discussed at Intel’s AI Summit

At the latest AI summit organized by Intel, Mr. Naveen Rao, Vice President and General Manager of Intel’s AI Products Group, focused on the most vibrant age of computing that is the present age we are living. According to Rao, the widespread and sudden growth of neural networks is putting the capability of the hardware into a real test. Therefore, we now have to reflect deeply on “how processing, network, and memory work together” to figure a pragmatic solution, he said.

The storage of data has seen countless improvements in the last 20 years. We can now boast of our prowess of handling considerably large sets of data, with greater computing capability in a single place. This led to the expansion of the neural network models with an eye on the overall progress in neural Network Machine Learning Python and computing in general.

2

With the onset of exceedingly large data sets to work with, Deep learning for Computer Vision Course and the other models of Deep Learning to recognize speech, images, and text are extensively feeding on them. The technological giants were undoubtedly the early birds to grab the technical: the hardware and the software configuration to have an edge on the others.  

Surely, Deep Learning is on its peak now, where computers can identify the images with incredible vividness. On the other hand, chatbots can carry on with almost natural conversations with us. It is no wonder that the Deep learning Training Institutes all over the world are jumping in the race to bring all of these new technologies efficiently to the general mass.

The Big Problem

We are living in the dynamic age of AI and Machine Learning, with the biggies like Google, Facebook, and its peers, having the technical skills and configuration to take up the challenges. However, the neural networks have fattened up so much lately that it has already started to give the hardware a tough time, getting the better of them all the time.

Deep Learning and AI using Python

The number of parameters of the Neural network models is increasing as never before. They are “actually increasing on the order of 10x year on year”, as per Rao. Thus, it is a wall looming in AI. Though Intel is trying its best to tackle this obvious wall, which might otherwise give the industry a severe setback, with extensive research to bring new chip architectures and memory technologies into play, it cannot solve the AI processing problem single-handedly. Rao concluded on a note of requesting the partners in the present competitive scenario.


Sourced from: www.datanami.com/2019/11/13/deep-learning-has-hit-a-wall-intels-rao-says


Interested in a career in Data Analyst?

To learn more about Data Analyst with Advanced excel course – Enrol Now.
To learn more about Data Analyst with R Course – Enrol Now.
To learn more about Big Data Course – Enrol Now.

To learn more about Machine Learning Using Python and Spark – Enrol Now.
To learn more about Data Analyst with SAS Course – Enrol Now.
To learn more about Data Analyst with Apache Spark Course – Enrol Now.
To learn more about Data Analyst with Market Risk Analytics and Modelling Course – Enrol Now.

Call us to know more