Machine Learning course online Archives - Page 6 of 11 - DexLab Analytics | Big Data Hadoop SAS R Analytics Predictive Modeling & Excel VBA

A Nifty Guide to Initiate AIOps in 2019

A Nifty Guide to Initiate AIOps in 2019

AIOps (artificial intelligence for IT operations) is the buzz word of the 21st century.

In this digitally-charged world, AIOps platforms are the key. They fuse ML and big data functionalities to boost and partly replace primary IT operations’ programs, including event correlation and analysis, performance monitoring and IT service automation and management.

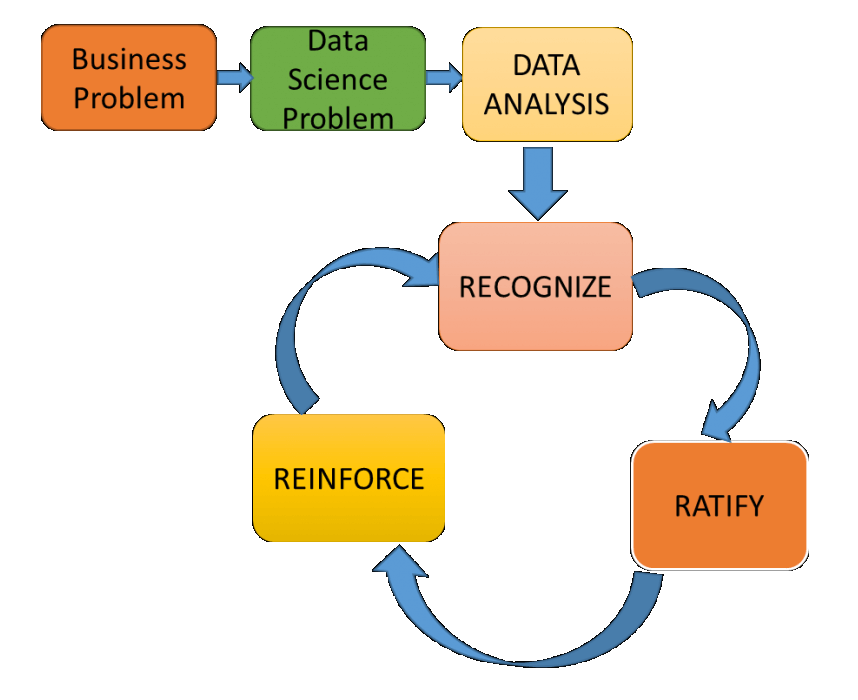
In simple terms, AIOps is the combined application of data science and machine learning to help mitigate IT operations-related challenges and find faster insights. It fixes high-severity outages in a jiffy. 

The main objective of revolutionary AIOps platforms is to ingest and analyze the aggravating volume, variety and velocity of data and deliver it in a useful manner.

Deep Learning and AI using Python

IT bigwigs are excited about the prospects of applying AI and ML to IT operations.

Gartner expects that big enterprises’ usage of AIOps and other monitoring tools and applications will rise from 5% in 2018 to 30% in 2023. The long-term impact of AIOps on IT operations is predicted to be transformative.

Fortunately, AI capabilities are making headway, and more real-time solutions are being formulated and made available each day.

Read on to know how to get started with AIOPs:

Be prepared

First and foremost, you have to familiarize yourself with all the ML and AI capabilities and vocabulary. It doesn’t matter if you are gearing up for an AIOps project or not. Capabilities and priorities change; so be ready to implement the platform anytime soon.

Select the first few test cases carefully

Small and steady wins the race. The same phrase applies to transformation initiatives. They start small, seize knowledge and iterate from there. Imbibe the same approach for AIOps success.

Enhance your proficiency

Decode the intricacies of AIOps amongst your colleagues by displaying simple techniques. Ascertain your skills and identify the loopholes, then devise a relevant plan to fill up those gaps in-between.

Feel free to experiment

Although a majority of AIOps platforms are complex and costly, there is a substantial number of open-source and relatively low-cost ML software available in the market that lets you evaluate the efficacy of AIOps and ML applications and their uses.

Look beyond IT

Don’t forget to leverage all kinds of data analytics resources available in your organization. Data management is the cornerstone of AIOps. Most of the teams are already skilled in it. Statistical analytics and business analysis are key components of contemporary business frameworks, and many techniques traverse public domains. 

2

Standardize and modernize, as and when required

Prepare your work infrastructure to implement a robust AIOps adoption by embracing secure automation architecture, immutable infrastructure patterns and infrastructure as code (IaC).

Interested in learning more about Machine Learning Using Python? Feel free to reach us at DexLab Analytics. We’re a premier learning platform specialized in offering in-demand skill training courses to the interested candidates.


The blog has been sourced from ― www.gartner.com/smarterwithgartner/how-to-get-started-with-aiops


Interested in a career in Data Analyst?

To learn more about Data Analyst with Advanced excel course – Enrol Now.
To learn more about Data Analyst with R Course – Enrol Now.
To learn more about Big Data Course – Enrol Now.

To learn more about Machine Learning Using Python and Spark – Enrol Now.
To learn more about Data Analyst with SAS Course – Enrol Now.
To learn more about Data Analyst with Apache Spark Course – Enrol Now.
To learn more about Data Analyst with Market Risk Analytics and Modelling Course – Enrol Now.

Statistical Application in R & Python: Normal Probability Distribution

Statistical Application in R & Python: Normal Probability Distribution

Gauss, the famous French Mathematician is responsible for developing one of the most significant distributions in all of statistics, i.e. – The Normal Distribution. Please refer to the blog on Central Limit Theorem: www.dexlabanalytics.com/blog/the-almighty-central-limit-theorem. It will help you fully grasp the significance of the Normal Distribution. However, if you want to revisit our series of blogs by following it from the start, you can reach STATISTICAL APPLICATION IN R & PYTHON: CHAPTER 1 – MEASURE OF CENTRAL TENDENCY right now!

Essentially, the Normal Distribution provides “approximations” to most other distributions such as the Binomial, Poisson, Gamma, Exponential, etc. This is to say as sample sizes get statistically large enough, most distributions approximate into a normal shaped curve.

Every distribution has important features known as its “parameters”. Normal distribution has two parameters. These are Mean ( ) and Variance (σ²). The normal distribution has a bell-shaped curve, where the probability of likelihood peaks at its mean in the middle.

The Normal Distribution has vast practical applications in the field of Business, Finance, Medicine, and Physics and so on. Things like weights, heights, IQ scores follow the Normal Distribution.

Normal Distribution, Gaussian distribution, is a continuous probability distribution and is defined by the Probability Density Function (PDF).

Where,

Application:

Assume that the credit score fits a Normal Distribution.

Suppose Mr. Arjun’s last 10 month’s credit score are:

789, 635, 739, 687, 724, 810, 817, 735, 819, 820

What is the probability that the percentage of credit score will 825 or more in the 11th month?

Months

Credit Score

January

789

February

635

March

739

April

687

May

724

June

810

July

817

August

735

September

819

October

820


Calculating Normal Distribution in R:

If we go to calculate Normal Probability Distribution in R, we can predict that the probability of the 11th month credit score will be 825 or greater than that is 14.60%, whereas in another case, the probability of the 11th month credit score will be 825 or less than that is 85.40%.

Calculate Normal Distribution in Python:

Make a data frame of the data and calculate Mean and Standard Deviation for calculate Normal Distribution.

Now, we can easily calculate Normal Distribution in Python

So, in calculating the Normal Probability Distribution in Python, we can predict that the probability of the 11th month credit score will be 825 or greater than that is 14.60%, whereas in another case, the probability of the 11th month credit score will be 825 or less than that is 85.40%.

Conclusion:

Normal Distribution is used for calculating parameters. It is represented by the bell curve, where the total area of the curve is 1. Normal Distribution has its use in Finance, Business, Salaries, Blood Pressures, Measurement etc and many other fields.

Here, we have used Normal Distribution to predict Mr. Arjun’s 11th month credit score, and set the target (825). By Normal Distribution we can predict the percentage of possibility to achieve the target.

Calculating Binomial Distribution might be tricky for many but with Dexlab Analytics it won’t be hassle anymore. So, get hold of our STATISTICAL APPLICATION IN R AND PYTHON: CALCULATING BINOMIAL DISTRIBUTION blog, to get around all your problems.


Interested in a career in Data Analyst?

To learn more about Data Analyst with Advanced excel course – Enrol Now.
To learn more about Data Analyst with R Course – Enrol Now.
To learn more about Big Data Course – Enrol Now.

To learn more about Machine Learning Using Python and Spark – Enrol Now.
To learn more about Data Analyst with SAS Course – Enrol Now.
To learn more about Data Analyst with Apache Spark Course – Enrol Now.
To learn more about Data Analyst with Market Risk Analytics and Modelling Course – Enrol Now.

Application of Mode using R and Python

Application of Mode using R and Python

Mode, for a given set of observations, is that value of the variable, where the variable occurs with the maximum or the highest frequency.

This blog is in continuation with STATISTICAL APPLICATION IN R & PYTHON: CHAPTER 1 – MEASURE OF CENTRAL TENDENCY. However, here we will elucidate the Mode and its application using Python and R.

Mode is the most typical or prevalent value, and at times, represents the true characteristics of the distribution as a measure of central tendency.

Application:

The numbers of the telephone calls received in 245 successive one minute intervals at an exchange are shown in the following frequency distribution table:


No of Calls
Frequency
0
14
1
21
2
25
3
43
4
51
5
40
6
51
7
51
8
39
9
12
Total
245


 [Note: Here we assume total=245 when we calculate Mean from the same data]

Evaluate the Mode from the data.

Evaluate the Mode from the data

Calculate Mode in R:

Calculate mode in R from the data, i.e. the most frequent number in the data is 51.

The number 51 repeats itself in 5, 7 and 8 phone calls respectively.

Calculate Median in Python:

First, make a data frame for the data.

Now, calculate the mode from the data frame.

Calculate mode in Python from the data, i.e. the most frequent number in the data is 51.

The number 51 repeats itself in 5, 7 and 8 phone calls respectively.

Mode is used in business, because it is most likely to occur. Meteorological forecasts are, in fact, based on mode calculations.

The modal wage of a group of the workers is the wages which the largest numbers of workers receive, and as such, this wage may be considered as the representative wage of the group.

In this particular data set we use the mode function to know the occurrence of the highest number of phone calls.

It will thus, help the Telephone Exchange to analyze their data flawlessly.

2

Note – As you have already gone through this post, now, if you are interested to know about the Harmonic Mean, you can check our post on the APPLICATION OF HARMONIC MEAN USING R AND PYTHON.

Dexlab Analytics is a formidable institute for Deep learning for computer vision with PythonHere, you would also find more information about courses in Python, Deep LearningMachine Learning, and Neural Networks which will come with proper certification at the end.

We are there in the Social Media where you can follow us both in Facebook and Instagram.


Interested in a career in Data Analyst?

To learn more about Data Analyst with Advanced excel course – Enrol Now.
To learn more about Data Analyst with R Course – Enrol Now.
To learn more about Big Data Course – Enrol Now.

To learn more about Machine Learning Using Python and Spark – Enrol Now.
To learn more about Data Analyst with SAS Course – Enrol Now.
To learn more about Data Analyst with Apache Spark Course – Enrol Now.
To learn more about Data Analyst with Market Risk Analytics and Modelling Course – Enrol Now.

Know the Trending Machine Learning Toolkits: For More Intelligent Mobile Apps

Know the Trending Machine Learning Toolkits: For More Intelligent Mobile Apps

With the progressive age, innovative and effective technologies like Artificial Intelligence and Machine Learning is dominating the scene of the present. Therefore, developers are rooting for machine learning models to be up to date with the present era. You can also avail of Neural Network Machine learning Python to keep pace with the modern advancements.

To say it, even mobile applications have come a long way from what they were earlier. With the cutting edge technologies of face recognition, speech recognition, recognition of different gestures and movements, mobile apps are really smart now. Furthermore, with the popularity of AI and machine learning, the mobile industry is looking forward to introducing them into the mobiles.

So, here you can catch a glimpse of the top 5 machine learning toolkits for a mobile developer to be aware of.

Apache PredictionIO

Apache PredictionIO is an effective machine learning server. It is open source in nature and acts as a source stack for the developers and data scientists. Through this tool, a developer can easily build and deploy an engine as a web service on production. It can then be easily utilised by the users, where they can run their own machine learning models seamlessly.

Caffe

The Convolutional Architecture for Fast Feature Embedding or Caffe, is an open-source framework developed by the AI Research of Berkeley. Caffe is growing up to be both powerful and popular as a computer vision framework that the developers can use to run machine vision tasks, image classification and more.

CoreML

CoreML is a machine learning framework from the house of Apple Inc. Through this app, you can implement machine learning models on your iOS. CoreML supports the vision to analyse images, natural language for processing natural language, speech for converting audio to text and even sound analysis for the identification of sounds in audio.

Eclipse Deeplearning4j

Eclipse Deeplearning4j is a formidable deep-learning library and is, in fact, the first commercial-grade, open-source one for Java and Scala. You can also integrate Eclipse with Hadoop and Apache Spark if you want to bring AI into the business environment.

Besides, it also acts as a DIY tool where, the programmers of Java, Scala and Clojure can configure the deep neural networks without any hassles. 

Data Science Machine Learning Certification

Google ML Kit

This is a machine learning software development kit for mobile app developers. Through this app, you can develop countless interactive features that you can run on Android and iOS. Here you will also get some readily available APIs for face recognition, to scan barcodes, labelling images and landmarks. With this app, you just need to feed in the data and see the app at its optimum performance.

These are some peerless Machine Learning toolkits to be incorporated into the mobiles. You can also avail of the Machine Learning course in Delhi if you are interested. 


.

A Beginner’s Guide to Learning Data Science Fundamentals

A Beginner’s Guide to Learning Data Science Fundamentals

I’m a data scientist by profession with an actuarial background.

I graduated with a degree in Criminology; it was during university that I fell in love with the power of statistics. A typical problem would involve estimating the likelihood of a house getting burgled on a street, if there has already been a burglary on that street. For the layman, this is part of predictive policing techniques used to tackle crime. More technically, “It involves a Non-Markovian counting process called the “Hawkes Process” which models for “self-exciting” events (like crimes, future stock price movements, or even popularity of political leaders, etc.)

Being able to predict the likelihood of future events (like crimes in this case) was the main thing which drew me to Statistics. On a philosophical level, it’s really a quest for “truth of things” unfettered by the inherent cognitive biases humans are born with (there are 25 I know of).

2

Arguably, Actuaries are the original Data Scientists, turning data in actionable insights since the 18th Century when Alexander Webster with Robert Wallace built a predictive model to calculate the average life expectancy of soldiers going to war using death records. And so, “Insurance” was born to provide cover to the widows and children of the deceased soldiers.

Of course, Alan Turing’s contribution cannot be ignored, which eventually afforded us with the computational power needed to carry out statistical testing on entire populations – thereby Machine Learning was born. To be fair, the history of Data Science is an entire blog of its own. More on that will come later.

The aim of this series of blogs is to initiate anyone daunted by the task of acquiring the very basics of Statistics and Mathematics used in Machine Learning. There are tonnes of online resources which will only list out the topics but will rarely explain why you need to learn them and to what extent. This series will attempt to address this problem adopting a “first principle” approach. Its best to refer back to this article a second time after gaining the very basics of each Topic discussed below:

We will be discussing:

  • Central Limit Theorem
  • Bayes Theorem
  • Probability Theory
  • Point Estimation – MLE’s
  • Confidence Intervals
  • P-values and Significance Test.

This list is by no means exhaustive of the statistical and mathematical concepts you will need in your career as a data scientist. Nevertheless, it provides a solid grounding going into more advanced topics.

Without further due, here goes:

Central Limit Theorem

Central Limit Theorem (CLT) is perhaps one of the most important results in all of Statistics. Essentially, it allows making large sample inference about the Population Mean (μ), as well as making large sample inference about population proportion (p).

So what does this really means?

Consider (X1, X2, X3……..Xn) samples, where n is a large number say, 100. Each sample will have its own respective sample Mean (x̅). This will give us “n” number of sample means. Central Limit Theorem now states:

                                                                                                &

Try to visualise the distribution “of the average of lots of averages”… Essentially, if we have a large number of averages that have been taken from a corresponding large number of samples; then Central Limit theorem allows us to find the distribution of those averages. The beauty of it is that we don’t have to know the parent distribution of the averages. They all tend to Normal… eventually!

Similarly if we were to add up independent and identically distributed (iid) samples, then their corresponding distribution will also tend to a Normal.

Very often in your work as a data scientist a lot of the unknown distributions will tend to Normal, now you can visualise how and more importantly why!

Stay tuned to DexLab Analytics for more articles discussing the topics listed above in depth. To deep dive into data science, I strongly recommend this Big Data Hadoop institute in Delhi NCR. DexLab offers big data courses developed by industry experts, helping you master in-demand skills and carve a successful career as a data scientist.

About the Author: Nish Lau Bakshi is a professional data scientist with an actuarial background and a passion to use the power of statistics to tackle various pressing, daily life problems.


Interested in a career in Data Analyst?

To learn more about Data Analyst with Advanced excel course – Enrol Now.
To learn more about Data Analyst with R Course – Enrol Now.
To learn more about Big Data Course – Enrol Now.

To learn more about Machine Learning Using Python and Spark – Enrol Now.
To learn more about Data Analyst with SAS Course – Enrol Now.
To learn more about Data Analyst with Apache Spark Course – Enrol Now.
To learn more about Data Analyst with Market Risk Analytics and Modelling Course – Enrol Now.

More than Statistics, Machine Learning Needs Semantics: Explained

More than Statistics, Machine Learning Needs Semantics: Explained

Of late, machines have achieved somewhat human-like intelligence and accuracy. The deep learning revolution has ushered us into a new era of machine learning tools and systems that perfectly identifies the patterns and predicts future outcomes better than human domain experts. Yet, there exists a critical distinction between man and machines. The difference lies in the way we reason – we, humans like to reason through advanced semantic abstractions, while machines blindly depend on statistics.

The learning process of human beings is intense and in-depth. We prefer to connect the patterns we identify to high order semantic abstractions and our adequate knowledge base helps us evaluate the reason behind such patterns and determine the ones that are most likely to represent our actionable insights.

2

On the other hand, machines blindly look for powerful signals in a pool of data. Lacking any background knowledge or real-life experiences, deep learning algorithms fail to distinguish between relevant and specious indicators. In fact, they purely encode the challenges according to statistics, instead of applying semantics.

This is why diverse data training is high on significance. It makes sure the machines witness an array of counterexamples so that the specious patterns get automatically cancelled out. Also, segmenting images into objects and practicing recognition at the object level is the order of the day. But of course, current deep learning systems are too easy to fool and exceedingly brittle, despite being powerful and highly efficient. They are always on a lookout for correlations in data instead of finding meaning.

Are you interested in deep learning? Delhi is home to a good number of decent deep learning training institutes. Just find a suitable and start learning!

How to Fix?

The best way is to design powerful machine learning systems that can tersely describe the patterns they examine so that a human domain expert can later review them and cast their approval for each pattern. This kind of approach would enhance the efficiency of pattern recognition of the machines. The substantial knowledge of humans coupled with the power of machines is a game changer.

Conversely, one of the key reasons that made machine learning so fetching as compared to human intelligence is its quaint ability to identify a range of weird patterns that would look spurious to human beings but which are actually genuine signals worth considering. This holds true especially in theory-driven domains, such as population-scale human behavior where observational data is very less or mostly unavailable. In situations like this, having humans analyze the patterns put together by machines would be of no use.

End Notes

As closing thoughts, we would like to share that machine learning initiated a renaissance in which deep learning technologies have tapped into unconventional tasks like computer vision and leveraged superhuman precision in an increasing number of fields. And surely we are happy about this.

However, on a wider scale, we have to accept the brittleness of the technology in question. The main problem of today’s machine learning algorithms is that they merely learn the statistical patterns within data without putting brains into them. Once, deep learning solutions start stressing on semantics rather than statistics and incorporate external background knowledge to boost decision making – we can finally chop off the failures of the present generation AI.

Artificial Intelligence is the new kid on the block. Get enrolled in an artificial intelligence course in Delhi and kickstart a career of dreams! For help, reach us at DexLab Analytics.


The blog has been sourced from www.forbes.com/sites/kalevleetaru/2019/01/15/why-machine-learning-needs-semantics-not-just-statistics/#789ffe277b5c


Interested in a career in Data Analyst?

To learn more about Data Analyst with Advanced excel course – Enrol Now.
To learn more about Data Analyst with R Course – Enrol Now.
To learn more about Big Data Course – Enrol Now.

To learn more about Machine Learning Using Python and Spark – Enrol Now.
To learn more about Data Analyst with SAS Course – Enrol Now.
To learn more about Data Analyst with Apache Spark Course – Enrol Now.
To learn more about Data Analyst with Market Risk Analytics and Modelling Course – Enrol Now.

5 Great Takeaways from Machine Learning Conference 2019

5 Great Takeaways from Machine Learning Conference 2019

Machine Learning Developer Summit, one of the leading Machine Learning conferences of India, happening on the 30th and 31st of January 2019 in Bangalore, aims to assemble machine leaning and data science experts and enthusiasts from all over India. Organized by Analytics India Magazine, this high-level meeting will be the hotspot for conversing about the latest developments in machine learning. Attendees can gather immense knowledge from ML experts and innovators from top tech enterprises, and network with individuals belonging to data sciences. Actually, there are tons of rewards for those attending MLDS 2019. Below are some of the best takeaways:

  1. Creation of Useful Data Lake on AWS

In a talk by reputable Raghuraman Balachandran, Solutions Architect for Amazon Web Services, participants will learn how to design clean, dependable data lakes on AWS cloud. He shall also share his experienced outlook on tackling some common challenges of designing an effective data lake. Mr Balachandran will explain the process to store raw data – unstructured, semi-structured or completely structured – and processed data for different analytical uses.

Data lakes are the most used architectures in data-based companies. This talk will allow attendees to develop a thorough understanding of the concept, which is sure to boost their skill set for getting hired.

2

  1. Improve Inference Phase for Deep Learning Models

Deep learning models require considerable system resources, including high-end CPUs and GPUs for best possible training. Even after exclusive access to such resources, there may be several challenges in the target deployment phase that were absent in the training environment.

Sunil Kumar Vuppala, Principal Scientist at Philips Research, will discuss methods to boost the performance of DL models during their inference phase. Further, he shall talk about using Intel’s inference engine to improve quality of DL models run in Tensorflow/Caffe/Keras via CPUs.

  1. Being more employable amid the explosive growth in AI and its demand

The demand for AI skills will skyrocket in future – so is the prediction of many analysts considering the extremely disruptive nature of AI. However, growth in AI skills isn’t occurring at the expected rate. Amitabh Mishra, who is the CTO at Emcure Pharmaceuticals, addresses the gap in demand and development of AI skills, and shall share his expert thoughts on the topic. Furthermore, he will expand on the requirements in AI field and provide preparation tips for AI professionals.

  1. Walmart AI mission and how to implement AI in low-infrastructure situations

In the talk by Senior Director of Walmart Lab, Prakhar Mehrotra, audiences get a view of Walmart’s progress in India. Walmart Lab is a subsidiary of the global chain Walmart, which focuses on improving customer experience and designing tech that can be used with Merchants to enhance the company’s range. Mr Mehrotra will give details about Wallmart’s AI journey, focusing on the advancements made so far.

  1. ML’s important role in data cleansing

A good ML model comes from a clean data lake. Generally, a significant amount of time and resources invested in building a robust ML model goes on data cleansing activities. Somu Vadali, Chief of Future Group’s CnD Labs Data and Products section, will talk about how ML can be used to clean data more efficiently. He will speak at length about well-structured processes that allow organizations to shift from raw data to features in a speedy and reliable manner. Businesses may find his talk helpful to reduce their time-to-market for new models and increase efficiency of model development.

Machine learning is the biggest trend of IT and data science industry. In fact, day by day it is gaining more prominence in the tech industry, and is likely to become a necessary skill to get bigger in all fields of employment. So, maneuver your career towards excellence by enrolling for machine learning courses in India. Machine learning course in Gurgaon by DexLab Analytics is tailor-made for your specific needs. Both beginners and professionals find these courses apt for their growth.


Interested in a career in Data Analyst?

To learn more about Data Analyst with Advanced excel course – Enrol Now.
To learn more about Data Analyst with R Course – Enrol Now.
To learn more about Big Data Course – Enrol Now.

To learn more about Machine Learning Using Python and Spark – Enrol Now.
To learn more about Data Analyst with SAS Course – Enrol Now.
To learn more about Data Analyst with Apache Spark Course – Enrol Now.
To learn more about Data Analyst with Market Risk Analytics and Modelling Course – Enrol Now.

Being a Statistician Matters More, Here’s Why

Being a Statistician Matters More, Here’s Why

Right data for the right analytics is the crux of the matter. Every data analyst looks for the right data set to bring value to his analytics journey. The best way to understand which data to pick is fact-finding and that is possible through data visualization, basic statistics and other techniques related to statistics and machine learning – and this is exactly where the role of statisticians comes into play. The skill and expertise of statisticians are of higher importance.

2

Below, we have mentioned the 3R’s that boosts the performance of statisticians:

Recognize – Data classification is performed using inferential statistics, descriptive and diverse other sampling techniques.

Ratify – It’s very important to approve your thought process and steer clear from acting on assumptions. To be a fine statistician, you should always indulge in consultations with business stakeholders and draw insights from them. Incorrect data decisions take its toll.

Reinforce – Remember, whenever you assess your data, there will be plenty of things to learn; at each level, you might discover a new approach to an existing problem. The key is to reinforce: consider learning something new and reinforcing it back to the data processing lifecycle sometime later. This kind of approach ensures transparency, fluency and builds a sustainable end-result.

Now, we will talk about the best statistical techniques that need to be applied for better data acknowledgment. This is to say the key to becoming a data analyst is through excelling the nuances of statistics and that is only possible when you possess the skills and expertise – and for that, we are here with some quick measures:

Distribution provides a quick classification view of values within a respective data set and helps us determine an outlier.

Central tendency is used to identify the correlation of each observation against a proposed central value. Mean, Median and Mode are top 3 means of finding that central value.

Dispersion is mostly measured through standard deviation because it offers the best scaled-down view of all the deviations, thus highly recommended.

Understanding and evaluating the data spread is the only way to determine the correlation and draw a conclusion out of the data. You would find different aspects to it when distributed into three equal sections, namely Quartile 1, Quartile 2 and Quartile 3, respectively. The difference between Q1 and Q3 is termed as the interquartile range.

While drawing a conclusion, we would like to say the nature of data holds crucial significance. It decides the course of your outcome. That’s why we suggest you gather and play with your data as long as you like for its going to influence the entire process of decision-making.

On that note, we hope the article has helped you understand the thumb-rule of becoming a good statistician and how you can improve your way of data selection. After all, data selection is the first stepping stone behind designing all machine learning models and solutions.

Saying that, if you are interested in learning machine learning course in Gurgaon, please check out DexLab Analytics. It is a premier data analyst training institute in the heart of Delhi offering state-of-the-art courses.


The blog has been sourced from www.analyticsindiamag.com/are-you-a-better-statistician-than-a-data-analyst


Interested in a career in Data Analyst?

To learn more about Data Analyst with Advanced excel course – Enrol Now.
To learn more about Data Analyst with R Course – Enrol Now.
To learn more about Big Data Course – Enrol Now.

To learn more about Machine Learning Using Python and Spark – Enrol Now.
To learn more about Data Analyst with SAS Course – Enrol Now.
To learn more about Data Analyst with Apache Spark Course – Enrol Now.
To learn more about Data Analyst with Market Risk Analytics and Modelling Course – Enrol Now.

AI in Cyber Security: Knowing the Difference between Machine Learning and Deep Learning

AI in Cyber Security: Knowing the Difference between Machine Learning and Deep Learning

The need of the hour in business world is continuous innovation in the field of cyber security. Security vendors constantly brainstorm ideas and methods that’ll keep them ahead of cybercriminals. The gravity of the problem can be understood from a report by Sophos which mentions that almost 50% of Australian businesses were affected by ransomware attacks in 2017.

To keep functioning amidst such threats, businesses require innovative technologies, and artificial intelligence is one such tool that has become vital for cyber security.

2

Artificial Intelligence

AI is a trendy term now, thanks to blockbuster Bollywood movies made on AI!

AI is an all-embracing principle that includes a number of technologies─ machine learning and deep learning being important ones among them. Basically, artificial intelligence enables machines to learn on their own from experience, modify techniques when fed with new data sets and carry out tasks that are human-like. When the principles of AI are applied to cyber security, we call it predictive security. AI helps to identify and check if files contain malware, which is carried out with the help of machine learning as well as deep learning. Although these two branches use similar AI principles, the two fields are fundamentally very different.

Moving on, let’s explore their basic differences.

Machine Learning

Machine learning is an artificial system that learns from examples and generates knowledge from past experiences. ML technology doesn’t simply memorize examples; rather it picks up laws and patterns and applies it later where relevant.

Considering today’s advanced threat landscape, conventional approaches fail to offer strong protection to a system. Malware programs are sometimes designed to make slight changes and breach traditional systems. In such situations, machine learning can be a better security option as it can detect these unknown and modified malwares too.

An important advantage of machine learning is that it keeps evolving and improving as it is used more and fed with more data. Machine learning algorithms scrutinize file elements in order to comprehend the nature of attacks, which includes simple things like file size as well as complex things like part of codes.

Deep Learning

The benefits of employing machine learning techniques in cyber security are numerous. However, it has some drawbacks too, which can be overcome with deep learning. The main limitations of ML are its inability to handle many variables at once, requirement of huge computing powers and using up a lot of space. In deep learning, unstructured data is stored in neural networks and decisions are made using predictive reasoning, which is modeled on the workings of human brain. This structure has potential to manage numerous points of information without hampering speed of the system.

Deep learning can form better idea of the big picture because it doesn’t include programs designed to solve a particular problem, rather it includes mathematical models that learn over time. A model is developed such that it can explain well what it ‘’sees’’. For this, large amount of data is used, such as trends, malicious URLs and other modes of attacks.

Cyber attackers need to be correct in their methods only once in order to breach an enterprise. On top of that, security threats are becoming more innovative each day. Hence, technologies like deep learning and machine learning need to be the founding stones of modern security systems. Understandably, these skills are also very high in demand. Artificial Intelligence certification courses are hugely popular. If this subject interests you, then don’t delay in enrolling for deep learning courses in Delhi or machine learning courses in Gurgaon from leading institute DexLab Analytics.

 
Reference: www.cso.com.au/article/648861/artificial-intelligence-vs-machine-learning-vs-deep-learning-what-difference
 

Interested in a career in Data Analyst?

To learn more about Data Analyst with Advanced excel course – Enrol Now.
To learn more about Data Analyst with R Course – Enrol Now.
To learn more about Big Data Course – Enrol Now.

To learn more about Machine Learning Using Python and Spark – Enrol Now.
To learn more about Data Analyst with SAS Course – Enrol Now.
To learn more about Data Analyst with Apache Spark Course – Enrol Now.
To learn more about Data Analyst with Market Risk Analytics and Modelling Course – Enrol Now.

Call us to know more