Machine Learning Archives - DexLab Analytics | Big Data Hadoop SAS R Analytics Predictive Modeling & Excel VBA

Introduction to MongoDB

MongoDB is a document based database program which was developed by MongoDB Inc. and is licensed under server side public license (SSPL). It can be used across platforms and is a non-relational database also known as NoSQL, where NoSQL means that the data is not stored in the conventional tabular format and is used for unstructured data as compared to SQL and that is the major difference between NoSQL and SQL.
MongoDB stores document in JSON or BSON format. JSON also known as JavaScript Object notation is a format where data is stored in a key value pair or array format which is readable for a normal human being whereas BSON is nothing but the JSON file encoded in the binary format which is quite hard for a human being to understand.
Structure of MongoDB which uses a query language MQL(Mongodb query language):-
Databases:- Databases is a group of collections.
Collections:- Collection is a group fields.
Fields:- Fields are nothing but key value pairs
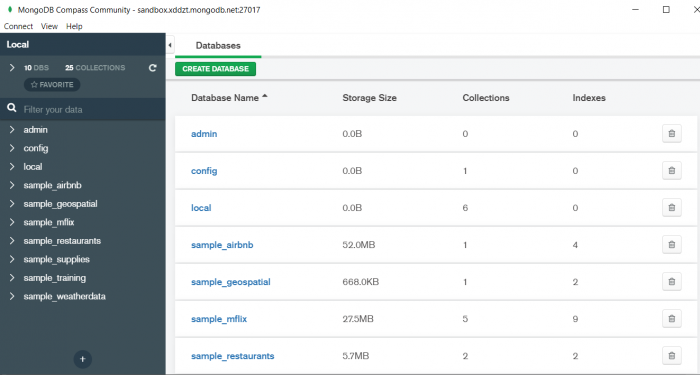
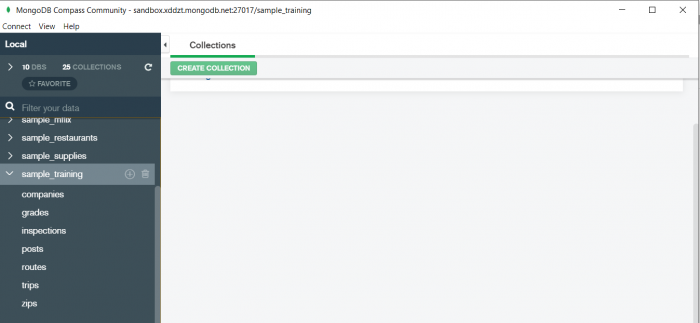
Just for an example look at the image given below:-

Here I am using MongoDB Compass a tool to connect to Atlas which is a cloud based platform which can help us write our queries and start performing all sort of data extraction and deployment techniques. You can download MongoDB Compass via the given link https://www.mongodb.com/try/download/compass

In the above image in the red box we have our databases and if we click on the “sample_training” database we will see a list of collections similar to the tables in sql.

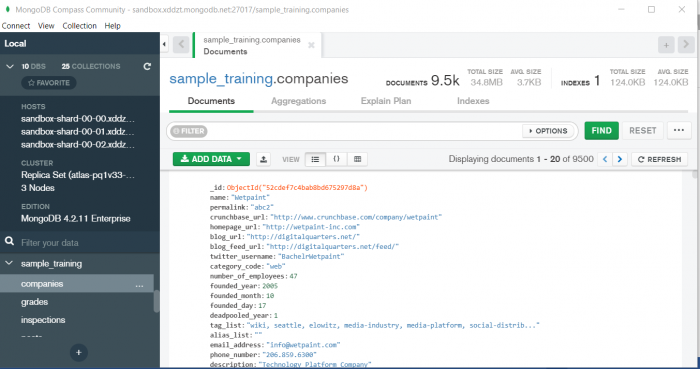
Now lets write our first query and see what data in “companies” collection looks like but before that select the “companies” collection.

Now in our filter cell we can write the following query:-

In the above query “name” and “category_code” are the key values also known as fields and “Wetpaint” and “web” are the pair values on the basis of which we want to filter the data.
What is cluster and how to create it on Atlas?
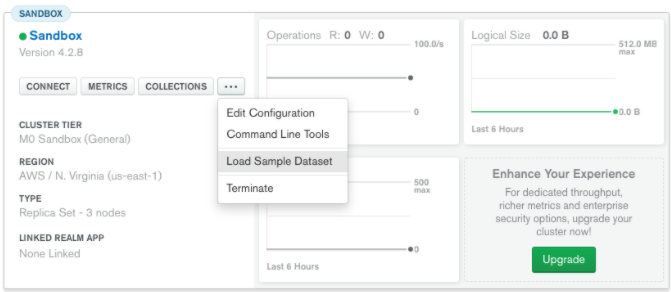
MongoDB cluster also know as sharded cluster is created where each collection is divided into shards (small portions of the original data) which is a replica set of the original collection. In case you want to use Atlas there is an unpaid version available with approximately 512 mb space which is free to use. There is a pre-existing cluster in MongoDB named Sandbox , which currently I am using and you can use it too by following the given steps:-
1. Create a free account or sign in using your Google account on
https://www.mongodb.com/cloud/atlas/lp/try2-in?utm_source=google&utm_campaign=gs_apac_india_search_brand_atlas_desktop&utm_term=mongodb%20atlas&utm_medium=cpc_paid_search&utm_ad=e&utm_ad_campaign_id=6501677905&gclid=CjwKCAiAr6-ABhAfEiwADO4sfaMDS6YRyBKaciG97RoCgBimOEq9jU2E5N4Jc4ErkuJXYcVpPd47-xoCkL8QAvD_BwE
2. Click on “Create an Organization”.
3. Write the organization name “MDBU”.
4. Click on “Create Organization”.
5. Click on “New Project”.
6. Name your project M001 and click “Next”.
7. Click on “Build a Cluster”.
8. Click on “Create a Cluster” an option under which free is written.
9. Click on the region closest to you and at the bottom change the name of the cluster to “Sandbox”.
10. Now click on connect and click on “Allow access from anywhere”.
11. Create a Database User and then click on “Create Database User”.
username: m001-student
password: m001-mongodb-basics
12. Click on “Close” and now load your sample as given below :

Loading may take a while….
13. Click on collections once the sample is loaded and now you can start using the filter option in a similar way as in MongoDB Compass
In my next blog I’ll be sharing with you how to connect Atlas with MongoDB Compass and we will also learn few ways in which we can write query using MQL.

So, with that we come to the end of the discussion on the MongoDB. Hopefully it helped you understand the topic, for more information you can also watch the video tutorial attached down this blog. The blog is designed and prepared by Niharika Rai, Analytics Consultant, DexLab Analytics DexLab Analytics offers machine learning courses in Gurgaon. To keep on learning more, follow DexLab Analytics blog.


.

ARIMA (Auto-Regressive Integrated Moving Average)

arima-time series-dexlab analytics

This is another blog added to the series of time series forecasting. In this particular blog  I will be discussing about the basic concepts of ARIMA model.

So what is ARIMA?

ARIMA also known as Autoregressive Integrated Moving Average is a time series forecasting model that helps us predict the future values on the basis of the past values. This model predicts the future values on the basis of the data’s own lags and its lagged errors.

When a  data does not reflect any seasonal changes and plus it does not have a pattern of random white noise or residual then  an ARIMA model can be used for forecasting.

There are three parameters attributed to an ARIMA model p, q and d :-

p :- corresponds to the autoregressive part

q:- corresponds to the moving average part.

d:- corresponds to number of differencing required to make the data stationary.

In our previous blog we have already discussed in detail what is p and q but what we haven’t discussed is what is d and what is the meaning of differencing (a term missing in ARMA model).

Since AR is a linear regression model and works best when the independent variables are not correlated, differencing can be used to make the model stationary which is subtracting the previous value from the current value so that the prediction of any further values can be stabilized .  In case the model is already stationary the value of d=0. Therefore “differencing is the minimum number of deductions required to make the model stationary”. The order of d depends on exactly when your model becomes stationary i.e. in case  the autocorrelation is positive over 10 lags then we can do further differencing otherwise in case autocorrelation is very negative at the first lag then we have an over-differenced series.

The formula for the ARIMA model would be:-

To check if ARIMA model is suited for our dataset i.e. to check the stationary of the data we will apply Dickey Fuller test and depending on the results we will  using differencing.

In my next blog I will be discussing about how to perform time series forecasting using ARIMA model manually and what is Dickey Fuller test and how to apply that, so just keep on following us for more.

So, with that we come to the end of the discussion on the ARIMA Model. Hopefully it helped you understand the topic, for more information you can also watch the video tutorial attached down this blog. The blog is designed and prepared by Niharika Rai, Analytics Consultant, DexLab Analytics DexLab Analytics offers machine learning courses in Gurgaon. To keep on learning more, follow DexLab Analytics blog.


.
ARMA- Time Series Analysis Part 4

ARMA Time series DexLab Analytics

ARMA(p,q) model in time series forecasting is a combination of Autoregressive  Process also known as AR Process and Moving Average (MA) Process where p corresponds to the autoregressive part and q corresponds to the moving average part.


Autoregressive Process (AR) :- When the value of Yt in a time series data is regressed over its own past value then it is called an autoregressive process where p is the order of lag into consideration.

Where,

Yt = observation which we need to find out.

α1= parameter of an autoregressive model

Yt-1= observation in the previous period

ut= error term

The equation above follows the first order of autoregressive process or AR(1) and the value of p is 1. Hence the value of Yt in the period ‘t’ depends upon its previous year value and a random term.

Moving Average (MA) Process :- When the value of Yt  of order q in a time series data depends on the weighted sum of current and the q recent errors i.e. a linear combination of error terms then it is called a moving average process which can be written as :-

yt = observation which we need to find out

α= constant term

βut-q= error over the period q .

ARMA (Autoregressive Moving Average) Process :-

The above equation shows that value of Y in time period ‘t’ can be derived by taking into consideration the order of lag p which in the above case is 1 i.e. previous year’s observation and the weighted average of the error term over a period of time q which in case of the above equation is 1.

How to decide the value of p and q?

Two of the most important methods to obtain the best possible values of p and q are ACF and PACF plots.

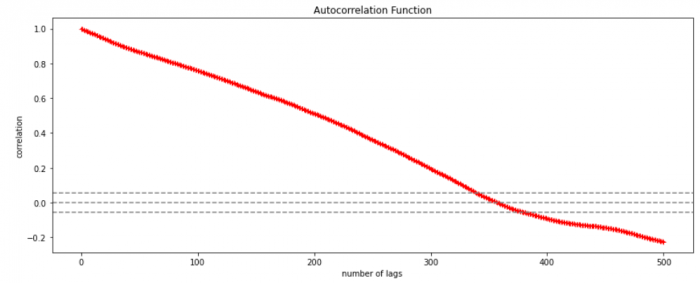
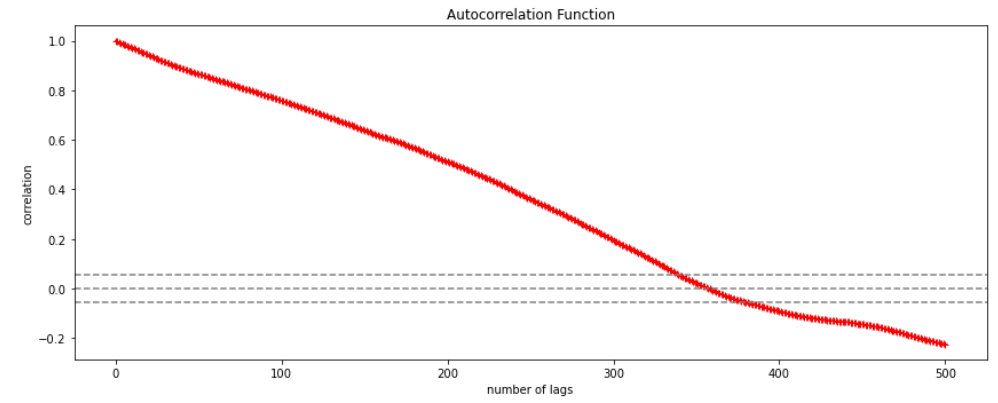
ACF (Auto-correlation function) :- This function calculates the auto-correlation of the complete data on the basis of lagged values which when plotted helps us choose the value of q that is to be considered to find the value of Yt. In simple words how many years residual can help us predict the value of Yt can obtained with the help of ACF, if the value of correlation is above a certain point then that amount of lagged values can be used to predict Yt.

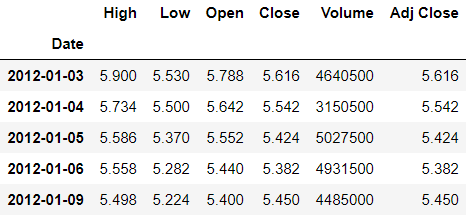
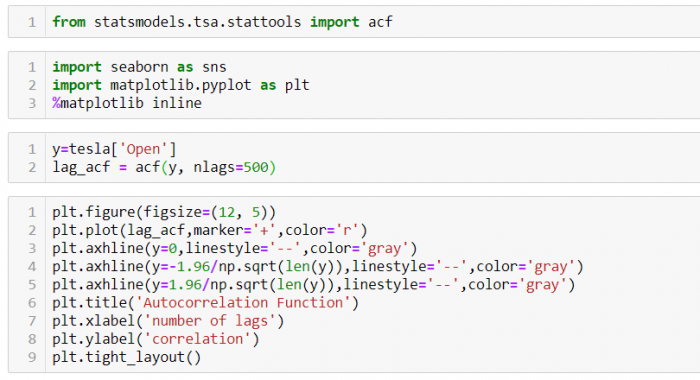
Using the stock price of tesla between the years 2012 and 2017 we can use the .acf() method in python to obtain the value of p.

.DataReader() method is used to extract the data from web.

The above graph shows that beyond the lag 350 the correlation moved towards 0 and then negative.

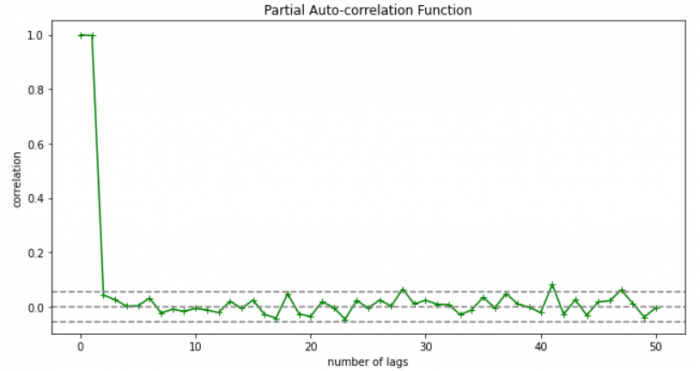
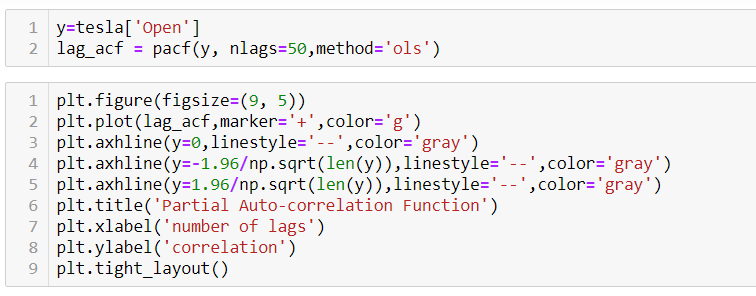
PACF (Partial auto-correlation function) :- Pacf helps find the direct effect of the past lag by removing the residual effect of the lags in between. Pacf helps in obtaining the value of AR where as acf helps in obtaining the value of MA i.e. q. Both the methods together can be use find the optimum value of p and q in a time series data set.

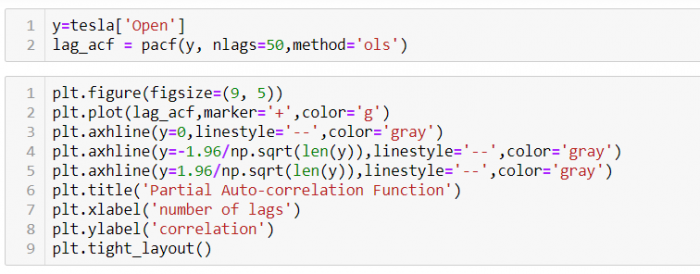
Lets check out how to apply pacf in python.

As you can see in the above graph after the second lag the line moved within the confidence band therefore the value of p will be 2.


So, with that we come to the end of the discussion on the ARMA Model. Hopefully it helped you understand the topic, for more information you can also watch the video tutorial attached down this blog. The blog is designed and prepared by Niharika Rai, Analytics Consultant, DexLab Analytics DexLab Analytics offers machine learning courses in Gurgaon. To keep on learning more, follow DexLab Analytics blog.


.
Autocorrelation- Time Series – Part 3

Autocorrelation is a special case of correlation. It refers to the relationship between successive values of the same variables .For example if an individual with a consumption pattern:-

spends too much in period 1 then he will try to compensate that in period 2 by spending less than usual. This would mean that Ut is correlated with Ut+1 . If it is plotted the graph will appear as follows :

Positive Autocorrelation : When the previous year’s error effects the current year’s error in such a way that when a graph is plotted the line moves in the upward direction or when the error of the time t-1 carries over into a positive error in the following period it is called a positive autocorrelation.
Negative Autocorrelation : When the previous year’s error effects the current year’s error in such a way that when a graph is plotted the line moves in the downward direction or when the error of the time t-1 carries over into a negative error in the following period it is called a negative autocorrelation.

Now there are two ways of detecting the presence of autocorrelation
By plotting a scatter plot of the estimated residual (ei) against one another i.e. present value of residuals are plotted against its own past value.

If most of the points fall in the 1st and the 3rd quadrants , autocorrelation will be positive since the products are positive.

If most of the points fall in the 2nd and 4th quadrant , the autocorrelation will be negative, because the products are negative.
By plotting ei against time : The successive values of ei are plotted against time would indicate the possible presence of autocorrelation .If e’s in successive time show a regular time pattern, then there is autocorrelation in the function. The autocorrelation is said to be negative if successive values of ei changes sign frequently.
First Order of Autocorrelation (AR-1)
When t-1 time period’s error affects the error of time period t (current time period), then it is called first order of autocorrelation.
AR-1 coefficient p takes values between +1 and -1
The size of this coefficient p determines the strength of autocorrelation.
A positive value of p indicates a positive autocorrelation.
A negative value of p indicates a negative autocorrelation
In case if p = 0, then this indicates there is no autocorrelation.
To explain the error term in any particular period t, we use the following formula:-

Where Vt= a random term which fulfills all the usual assumptions of OLS
How to find the value of p?

One can estimate the value of ρ by applying the following formula :-

Time Series Analysis Part I


A time series is a sequence of numerical data in which each item is associated with a particular instant in time. Many sets of data appear as time series: a monthly sequence of the quantity of goods shipped from a factory, a weekly series of the number of road accidents, daily rainfall amounts, hourly observations made on the yield of a chemical process, and so on. Examples of time series abound in such fields as economics, business, engineering, the natural sciences (especially geophysics and meteorology), and the social sciences.

  • Univariate time series analysis- When we have a single sequence of data observed over time then it is called univariate time series analysis.
  • Multivariate time series analysis – When we have several sets of data for the same sequence of time periods to observe then it is called multivariate time series analysis.

The data used in time series analysis is a random variable (Yt) where t is denoted as time and such a collection of random variables ordered in time is called random or stochastic process.

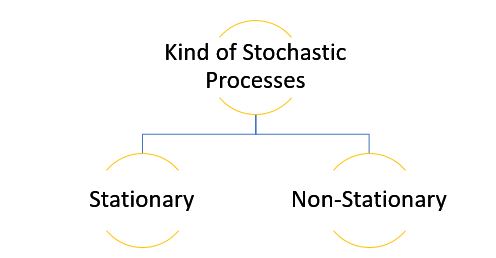
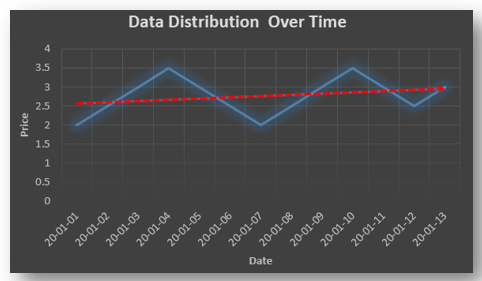
Stationary: A time series is said to be stationary when all the moments of its probability distribution i.e. mean, variance , covariance etc. are invariant over time. It becomes quite easy forecast data in this kind of situation as the hidden patterns are recognizable which make predictions easy.

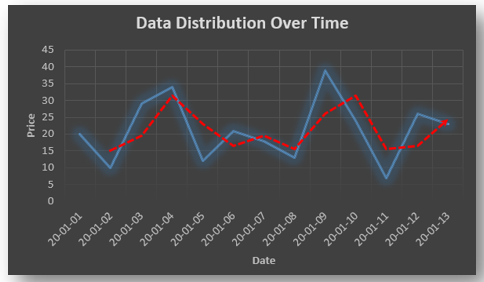
Non-stationary: A non-stationary time series will have a time varying mean or time varying variance or both, which makes it impossible to generalize the time series over other time periods.

Non stationary processes can further be explained with the help of a term called Random walk models. This term or theory usually is used in stock market which assumes that stock prices are independent of each other over time. Now there are two types of random walks:
Random walk with drift : When the observation that is to be predicted at a time ‘t’ is equal to last period’s value plus a constant or a drift (α) and the residual term (ε). It can be written as
Yt= α + Yt-1 + εt
The equation shows that Yt drifts upwards or downwards depending upon α being positive or negative and the mean and the variance also increases over time.
Random walk without drift: The random walk without a drift model observes that the values to be predicted at time ‘t’ is equal to last past period’s value plus a random shock.
Yt= Yt-1 + εt
Consider that the effect in one unit shock then the process started at some time 0 with a value of Y0
When t=1
Y1= Y0 + ε1
When t=2
Y2= Y1+ ε2= Y0 + ε1+ ε2
In general,
Yt= Y0+∑ εt
In this case as t increases the variance increases indefinitely whereas the mean value of Y is equal to its initial or starting value. Therefore the random walk model without drift is a non-stationary process.

So, with that we come to the end of the discussion on the Time Series. Hopefully it helped you understand time Series, for more information you can also watch the video tutorial attached down this blog. DexLab Analytics offers machine learning courses in delhi. To keep on learning more, follow DexLab Analytics blog.


.
An Introductory Guide to NumPy

An Introductory Guide to NumPy

NumPy also known as numerical python, is a library consisting of multidimensional array objects and a collection of routines for processing those arrays. Using NumPy, mathematical and logical operations on arrays can be performed without it which was not possible. For example-

Multiplication of two lists will cause an error as a data structure like lists, tuple, dictionaries and sets do not allow mathematical operations.

Therefore we need NumPy to covert our data structures like lists into 1d, 2d, 3d or nd arrays so that mathematical operations can be performed. U

We can use .array() methods to create these arrays.

Now let’s check out few examples and also perform few mathematical operations to have a better understanding.

  • In the above code we first import NumPy library and then use .array() method to two 1d-array a1 and b1 using the list we previously created.

  • Now let’s multiply a1 and b1 array.

  • Now let’s use .array() method to directly create an array.


Arrays can be created using lists, tuples and dictionaries as you can see in the above example.

Now for 2-d arrays recall that we can also make list of lists. Let’s use that to create 2d-arrays.


2d-arrays can also be created using tuples.


Remember that we are not using these as matrices because matrix multiplication is an entirely different thing we are just trying to perform mathematical operations which were otherwise not possible.

Random Module

Numpy also has various ways with which we can create array of random numbers which then can be used in number of ways like generating a data for practice purposes or for building beautiful graphs for a presentation.

Given below is a list of type of random numbers you can generate

.rand() :- This particular method helps you generate uniformly distributed random numbers i.e. numbers between 0 and 1 where each number between 0 and 1 will have equal probability to be in the sample dataset.

The above code generates a 2d-array with values between 0 and 1.

.randn():- This method generates normally distributed random numbers i.e. numbers between -3 and +3 where mean=median=mode and ploted gives a bell shaped curve.

Here the 20 random numbers are generated ranging between -3 and + 3.

Note:- Remember that the data is randomly picked from the normally distributed values between -3 and +3 so the graph is not bell shaped but the original data from which the values are being picked randomly is bell shaped with mean=median-mode.

.randint():-This method generates random integers between a given range.


So, with that we come to the end of the discussion on the Numpy. Hopefully it helped you understand Numpy, for more information you can also watch the video tutorial attached down this blog. DexLab Analytics offers machine learning courses in delhi. To keep on learning more, follow DexLab Analytics blog.


.
What is the Intuition Behind Machine Learning?

What is the Intuition Behind Machine Learning?

Machine learning has become a popular term as this advanced technology is full of immense potential. Before explaining the intuition behind machine learning let’s understand the meaning of the term first which is becoming so popular in this era of scientific innovation and is a trend that everybody wants to follow.

What is Machine Learning?

Machine learning if explained in a very layman language is a program running behind an application which has an ability to learn from what is sees and the errors that it makes and then tries to improve itself through trial and error. A programming language like Python and a method of calculation (statistics) is what helps propel this application in the right direction.

Now that you know what machine learning is, let’s discuss about what is the intuition behind building a machine learning algorithm or a program.

In my previous blog I have discussed about a statistical concept called Linear Regression which follows given a X independent variable, prediction of a Y dependent variable is possible if we understand the rate at which X and Y are changing and the direction towards which they are moving i.e. we understand the hidden pattern they are following, we will  be able to predict the value of Y when X= 15.

In the process of all that, we need to reduce the error between the predicted Y and the observed Y which we had to train our model but this is not possible with only calculating the slope i.e. b1 a single time and this is where machine learning comes in handy.

The idea behind machine learning is to learn from the past mistakes and try to find the best possible coefficients i.e. b0 and b1 so that we are able to reduce the distance between predicted and observed y which leads to the minimization of error in predictions which we are making. This intuition remains the same throughout all the machine learning algorithms only the problem in question and the methodology to solve the problem changes.

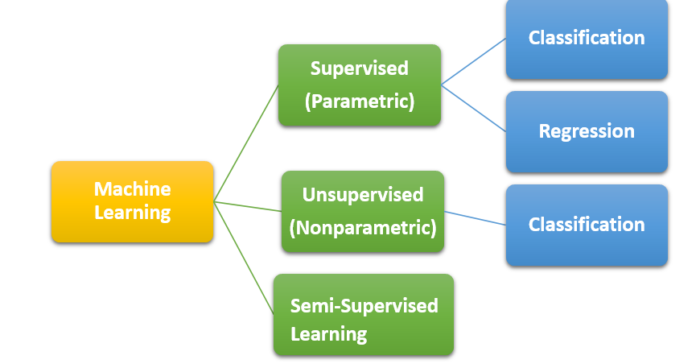
Now let’s quickly look at the branches of Machine Learning.

Branches of Machine Learning


  • Supervised (Parametric) Machine Learning Algorithm:- Under this branch both the independent variable X and the dependent variable Y is given in the form of Y = f(X) and this branch can further be divided based on the kind of problem we are dealing with i.e. whether the variable Y is continuous or a category.
  • Unsupervised (Non-parametric) Machine Learning Algorithm:- Under this branch you do not have the Y variable i.e. Y ≠ f(X) and you can only solve classification problems.
  • Semi-Supervised Machine Learning Algorithms:- This is the most difficult to solve as under this kind of problem the data which is available for the analysis has missing values of Y which makes it quite difficult to train the algorithm as the possibility of false prediction is very high.

So, with that this discussion here on machine learning wraps up,  hopefully, it helped you understand the intuition behind machine learning, also check out the video tutorial attached down the blog to learn more. The field of machine learning is full of opportunities, DexLab Analytics offers machine learning course in delhi ncr, keep on following the blog to enhance your knowledge as we continue to update it with interesting and informative posts for you.


.

Why Pursuing a Certification Course in Machine Learning Makes Sense Than Doing Self-Study?

Why Pursuing a Certification Course in Machine Learning Makes Sense Than Doing Self-Study

If you are aware of the growth opportunities awaiting you in the Machine Learning domain, you must be in a rush to master the Machine Learning skills. Now, there are courses available that aim to sharpen the students with skills they would need to work in a challenging environment. However, some often prefer the self-study mode for developing knowledge in this highly specialized domain. No matter which way you prefer to learn, ultimately your passion and dedication would matter the most, because in both ways you need to put in the hard work and really toil hard to make any progress.

Is self-study a feasible option?

If you have already been through some course and want to go to the advanced level through self-study that’s a different issue, but, for those who are just starting out without any background in science, does it even make any sense to opt for self-study?

Given the way Machine Learning technology is moving fast and creating a demand for professionals with highly specialized industry knowledge, do you think self-study would be enough? Do you think a self-study plan to learn something you have no idea about would work? How much time would you need to devote? What should be your learning route? And how do you know this is the right path to follow?

Before we dive deeper into the discussion, we need to go through some prerequisites for Machine Learning study plan.

Machine learning is a broad field and assuming you are a beginner with no prior knowledge in this domain, you have to be familiar with mathematics, statistics, programming  languages, meaning undergoing a Python certification training</strong>, must be proficient in data handling including analysis and modeling, you have to work on algorithms. So, can you pick up all of these skills one by one via self-study? Add to the list the latest Machine Learning tools and applications you need to grasp.

There will be help available in the form of:

  • There would be vast resources, in forms of e-books, lectures, video tutorials, most of these are free and easily accessible.
  • There are forums, groups out there which you can join and access help
  • You can take part in online competitions

Think it through. How long will it take for you to get from one stage to the next?

 Even though there being no dearth of resources available you would be struggling with your progress and most importantly you would struggle to keep up with the pace the technology is moving ahead. Picking up a programming language, grasping and mastering concepts of linear algebra, probability, data is going to be a mammoth task.

Data Science Machine Learning Certification

What difference a certification course can make?

  • To begin with these courses are designed for people coming from different backgrounds, so, you having or, not having any prior knowledge in mathematics, statistics wouldn’t matter as you would be taught everything from scratch be it math or, Machine Learning Using Python.
  • The programs are designed for both working professionals as well as for beginners, all you need to do is choose the one that suits your specific level.
  • These courses are designed to transform you into an industry-ready professional and you would be under the guidance of professionals who are more than familiar with the nuances of the way the industry functions.
  • The modules would follow a strict schedule and your training path would be well planned out covering all the areas you need to master.
  • You would learn via hands-on training and get to handle projects. Nothing makes you skilled like hands-on training.

Your journey towards a smarter future needs to be through a well mapped-out path, so, be smart about it. DexLab Analytics offers industry-ready courses on Data Science, Machine Learning course in Gurgaon and AI with Python. Take advantage of the courses that are taught by instructors who have both expertise and experience. Time is indeed money, so, stop wasting time and get down to learning.


.

Probability PART-II: A Guide To Probability Theorems

Probability PART-II: A Guide To Probability Theorems

This is the second part of the probability series, in the first segment we discussed the basic concepts of probability. In this second part we will delve deeper into the topic and discuss the theorems of probability. Let’s find out what these theorems are.

Addition Theorem

    • If A and B are two events and they are not necessarily mutually exclusive then the probability of occurrence of at least one of the two events A and B i.e. P(AUB) is given by


Removing the intersections will give the probability of A or B  or both.


Example:- From a deck of cards 1 card is drawn, what is the probability the card is king or heart or both?

Total cards 52

P(KingUHeart)= P(King)+P(Heart) ─ P(King∩Heart)

  • If A and B are two mutually exclusive events then the probability that either A or B will occur is the sum of individual probabilities of the events A and B.


P(A)+P(B), here the combined probability of the two will either give P(A) or P(B)


  • If A and B are two non mutually exclusive events then the probability of occurrence of event A is given by


Where B’ is 1-P(B), that means probability of  A is calculated as P(A)=1-P(B)


Multiplication Law

The law of multiplication is used to find the joint probability or the intersection i.e. the probability of two events occurring together at the same point of time.

In the above graph we see that when the bill is paid at the same time tip is also paid and the interaction of the two can be seen in the graph.

Joint probability table

A joint probability table displays the intersection (joint) probabilities along with the marginal probabilities of a given problem where the marginal probability is computed by dividing some subtotal by the whole.

Example:- Given the following joint probability table find out the probability that the employee is female or a professional worker.

Watch this video down below that further explains the theorems.

At the end of this blog, you must have grasped the basics of the theorems discussed here. Keep on tracking the Dexlab Analytics blog where you will find more discussions on topics related to Data Science training.


.

Call us to know more