Learn R Programming Archives - DexLab Analytics | Big Data Hadoop SAS R Analytics Predictive Modeling & Excel VBA

Time Series Analysis & Modelling with Python (Part II) – Data Smoothing

dexlab_time_series

Data Smoothing is done to better understand the hidden patterns in the data. In the non- stationary processes, it is very hard to forecast the data as the variance over a period of time changes, therefore data smoothing techniques are used to smooth out the irregular roughness to see a clearer signal.

In this segment we will be discussing two of the most important data smoothing techniques :-

  • Moving average smoothing
  • Exponential smoothing

Moving average smoothing

Moving average is a technique where subsets of original data are created and then average of each subset is taken to smooth out the data and find the value in between each subset which better helps to see the trend over a period of time.

Lets take an example to better understand the problem.

Suppose that we have a data of price observed over a period of time and it is a non-stationary data so that the tend is hard to recognize.

QTR (quarter)Price
110
211
318
414
515
6?


In the above data we don’t know the value of the 6th quarter.

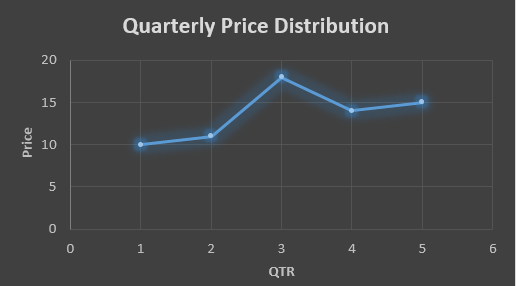
….fig (1)

The plot above shows that there is no trend the data is following so to better understand the pattern we calculate the moving average over three quarter at a time so that we get in between values as well as we get the missing value of the 6th quarter.

To find the missing value of 6th quarter we will use previous three quarter’s data i.e.

MAS =  = 15.7

QTR (quarter)Price
110
211
318
414
515
615.7

MAS =  = 13

MAS =  = 14.33

QTR (quarter)PriceMAS (Price)
11010
21111
31818
41413
51514.33
615.715.7


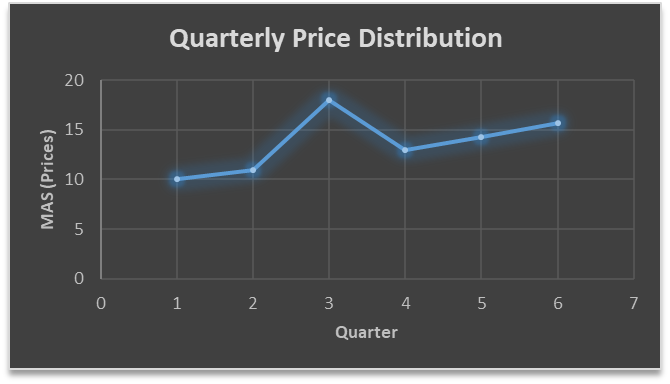
….. fig (2)

In the above graph we can see that after 3rd quarter there is an upward sloping trend in the data.

Exponential Data Smoothing

In this method a larger weight ( ) which lies between 0 & 1 is given to the most recent observations and as the observation grows more distant the weight decreases exponentially.

The weights are decided on the basis how the data is, in case the data has low movement then we will choose the value of  closer to 0 and in case the data has a lot more randomness then in that case we would like to choose the value of  closer to 1.

EMA= Ft= Ft-1 + (At-1 – Ft-1)

Now lets see a practical example.

For this example we will be taking  = 0.5

Taking the same data……

QTR (quarter)Price

(At)

EMS Price(Ft)
11010
211?
318?
414?
515?
6??


To find the value of yellow cell we need to find out the value of all the blue cells and since we do not have the initial value of F1 we will use the value of A1. Now lets do the calculation:-

F2=10+0.5(10 – 10) = 10

F3=10+0.5(11 – 10) = 10.5

F4=10.5+0.5(18 – 10.5) = 14.25

F5=14.25+0.5(14 – 14.25) = 14.13

F6=14.13+0.5(15 – 14.13)= 14.56

QTR (quarter)Price

(At)

EMS Price(Ft)
11010
21110
31810.5
41414.25
51514.13
614.5614.56

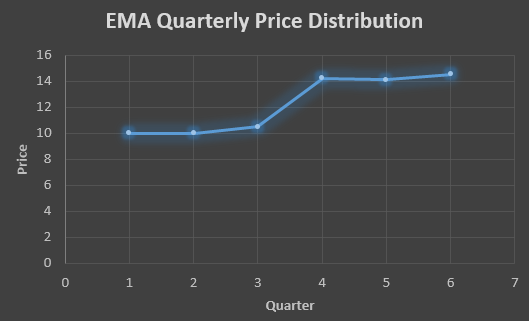
In the above graph we see that there is a trend now where the data is moving in the upward direction.

So, with that we come to the end of the discussion on the Data smoothing method. Hopefully it helped you understand the topic, for more information you can also watch the video tutorial attached down this blog. The blog is designed and prepared by Niharika Rai, Analytics Consultant, DexLab Analytics DexLab Analytics offers machine learning courses in Gurgaon. To keep on learning more, follow DexLab Analytics blog.


.
R is Gaining Huge Prominence in Data Analytics: Explained Why

Why should you learn R?

Just because it is largely popular..

Is this reason enough for you?

Budding data analytics professionals look forward to learn R because they think by grasping R skills, they would be able to nab the core principles of data science: data visualization, machine learning and data manipulation.

Be careful, while selecting a language to learn. The language should be capacious enough to trigger all the above-mentioned areas and more. Being a data scientist, you would need tools to carry out all these tasks, along with having the resources to learn them in the desired language.

In short, fix your attention on process and technique and just not on the syntax – after all, you need to find out ways to discover insight in data, and for that you need to excel over these 3 core skills in data science and FYI – in R, it is easier to master these skills as compared to any other language.

Data Manipulation

As rightly put, more than 80% of work in data science is related to data manipulation. Data wrangling is very common; a regular data scientist spends a significant portion of his time working on data – he arranges data and puts them into a proper shape to boost future operational activities. 

In R, you will find some of the best data management tools – dplyr package in R makes data manipulation easier. Just ‘chain’ the standard dplyr together and see how drastically data manipulation turns out to be simple.

For R programming certification in Delhi, drop by DexLab Analytics.

2

Data Visualization

One of the best data visualization tools, ggplot2 helps you get a better grip on syntax, while easing out the way you think about data visualization. Statistical visualizations are rooted in deep structure – they consist of a highly structured framework on which several data visualizations are created. Ggplot2 is also based on this system – learn ggplot2 and discover data visualization in a new way.

However, the moment you combine dplyr and ggplot2 together, through the chaining technology, deciphering new insights about your data becomes a piece of cake.

Machine Learning

For many, machine learning is the most important skill to develop but if you ask me, it takes time to ace it. Professionals, who are in this line of work takes years to fully understand the real workings of machine learning and implement it in the best way possible.

Stronger tools are needed time and often, especially when normal data exploration stops producing good results. R boasts of some of the most innovative tools and resources.

R is gaining popularity. It is becoming the lingua franca for data science, though there are several other high-end language programs, R is the one that is used most widely and extremely reliable. A large number of companies are putting their best bets on R – Digital natives like Google and Facebook both houses a large number of data scientists proficient in R. Revolution Analytics once stated, “R is also the tool of choice for data scientists at Microsoft, who apply machine learning to data from Bing, Azure, Office, and the Sales, Marketing and Finance departments.” Besides the tech giants, a wide array of medium-scale companies like Uber, Ford, HSBC and Trulia have also started recognizing the growing importance of R.

Now, if you want to learn more programming languages, you are good to go. To be clear, there is no single programming language that would solve all your data related problems, hence it’s better to set your hands in other languages to solve respective problems.

Consider Machine Learning Using Python; next to R, Python is the encompassing multi-purpose programming language all the data scientists should learn. Loaded with incredible visualization tools, machine learning techniques, Python is the second most useful language to learn. Grab a Python certification Gurgaon today from DexLab Analytics. It will surely help your career move!


Interested in a career in Data Analyst?

To learn more about Data Analyst with Advanced excel course – Enrol Now.
To learn more about Data Analyst with R Course – Enrol Now.
To learn more about Big Data Course – Enrol Now.

To learn more about Machine Learning Using Python and Spark – Enrol Now.
To learn more about Data Analyst with SAS Course – Enrol Now.
To learn more about Data Analyst with Apache Spark Course – Enrol Now.
To learn more about Data Analyst with Market Risk Analytics and Modelling Course – Enrol Now.

How R Programming is Transforming Business for Good

Today, every business is putting efforts to understand their customers and themselves, better. But, how? What methods are they applying? Do mere Excel pivot tables help analyze vast pool of data? The answer to the latter question is in the negative – Excel pivot tables are not that great at analyzing data – so a wide number of companies look forward to SAS and R Programming to cull Business Intelligence.

 
How R Programming is Transforming Business for Good
 

Besides SAS, R-Programming is another open-source language that is used by most of the budding data scientists in the world of analytics. The R Programming language is more oriented towards the correct implication of data science, while ensuring business the cutting edge data analysis tools. Continue reading “How R Programming is Transforming Business for Good”

Tracing Success in the New Age of Data Science

Each year, pronouncements are made. And each year, a particular job field rides high above the tides of fortune.
For 2017, Data Scientist jobs seem to be #1 Best Job in India. Several magazines and research associates have put Data Scientist jobs at #1 position. No wonder, data science jobs are the hottest jobs in today’s market, hopefully in future too.
So, how do you become a good data scientist? Affordable Data Science Training Course in Gurgaon is now available in India that too quite easily. DexLab Analytics is one such institute that offers state-of-the-art data science training facilities for young aspiring candidates.

Get hold of SAS skills

If you are aware of the top data science skills, you must have known that statistical analysis and data mining calls for SAS specialization. SAS plays an important role in all these disciplines. It has been the pioneer and the most reliable software suit, and for a long time enjoying the monopoly position.

However, since the advent of R and Python, the powerful open source competitors, it is true that the growth curve of SAS has been little but hampered. Nevertheless SAS skills still boast of astounding demand all over the world.

SAS training courses help you understand the nuances of data science. Nowadays, these training’s are not too difficult to find, myriad institutes offer online and classroom training for its students on a regular basis. It is no more too difficult to get a grip on the fundamentals of this subject matter.

The number speaks of positivity

It would be like mine 11th commandment – there is a shortage of data science jobs. It is being predicted that there could be a shortage of 200,000 data scientists by 2020, and this is for real. Indian market is an emerging economy, though data science may not be so famous here as it is in the US, yet I am proud to say that the importance of this field is on the rise.

The survey says – the global demand for data scientists grew by more than 50% in between 2014 and 2015, while the searches have increased by 73%.

The skills you require to possess

By analyzing a whole lot of LinkedIn job postings, we have come to a conclusion that there are 5 high-in demand skills that you need to master in order to ace in data analytics – SQL, Hadoop, Python, Java, and R. Apart from these five, you also need to be quite proficient in Data Visualization and statistics, and try to bring out your creative side to the front.

How much difficult is it to choose a data analytics course?

Make sure, you know what you want, very clearly. Prepare yourself well, before getting into any course. Experience matters, but before that you need encompassing training on the subject matter that can only be offered by a pioneering institute of data science. However, before investing money and your time, check properly if the curriculum satisfies your needs. The material needs to be crisp, to the point and in line with the current industry standards.

DexLab Analytics is a top-of-the-line data science training institute in Gurgaon, offering high-in demand courses on analytics. For any assistance, reach us.

Interested in a career in Data Analyst?

To learn more about Machine Learning Using Python and Spark – click here.
To learn more about Data Analyst with Advanced excel course – click here.
To learn more about Data Analyst with SAS Course – click here.
To learn more about Data Analyst with R Course – click here.
To learn more about Big Data Course – click here.

Using R Programming to Simulate the Incredible Pong Arcade Game

Unleashed in the market in 1972, Pong is one of the first computer games ever developed. Loosely inspired by tennis, Pong captured the worldwide gaming market soon after its launch. Instantaneously, it became a trending fad. Gaming enthusiasts became intrigued, they desired to delve deeper into the computer coding and system mechanisms mostly to understand the essence of arcade game development.

 
Using R Programming to Simulate the Incredible Pong Arcade Game
 

Today, R-Programming is extensively used to develop numerous board games. But the question to ponder on is – can we create traditional arcade games with R programming?

Continue reading “Using R Programming to Simulate the Incredible Pong Arcade Game”

How-Stat: This IPL Season Embrace Big Data Analysis and Predict It Right

How-Stat: This IPL Season Embrace Big Data Analysis and Predict It Right
 

Quick coffee breaks, some time-off from work and engrossing IPL discussions – a perfect office scene described during an IPL season.


IPL is here! Indian Premier League 2017 has started!

 
17523255_10154506349578634_7586989396467000613_n
 

Cricket is not a sport, but a religion. In India. If there is a match going on, every trivial thing takes a back seat. After all, everything other thing can wait, but not cricket!

Continue reading “How-Stat: This IPL Season Embrace Big Data Analysis and Predict It Right”

Call us to know more