General Interview Questions Archives - Page 2 of 2 - DexLab Analytics | Big Data Hadoop SAS R Analytics Predictive Modeling & Excel VBA

Best Machine Learning Questions to Crack the Toughest Job Interview

Best Machine Learning Questions to Crack the Toughest Job Interview

The robust growth of artificial intelligence has ignited a buzz of activities along the scientific community. Why not? AI has no many dimensions – including Machine Learning. Machine Learning is a dynamic field of IT– where, one gets access to data and learn from that data, resulting into massive breakthroughs in the field of marketing, fraud detection, healthcare, data security, etc.

Day by day, companies are recognizing the potentials of Machine Learning. This is why investment in this notable field is spiking up as much as the demand for skilled professionals. Machine Learning jobs are found topping the list of emerging jobs displayed on LinkedIn – the median salary of a ML professional is $106,225, which pretty much suffices for a well-paying career option.

Importantly, we’ve picked out 5 best interview questions about Machine Learning that’ll optimize your chances of getting hired. Known to all, though ML skill is in high demand, grabbing a job in this booming field of technology is no mean feat. Employers seek particular knowledge and expertise in this field to get you hired. Our 5 best interview questions will help you expand your knowledge base on ML and hone your skills ahead of time.

You can also check out our Machine Learning training course – it comprises of industry-standard course material, real life use cases and encompassing curriculum.

What is Machine Learning?

While you define the exact meaning of the term, make sure you convey your good grip over the nuanced concepts of machine learning, and its real life applications. Put simply, you must show the interviewers how well versed you are in AI and machine learning skills.

What is the difference between deductive and inductive Machine Learning?

Deductive ML begins with a conclusion, and then proceeds towards making deductions about that conclusion. Inductive ML starts from examples and ends with drawing conclusions.

How to choose an algorithm for a particular classification problem?

The answer here is subject to the degree of accuracy and the size of the training set. For a tiny training set, low variance/high bias classifier will work, and vice versa.

Name some methods of reducing dimensionality

Integrate features with feature engineering, eliminating collinear features, or use algorithmic dimensionality reduction – these procedures can definitely reduce dimensionality.

What makes classification and regression differ?

For definite answers, classification is far better a tool. It predicts class or group membership. On the other hand, regression entails prediction of a response.

What does a Kernel SVM mean?

Kernel SVM is the short form of Kernel Support Vector Machine. Kernel methods are basically a specific class of algorithms used for patter analysis and amongst them the most popular one is the Kernel SVM.

Data Science Machine Learning Certification

What do you mean by a recommendation system?

Recommendation system is a common feature for those who have worked on Spotify or shopped at Amazon. It’s an information filtering system that forecasts what a user wants to hear or see, structured on the choice patterns given by the user.

No second thoughts, these interview questions will set you on the right track to crack an interview – but, if you want to gain a deeper understanding on Machine Learning or AI, obtain Machine Learning training Gurgaon from the experts at DexLab Analytics.

 
The blog has been sourced from —

https://www.simplilearn.com/machine-learning-interview-questions-and-answers-article


.

Maps in Tableau: Key to Answer Data Questions

Maps in Tableau: Key to Answer Data Questions

For creating brilliant data visualization, first you need to know which visual chart type would be ideal for the data story you want to tell. In this post, we will explore maps in Tableau, when and where they seem to be appropriate for particular data visualization, and how to make them more productive. If you want to use a map, make sure you know the reason why.

Maps help you attain, authenticate, or communicate spatial patterns with data. With these maps, you should start your presentation with a spatial question. This spatial question ensures that your map will perfectly find you an answer in the best way possible.


For example, answer this question using a data map:

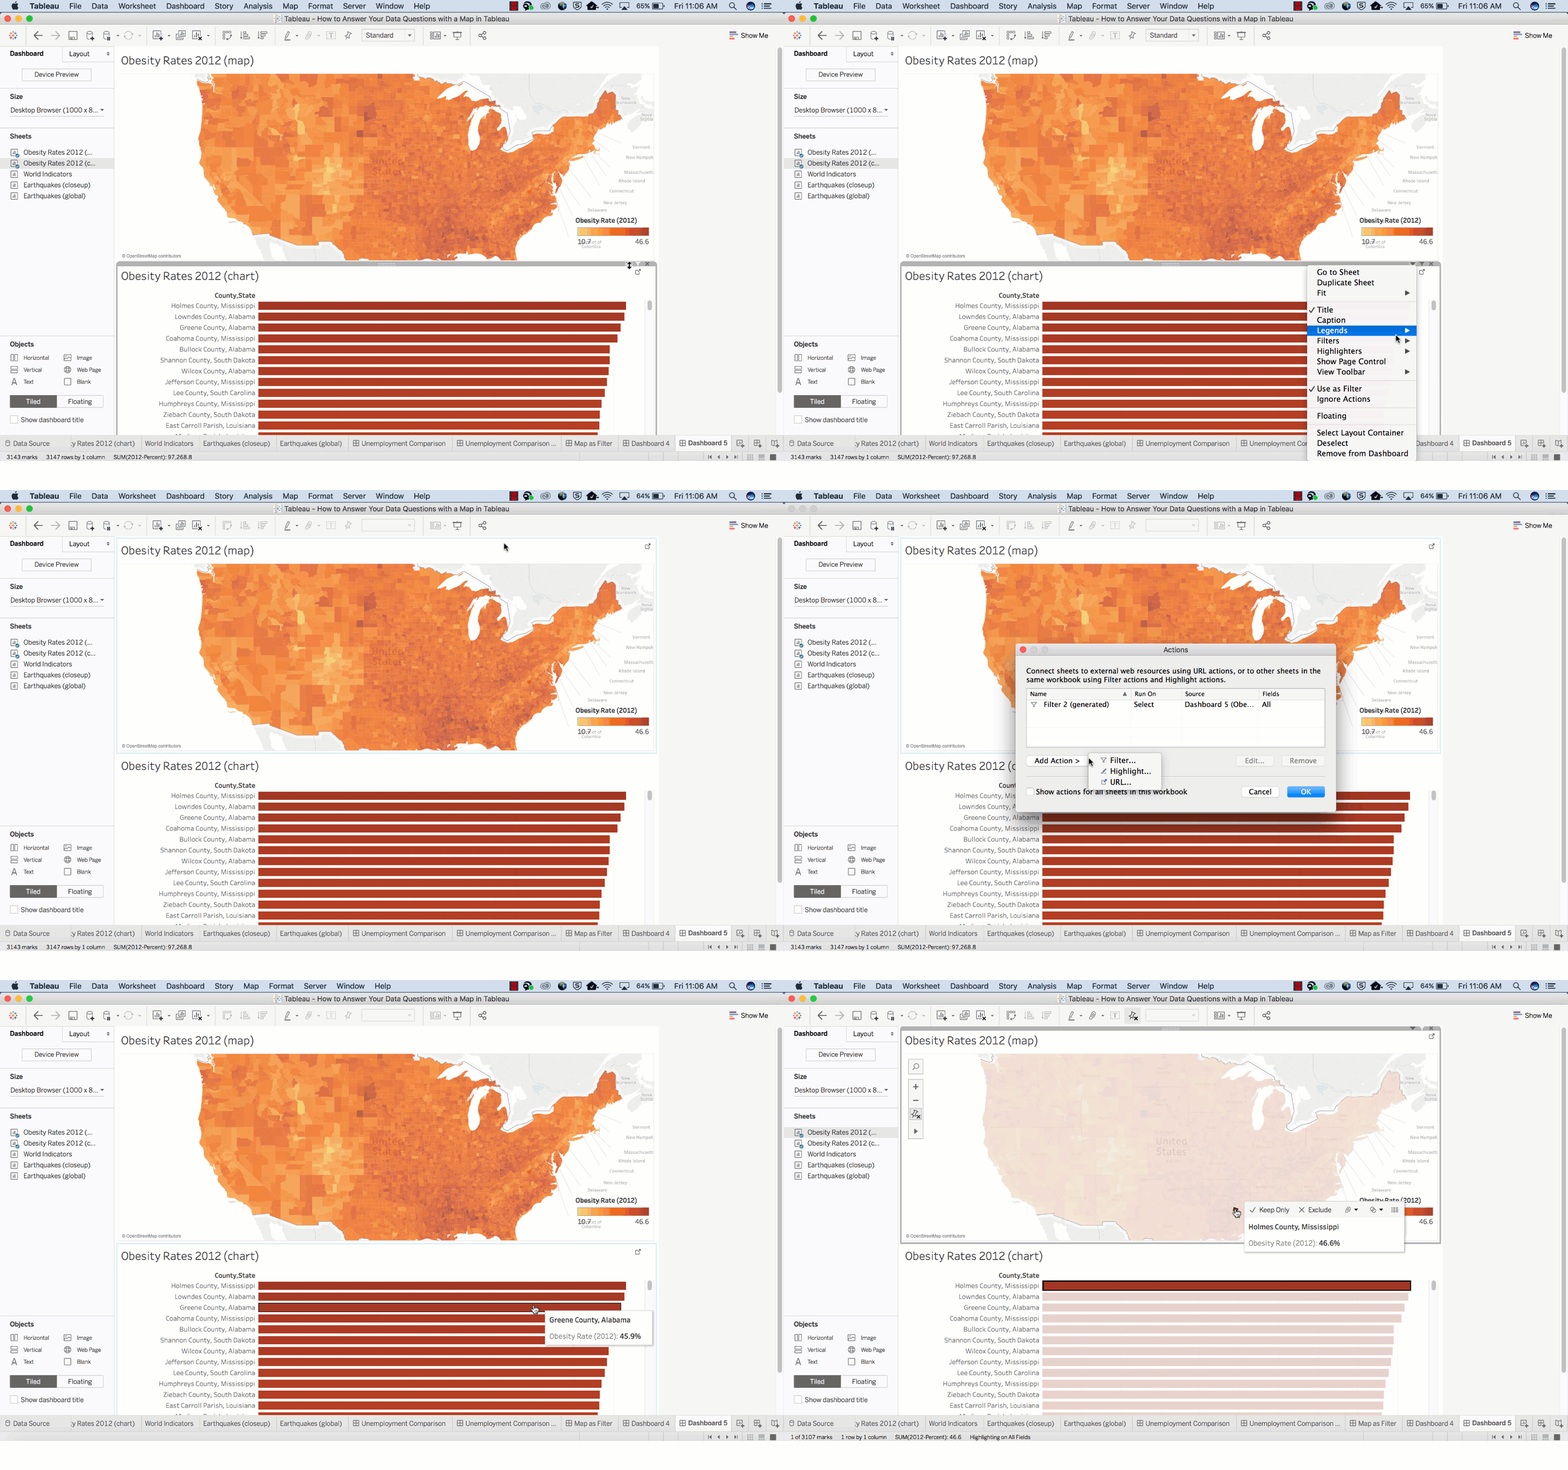
Which country in the US suffers from the highest obesity rate?

1_rss

How much time did it take to answer that question? Did you quickly find the actual location without fuddling too much over the darker-colored country? I guess not. However, this map might not be the best path to answer this spatial question.

Now, let’s use the bar chart below to answer the same question.


It is easier to discover the answer here.

By combining the map and bar chart together, the answer to your spatial question can easily be derived.


Basically, maps are great for answering these two types of spatial questions:

  • What is the value for a specific location or mark on the map?
  • How do patterns compare between locations, regions, or attributes?


Go through the following tips to answer these questions better.

How to determine the value for a specific location or a mark on map?

Tooltips are the perfect way to move your mouse over a mark and observe a list of all the underlying dimensions and measures present.

You can easily edit a tooltip to include both dynamic and static text.

For example, identify which of these tooltips reveals a story about earthquakes in Japan.

screen_shot_2017-06-16_at_7.47.20_am

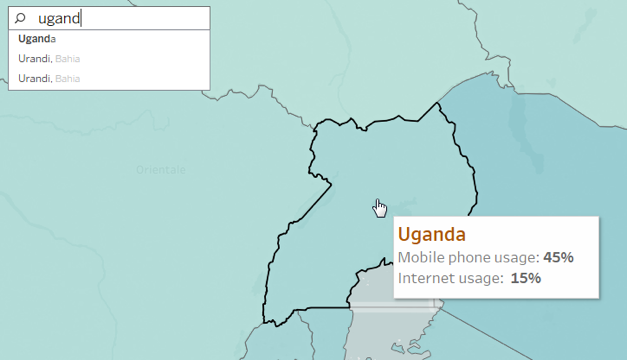
Also, the Tooltip improves speed-to-insight because the viewers of the map can easily find individual locations they want to find.

For example, find out the internet usage percentage in Uganda.

uganda

How do patterns compare between regions, locations or attributes?

To give answer to this question with a map, you must allow a direct comparison to be established between the data, symbols and even colors.

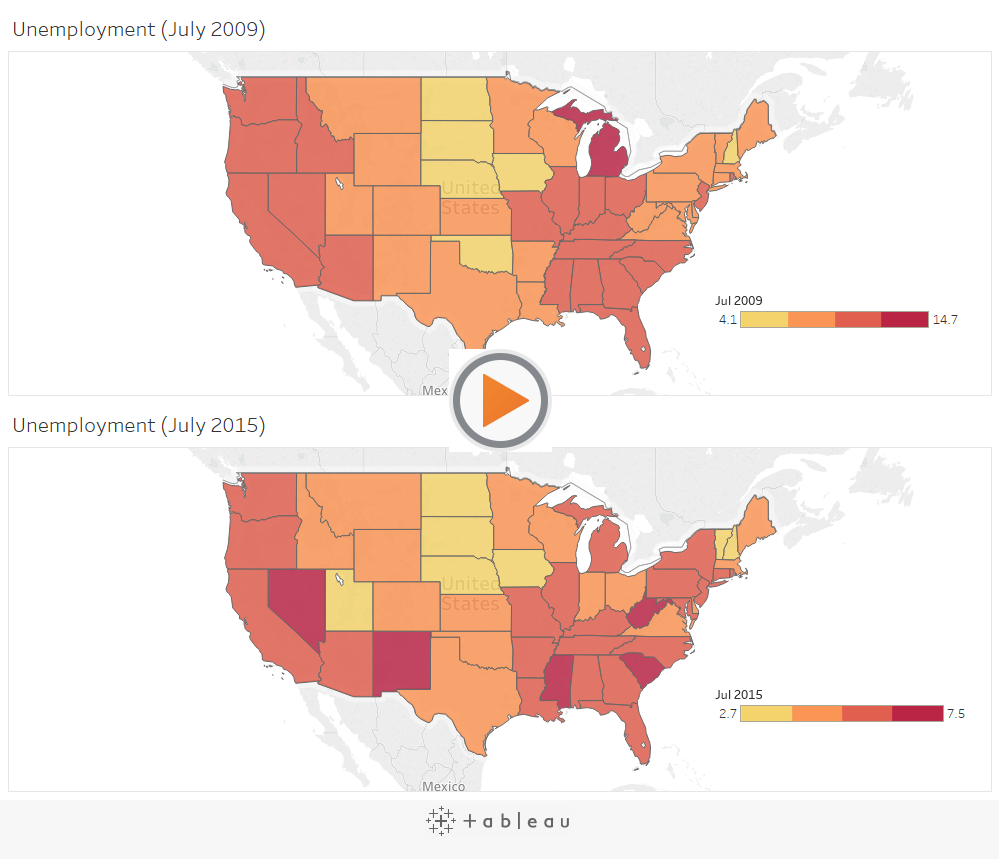
For example, while establishing a comparison between these two sets of unemployment data, the default color encoding doesn’t add any value for making direct comparisons. The reason being: the dark red doesn’t stand for the same value in both maps.

In turn, this situation can be very confusing for users who have no idea about the details of the data.

1_rss

The best way to deal with the problem is by getting an assurance that the color ramps in both maps use the same range.

Also, you can make your date easier for comparison by adjusting the color scheme, so that different color groups exude similar semantic meaning. Semantically-resonant colors help in processing information faster.

screen_shot_2017-06-16_at_7.52.23_am

In case, you want to learn more about Tableau, check out our blogs published on DexLab Analytics. We offer state-of-the-art Tableau training courses in Delhi, for any assistance reach out to us.


Interested in a career in Data Analyst?

To learn more about Data Analyst with Advanced excel course – Enrol Now.
To learn more about Data Analyst with R Course – Enrol Now.
To learn more about Big Data Course – Enrol Now.

To learn more about Machine Learning Using Python and Spark – Enrol Now.
To learn more about Data Analyst with SAS Course – Enrol Now.
To learn more about Data Analyst with Apache Spark Course – Enrol Now.
To learn more about Data Analyst with Market Risk Analytics and Modelling Course – Enrol Now.

Speaking with Tanmoy Ganguli, the expert Data Analyst Bringing Cutting Edge Technology to DexLab Analytics

Speaking with Tanmoy Ganguli, the expert Data Analyst Bringing Cutting Edge Technology to DexLab Analytics


DexLab Analytics is proud to announce that Tanmoy Ganguli, a proficient Data Analyst who has a long standing experience in Credit Risk Modelling, SAS and regression models is joining our Gurgaon institute as Program Director. Here are some excerpts from an interview we conducted, where he talks about the various challenges he faced in his career and the rapid development of Data Analytics.

Continue reading “Speaking with Tanmoy Ganguli, the expert Data Analyst Bringing Cutting Edge Technology to DexLab Analytics”

Skills required during Interviews for a Data Scientist @ Facebook, Intel, Ebay. Square etc.

Skills required during Interviews for a Data Scientist @ Facebook, Intel, Ebay. Square etc.

Basic Programming Languages: You should know a statistical programming language, like R or Python (along with Numpy and Pandas Libraries), and a database querying language like SQL

Statistics: You should be able to explain phrases like null hypothesis, P-value, maximum likelihood estimators and confidence intervals. Statistics is important to crunch data and to pick out the most important figures out of a huge dataset. This is critical in the decision-making process and to design experiments.

Machine Learning: You should be able to explain K-nearest neighbors, random forests, and ensemble methods. These techniques typically are implemented in R or Python.  These algorithms show to employers that you have exposure to how data science can be used in more practical manners.

Data Wrangling: You should be able to clean up data. This basically means understanding that “California” and “CA” are the same thing – a negative number cannot exist in a dataset that describes population. It is all about identifying corrupt (or impure) data and and correcting/deleting them.

Data Visualization: Data scientist is useless on his or her own. They need to communicate their findings to Product Managers in order to make sure those data are manifesting into real applications. Thus, familiarity with data visualization tools like ggplot is very important (so you can SHOW data, not just talk about them)

Software Engineering: You should know algorithms and data structures, as they are often necessary in creating efficient algorithms for machine learning. Know the use cases and run time of these data structures: Queues, Arrays, Lists, Stacks, Trees, etc.

2

What they look for? @ Mu-Sigma, Fractal Analytics

    • Most of the analytics and data science companies, including third party analytics companies such as Mu-sigma and Fractal hire fresher’s in big numbers (some time in hundreds every year).
    • You see one of the main reasons why they are able to survive in this industry is the “Cost Arbitrage” benefit between the US and other developed countries vs India.
    • Generally speaking, they normally pay significantly lower for India talent in India compared to the same talent in the USA. Furthermore, hiring fresh talent from the campuses is one of the key strategies for them to maintain the low cost structure.
    • If they are visiting your campuses for interview process, you should apply. In case if they are not visiting your campus, drop your resume to them using their corporate email id that you can find on their websites.
    • Better will be to find someone in your network (such as seniors) who are working for these companies and ask them to refer you. This is normally the most effective approach after the campus placements.

Key Skills that look for are-

  • Love for numbers and quantitative stuff
  • Grit to keep on learning
  • Some programming experience (preferred)
  • Structured thinking approach
  • Passion for solving problems
  • Willingness to learn statistical concepts

Technical Skills

  • Math (e.g. linear algebra, calculus and probability)
  • Statistics (e.g. hypothesis testing and summary statistics)
  • Machine learning tools and techniques (e.g. k-nearest neighbors, random forests, ensemble methods, etc.)
  • Software engineering skills (e.g. distributed computing, algorithms and data structures)
  • Data mining
  • Data cleaning and munging
  • Data visualization (e.g. ggplot and d3.js) and reporting techniques
  • Unstructured data techniques
  • Python / R and/or SAS languages
  • SQL databases and database querying languages
  • Python (most common), C/C++ Java, Perl
  • Big data platforms like Hadoop, Hive & Pig

Business Skills

  • Analytic Problem-Solving: Approaching high-level challenges with a clear eye on what is important; employing the right approach/methods to make the maximum use of time and human resources.
  • Effective Communication: Detailing your techniques and discoveries to technical and non-technical audiences in a language they can understand.
  • Intellectual Curiosity: Exploring new territories and finding creative and unusual ways to solve problems.
  • Industry Knowledge: Understanding the way your chosen industryfunctions and how data are collected, analyzed and utilized.


Interested in a career in Data Analyst?

To learn more about Data Analyst with Advanced excel course – Enrol Now.
To learn more about Data Analyst with R Course – Enrol Now.
To learn more about Big Data Course – Enrol Now.

To learn more about Machine Learning Using Python and Spark – Enrol Now.
To learn more about Data Analyst with SAS Course – Enrol Now.
To learn more about Data Analyst with Apache Spark Course – Enrol Now.
To learn more about Data Analyst with Market Risk Analytics and Modelling Course – Enrol Now.

Know The Answer To These Interview Questions To Get A Job As Data Analyst

List of Interview Questions for Data Analysts

With this Data analyst interview guide you will know what to expect in an interview round for a position of data analyst.

A good data analyst or scientist must be capable of drawing actionable insights from the data that a company generates. They must possess a good sense of what data they must collect and should have a solid process for carrying it out effectively using processes of data analysis and building predictive models.

A data analyst must possess a strong foundation in the following topics: operations research, statistics, machine learning along with some database skills, such as SQL or SAS in order to clean, retrieve and process the data from different sources. One can lead to this role from different pathways thus candidates can expect to be bombarded with questions relevant to statistics ort mathematics and even computer programming or engineering.

Data scientists are also often required to script programs using R or Python or Matlab and the role will typically not place emphasis on the programming skills or practices and the general software engineering skills which is necessary for working with production quality software.

Here is a list of common data analyst interview questions:

Operational questions:

  1.  Describe the steps that you follow when creating a design a data-driven model to manage a business problem. For example you may try and automatically classify customer support mails, by either sentiment or topic. Another task may be to predict a company’s employee churn.
  2. What models would you classify as simple models and which are the ones that are complex according to you? What are the comparative strengths and weaknesses of choosing a more complex model over a simplistic one?
  3. What are the possible ways in which you can combine models to create an ensemble model and what are the main advantages of doing this?
  4. Tell us about certain pre-processing steps that you may carry out on data before using them to train a model and describe the conditions under which they may be applied.

Role specific questions:

About basic ideas in probability, statistics and machine learning:

  1. Define what is confidence interval and why do you think it is useful?
  2. What is the main difference between correlation and independence?
  3. What is Bayes Theorem? What is conditional probability? What is its use in practice?
  4. When and how do you understand that you have collected ample data for building a model?
  5. Tell us the difference between classification and regression.

Hope this list of common data science interview questions will prepare you for a job at a reputable data analysis company. For more such data science news, tutorials and articles with emphasis on programming and analytics view our regular updates from DexLab Analytics.


Interested in a career in Data Analyst?

To learn more about Data Analyst with Advanced excel course – Enrol Now.
To learn more about Data Analyst with R Course – Enrol Now.
To learn more about Big Data Course – Enrol Now.

To learn more about Machine Learning Using Python and Spark – Enrol Now.
To learn more about Data Analyst with SAS Course – Enrol Now.
To learn more about Data Analyst with Apache Spark Course – Enrol Now.
To learn more about Data Analyst with Market Risk Analytics and Modelling Course – Enrol Now.

Are You Trying to Ace Your Tableau Interview?

Are You Trying to Ace Your Tableau Interview?

If you are looking to be hired as Tableau expert then you must be acquainted with these common interview questions and answers. These questions have been collected by the experts at DexLab Analytics who offer Tableau BI Certification training at the institute. These questions are to give you an idea of the types of questions you may be asked at an interview. Happy job hunting!

What do you understand by Data Visualization?

Data visualization is a much advanced, precise and ordered way of viewing large volumes of data. It is the way one visually represents data into graphs, charts and other illustrative aids, especially when you cannot define them textually. Through the various software applications like Tableau one can show various trends, patterns, correlations etc.

What are the main differences between a Tableau desktop and a Tableau server?

In Tableau desktop one can create workbooks for data visualizations but Tableau Servers are used to distribute the interactive workbooks or/and reports to the target audience. Users of Tableau servers can also edit and update workbooks and dashboards online on the Server but they cannot create new workbooks.

But there are limited options for editing in server as compared to desktop.

2

Differentiate between filters and parameters in Tableau.

The differences in these two features actually lie in their applications. With parameters one can allow users to insert their values, which can be integers, dates, floats, string these can be used for calculation purposes. But in filters one can only receive values which the user chooses to ‘filter by’ in the list, this cannot be used to perform calculations.

In them users can change the measures and dimensions in case of parameters but for filters this feature is not approved.

Are you interested in a Tableau training course we can help you get a head start in this much coveted career. Simply view our course details at Dexlab Analytics.

Why should you choose to learn Tableau? This infograph may help you decide better:

Are You Trying to Ace Your Tableau Interview? from Infographics


Interested in a career in Data Analyst?

To learn more about Data Analyst with Advanced excel course – Enrol Now.
To learn more about Data Analyst with R Course – Enrol Now.
To learn more about Big Data Course – Enrol Now.

To learn more about Machine Learning Using Python and Spark – Enrol Now.
To learn more about Data Analyst with SAS Course – Enrol Now.
To learn more about Data Analyst with Apache Spark Course – Enrol Now.
To learn more about Data Analyst with Market Risk Analytics and Modelling Course – Enrol Now.

Call us to know more