In our previous blog we discussed about few of the basic functions of MQL like .find() , .count() , .pretty() etc. and in this blog we will continue to do the same. At the end of the blog there is a quiz for you to solve, feel free to test your knowledge and wisdom you have gained so far.
Given below is the list of functions that can be used for data wrangling:-
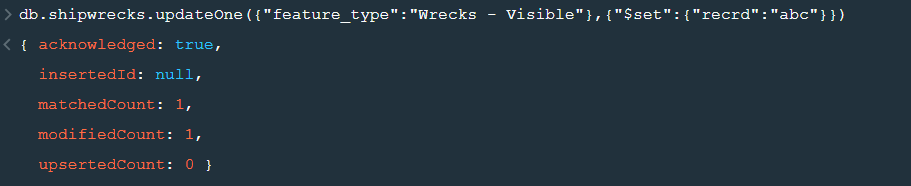
updateOne() :- This function is used to change the current value of a field in a single document.
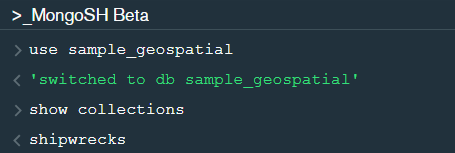
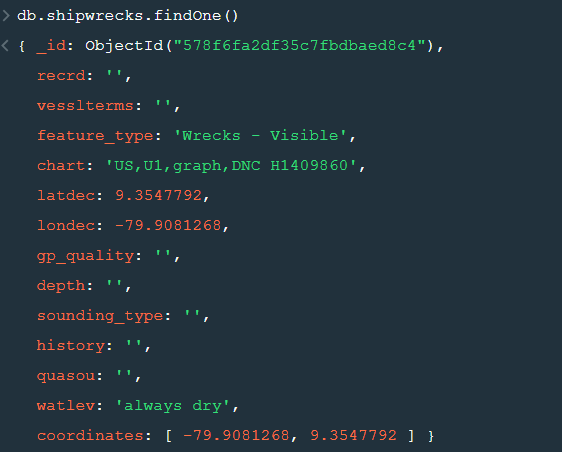
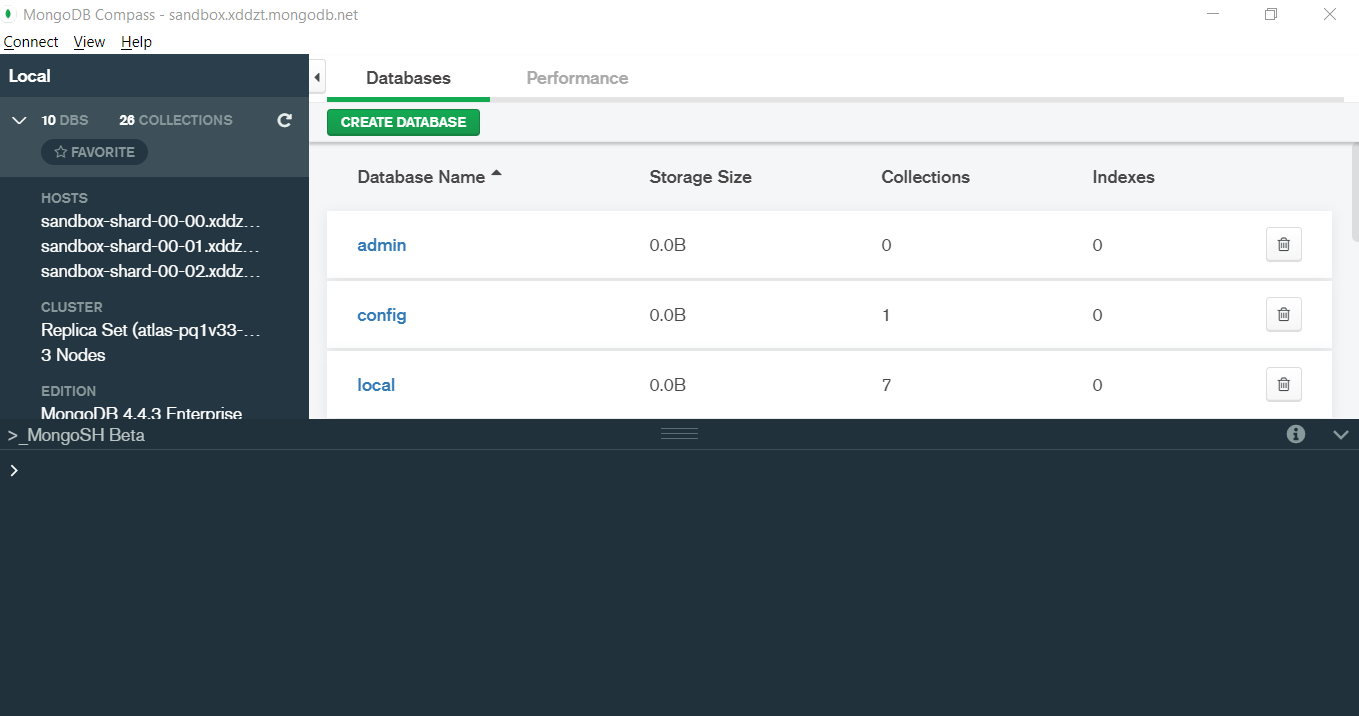
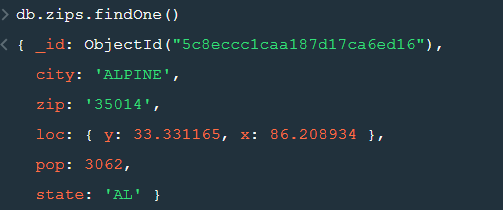
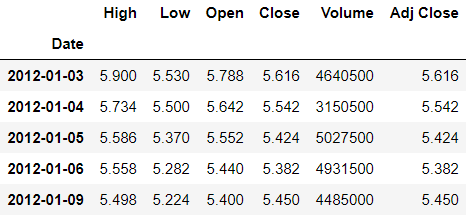
After changing the database to “sample_geospatial” we want to see what the document looks like? So for that we will use .findOne() function.
Now lets update the field value of “recrd” from ‘ ’ to “abc” where the “feature_type” is ‘Wrecks-Visible’.
Now within the .updateOne() funtion any thing in the first part of { } is the condition on the basis of which we want to update the given document and the second part is the changes which we want to make. Here we are saying that set the value as “abc” in the “recrd” field . In case you wanted to increase the value by a certain number ( assuming that the value is integer or float) you can use “$inc” instead.
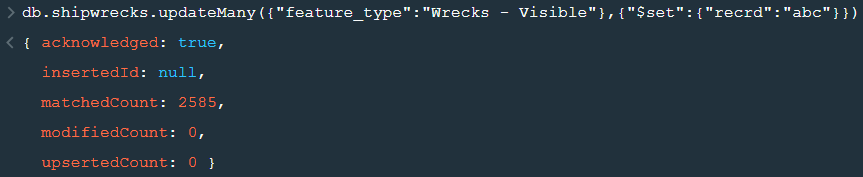
2. updateMany() :- This function updates many documents at once based on the condition provided.
3. deleteOne() & deleteMany() :- These functions are used to delete one or many documents based on the given condition or field.
4. Logical Operators :-
“$and” : It is used to match all the conditions.
“$or” : It is used to match any of the conditions.
The first code matches both the conditions i.e. name should be “Wetpaint” and “category_code” should be “web”, whereas the second code matches any one of the conditions i.e. either name should be “Wetpaint” or “Facebook”. Try these codes and see the difference by yourself.
So, with that we come to the end of the discussion on the MongoDB Basics. Hopefully it helped you understand the topic, for more information you can also watch the video tutorial attached down this blog. The blog is designed and prepared by Niharika Rai, Analytics Consultant, DexLab AnalyticsDexLab Analytics offers machine learning courses in Gurgaon. To keep on learning more, follow DexLab Analytics blog.
In this particular blog we will discuss about few of the basic functions of MQL (MongoDB Query Language) and we will also see how to use them? We will be using MongoDB Compass shell (MongoSH Beta) which is available in the latest version of MongoDB Compass.
Connect your Atlas cluster to your MongoDB Compass to get started. Latest version of MongoDB Compass will have this shell, so if you don’t find this shell then please install the latest version for this to work.
Now lets start with the functions.
find() :- You need this function for data extraction in the shell.
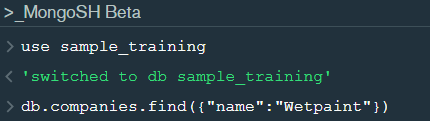
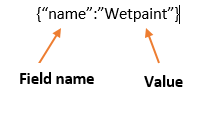
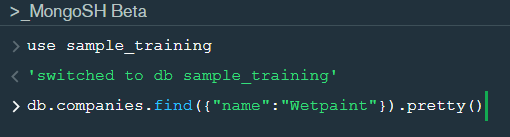
In the shell we need to first write the “use database name” code to access the database then use .find() to extract data which has name “Wetpaint”
For the above query we get the following result:-
The above result brings us to another function .pretty() .
2. pretty() :- this function helps us see the result more clearly.
Try it yourself to compare the results.
3. count() :- Now lets see how many entries we have by the company name “Wetpaint”.
So we have only one document.
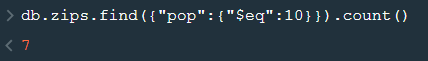
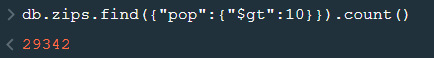
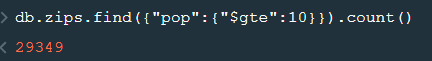
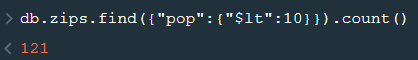
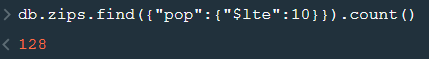
4. Comparison operators :-
“$eq” : Equal to
“$neq”: Not equal to
“$gt”: Greater than
“$gte”: Greater than equal to
“$lt”: Less than
“$lte”: Less than equal to
Lets see how this works.
5. findOne() :- To get a single document from a collection we use this function.
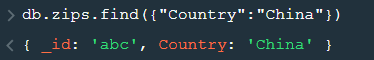
6. insert() :- This is used to insert documents in a collection.
Now lets check if we have been able to insert this document or not.
Notice that a unique id has been added to the document by default. The given id has to be unique or else there will be an error. To provide a user defined id use “_id”.
So, with that we come to the end of the discussion on the MongoDB. Hopefully it helped you understand the topic, for more information you can also watch the video tutorial attached down this blog. The blog is designed and prepared by Niharika Rai, Analytics Consultant, DexLab AnalyticsDexLab Analytics offers machine learning courses in Gurgaon. To keep on learning more, follow DexLab Analytics blog.
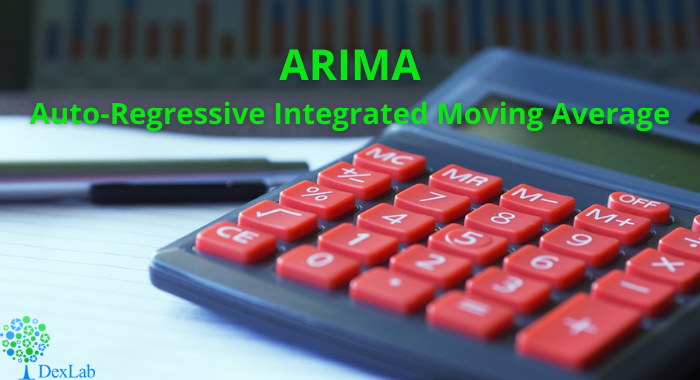
This is another blog added to the series of time series forecasting. In this particular blog I will be discussing about the basic concepts of ARIMA model.
So what is ARIMA?
ARIMA also known as Autoregressive Integrated Moving Average is a time series forecasting model that helps us predict the future values on the basis of the past values. This model predicts the future values on the basis of the data’s own lags and its lagged errors.
When a data does not reflect any seasonal changes and plus it does not have a pattern of random white noise or residual then an ARIMA model can be used for forecasting.
There are three parameters attributed to an ARIMA model p, q and d :-
p :- corresponds to the autoregressive part
q:- corresponds to the moving average part.
d:- corresponds to number of differencing required to make the data stationary.
In our previous blog we have already discussed in detail what is p and q but what we haven’t discussed is what is d and what is the meaning of differencing (a term missing in ARMA model).
Since AR is a linear regression model and works best when the independent variables are not correlated, differencing can be used to make the model stationary which is subtracting the previous value from the current value so that the prediction of any further values can be stabilized . In case the model is already stationary the value of d=0. Therefore “differencing is the minimum number of deductions required to make the model stationary”. The order of d depends on exactly when your model becomes stationary i.e. in case the autocorrelation is positive over 10 lags then we can do further differencing otherwise in case autocorrelation is very negative at the first lag then we have an over-differenced series.
The formula for the ARIMA model would be:-
To check if ARIMA model is suited for our dataset i.e. to check the stationary of the data we will apply Dickey Fuller test and depending on the results we will using differencing.
In my next blog I will be discussing about how to perform time series forecasting using ARIMA model manually and what is Dickey Fuller test and how to apply that, so just keep on following us for more.
So, with that we come to the end of the discussion on the ARIMA Model. Hopefully it helped you understand the topic, for more information you can also watch the video tutorial attached down this blog. The blog is designed and prepared by Niharika Rai, Analytics Consultant, DexLab AnalyticsDexLab Analytics offers machine learning courses in Gurgaon. To keep on learning more, follow DexLab Analytics blog.
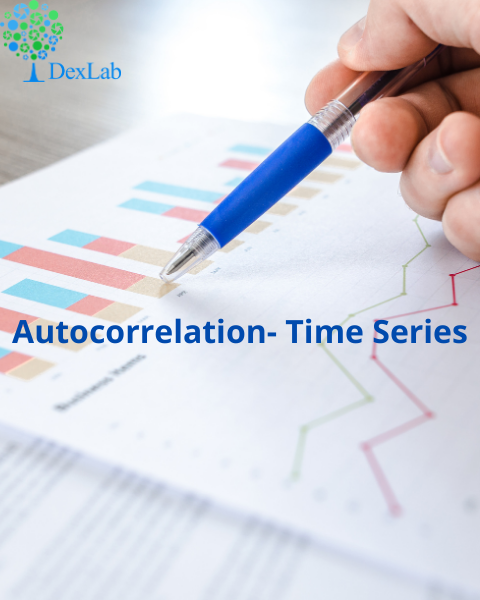
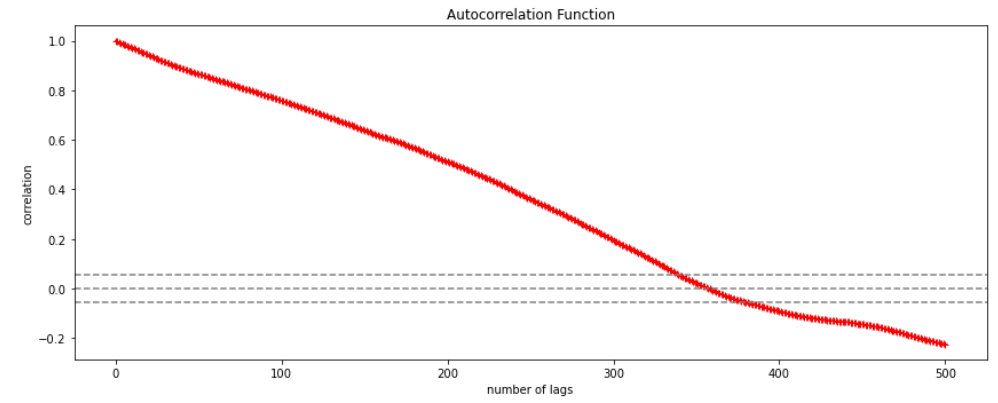
Autocorrelation is a special case of correlation. It refers to the relationship between successive values of the same variables .For example if an individual with a consumption pattern:-
spends too much in period 1 then he will try to compensate that in period 2 by spending less than usual. This would mean that Ut is correlated with Ut+1 . If it is plotted the graph will appear as follows :
Positive Autocorrelation : When the previous year’s error effects the current year’s error in such a way that when a graph is plotted the line moves in the upward direction or when the error of the time t-1 carries over into a positive error in the following period it is called a positive autocorrelation. Negative Autocorrelation : When the previous year’s error effects the current year’s error in such a way that when a graph is plotted the line moves in the downward direction or when the error of the time t-1 carries over into a negative error in the following period it is called a negative autocorrelation.
Now there are two ways of detecting the presence of autocorrelation By plotting a scatter plot of the estimated residual (ei) against one another i.e. present value of residuals are plotted against its own past value.
If most of the points fall in the 1st and the 3rd quadrants , autocorrelation will be positive since the products are positive.
If most of the points fall in the 2nd and 4th quadrant , the autocorrelation will be negative, because the products are negative. By plotting ei against time : The successive values of ei are plotted against time would indicate the possible presence of autocorrelation .If e’s in successive time show a regular time pattern, then there is autocorrelation in the function. The autocorrelation is said to be negative if successive values of ei changes sign frequently. First Order of Autocorrelation (AR-1) When t-1 time period’s error affects the error of time period t (current time period), then it is called first order of autocorrelation. AR-1 coefficient p takes values between +1 and -1 The size of this coefficient p determines the strength of autocorrelation. A positive value of p indicates a positive autocorrelation. A negative value of p indicates a negative autocorrelation In case if p = 0, then this indicates there is no autocorrelation. To explain the error term in any particular period t, we use the following formula:-
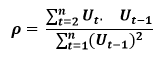
Where Vt= a random term which fulfills all the usual assumptions of OLS How to find the value of p?
One can estimate the value of ρ by applying the following formula :-
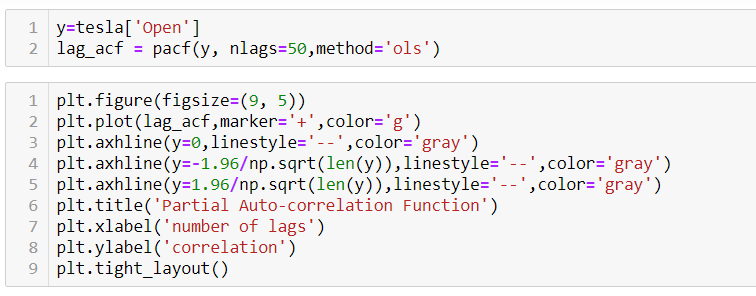
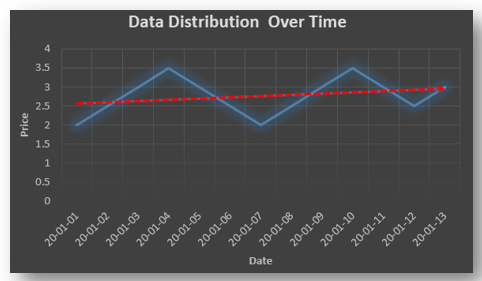
Data Smoothing is done to better understand the hidden patterns in the data. In the non- stationary processes, it is very hard to forecast the data as the variance over a period of time changes, therefore data smoothing techniques are used to smooth out the irregular roughness to see a clearer signal.
In this segment we will be discussing two of the most important data smoothing techniques :-
Moving average smoothing
Exponential smoothing
Moving average smoothing
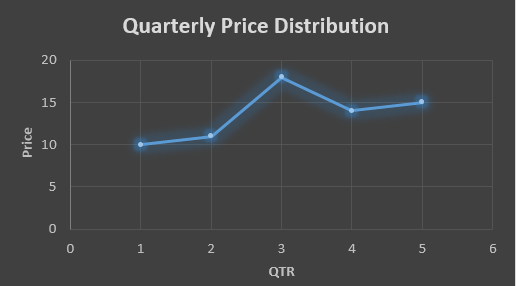
Moving average is a technique where subsets of original data are created and then average of each subset is taken to smooth out the data and find the value in between each subset which better helps to see the trend over a period of time.
Lets take an example to better understand the problem.
Suppose that we have a data of price observed over a period of time and it is a non-stationary data so that the tend is hard to recognize.
QTR (quarter)
Price
1
10
2
11
3
18
4
14
5
15
6
?
In the above data we don’t know the value of the 6th quarter.
….fig (1)
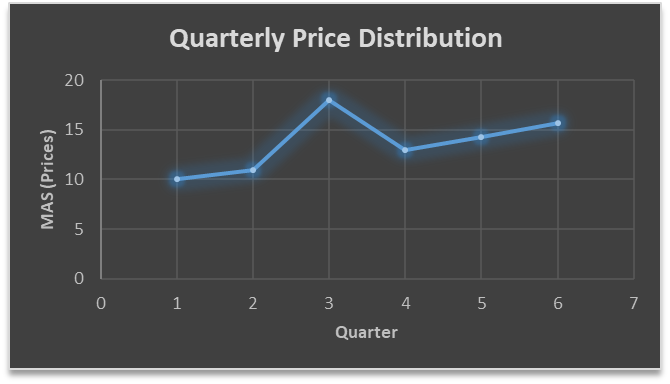
The plot above shows that there is no trend the data is following so to better understand the pattern we calculate the moving average over three quarter at a time so that we get in between values as well as we get the missing value of the 6th quarter.
To find the missing value of 6th quarter we will use previous three quarter’s data i.e.
MAS = = 15.7
QTR (quarter)
Price
1
10
2
11
3
18
4
14
5
15
6
15.7
MAS = = 13
MAS = = 14.33
QTR (quarter)
Price
MAS (Price)
1
10
10
2
11
11
3
18
18
4
14
13
5
15
14.33
6
15.7
15.7
….. fig (2)
In the above graph we can see that after 3rd quarter there is an upward sloping trend in the data.
Exponential Data Smoothing
In this method a larger weight ( ) which lies between 0 & 1 is given to the most recent observations and as the observation grows more distant the weight decreases exponentially.
The weights are decided on the basis how the data is, in case the data has low movement then we will choose the value of closer to 0 and in case the data has a lot more randomness then in that case we would like to choose the value of closer to 1.
EMA= Ft= Ft-1 + (At-1 – Ft-1)
Now lets see a practical example.
For this example we will be taking = 0.5
Taking the same data……
QTR (quarter)
Price
(At)
EMS Price(Ft)
1
10
10
2
11
?
3
18
?
4
14
?
5
15
?
6
?
?
To find the value of yellow cell we need to find out the value of all the blue cells and since we do not have the initial value of F1 we will use the value of A1. Now lets do the calculation:-
F2=10+0.5(10 – 10) = 10
F3=10+0.5(11 – 10) = 10.5
F4=10.5+0.5(18 – 10.5) = 14.25
F5=14.25+0.5(14 – 14.25) = 14.13
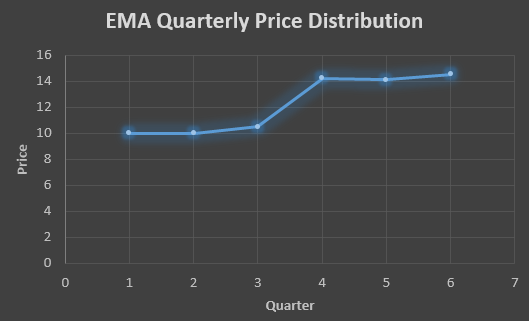
F6=14.13+0.5(15 – 14.13)= 14.56
QTR (quarter)
Price
(At)
EMS Price(Ft)
1
10
10
2
11
10
3
18
10.5
4
14
14.25
5
15
14.13
6
14.56
14.56
In the above graph we see that there is a trend now where the data is moving in the upward direction.
So, with that we come to the end of the discussion on the Data smoothing method. Hopefully it helped you understand the topic, for more information you can also watch the video tutorial attached down this blog. The blog is designed and prepared by Niharika Rai, Analytics Consultant, DexLab AnalyticsDexLab Analytics offers machine learning courses in Gurgaon. To keep on learning more, follow DexLab Analytics blog.
A time series is a sequence of numerical data in which each item is associated with a particular instant in time. Many sets of data appear as time series: a monthly sequence of the quantity of goods shipped from a factory, a weekly series of the number of road accidents, daily rainfall amounts, hourly observations made on the yield of a chemical process, and so on. Examples of time series abound in such fields as economics, business, engineering, the natural sciences (especially geophysics and meteorology), and the social sciences.
Univariate time series analysis- When we have a single sequence of data observed over time then it is called univariate time series analysis.
Multivariate time series analysis – When we have several sets of data for the same sequence of time periods to observe then it is called multivariate time series analysis.
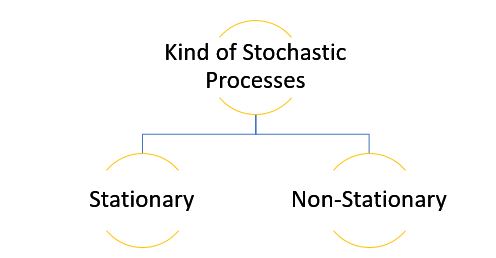
The data used in time series analysis is a random variable (Yt) where t is denoted as time and such a collection of random variables ordered in time is called random or stochastic process.
Stationary: A time series is said to be stationary when all the moments of its probability distribution i.e. mean, variance , covariance etc. are invariant over time. It becomes quite easy forecast data in this kind of situation as the hidden patterns are recognizable which make predictions easy.
Non-stationary: A non-stationary time series will have a time varying mean or time varying variance or both, which makes it impossible to generalize the time series over other time periods.
Non stationary processes can further be explained with the help of a term called Random walk models. This term or theory usually is used in stock market which assumes that stock prices are independent of each other over time. Now there are two types of random walks: Random walk with drift : When the observation that is to be predicted at a time ‘t’ is equal to last period’s value plus a constant or a drift (α) and the residual term (ε). It can be written as Yt= α + Yt-1 + εt The equation shows that Yt drifts upwards or downwards depending upon α being positive or negative and the mean and the variance also increases over time. Random walk without drift: The random walk without a drift model observes that the values to be predicted at time ‘t’ is equal to last past period’s value plus a random shock. Yt= Yt-1 + εt Consider that the effect in one unit shock then the process started at some time 0 with a value of Y0 When t=1 Y1= Y0 + ε1 When t=2 Y2= Y1+ ε2= Y0 + ε1+ ε2 In general, Yt= Y0+∑ εt In this case as t increases the variance increases indefinitely whereas the mean value of Y is equal to its initial or starting value. Therefore the random walk model without drift is a non-stationary process.
So, with that we come to the end of the discussion on the Time Series. Hopefully it helped you understand time Series, for more information you can also watch the video tutorial attached down this blog. DexLab Analytics offers machine learning courses in delhi. To keep on learning more, follow DexLab Analytics blog.
Artificial Intelligence, or, its more popular acronym AI is no longer a term to be read about in a sci-fi book, it is a reality that is reshaping the world by introducing us to virtual assistants, helping us be more secure by enabling us with futuristic measures. The evolution of AI has been pretty consistent and as we are busy navigating through a pandemic-ridden path towards the future, adapting to the “new normal”, and becoming increasingly reliant on technology, AI assumes a greater significance.
The AI applications which are already being implemented has resulted in a big shift, causing an apprehension that the adoption of AI technology on a larger scale would eventually lead to job cuts, whereas in reality, it would lead to the creation of new jobs across industries. Adoption of AI technology would push the demand for a workforce that is highly skilled, enrolling in an artificial intelligence course in delhi could be a timely decision.
Now that we are about to reach the end of 2020, let us take a look at the possible impacts of AI in the future.
AI will create more jobs
Yes, contrary to the popular apprehension AI would end up creating jobs in the future. However, the adoption of AI to automate tasks means yes, there would be a shift, and a job that does not need special skills will be handled by AI powered tools. Jobs that could be done without error, completed faster, with a higher level of efficiency, in short better than humans could be performed by robots. However, with that being said there would be more specialized job roles, remember AI technology is about the simulation of human intelligence, it is not the intelligence, so there would be humans in charge of carrying out the AI operated areas to monitor the work. Not just that but for developing smarter AI application and implementation there should be a skilled workforce ready, a report by World Economic Forum is indicative of that. From design to maintenance, AI specialists would be in high demand especially the developers. The fourth industrial revolution is here, industries are gearing up to build AI infrastructure, it is time to smell the coffee as by the end of 2022 there will be millions of AI jobs waiting for the right candidates.
Dangerous jobs will be handled by robots
In the future, hazardous works will be handled by robots. Now the robots are already being employed to handle heavy lifting tasks, along with handling the mundane ones that require only repetition and manual labor. Along with automating these tasks, the robot workforce can also handle the situation where human workers might sustain grave injuries. If you have been aware and interested then you already heard about the “SmokeBot”. In the future, it might be the robots who will enter the flaming buildings for assessment before their human counterparts can start their task. Manufacturing plants that deal with toxic elements need robot workers, as humans run a bigger risk when they are exposed to such chemicals. Furthermore, the nuclear plants might have a robot crew that could efficiently handle such tasks. Other areas like pipeline exploration, bomb defusing, conducting rescue operations in hostile terrain should be handled by AI robots.
Smarter healthcare facilities
AI implementation which has already begun would continue to transform the healthcare services. With AI being in place CT scan and MRI images could be more precise pointing out even minuscule changes that earlier went undetected. Drug development could also be another area that would see vast improvement and in a post-pandemic world, people would need to be better prepared to fight against such viruses. Real-time detection could prevent many health issues going severe and keeping a track of the health records preventive measures could be taken. One of the most crucial changes that could be revolutionary, is the personalized medication which could only be driven by AI technology. This would completely change the way healthcare functions. Now that we are seeing chat bots for handling sales queries, the future healthcare landscape might be ruled by virtual assistants specifically developed for offering assistance to the patients. There are going to be revolutionary changes in this field in the future, thereby pushing the demand for professionals skilled in deep learning for computer vision with python.
Smarter finance
We are already living in an age where we have robo advisors, this is just the beginning and the growing AI implementation would enable an even smarter analytics system that would minimize the credit risk and would allow banks and other financial institutes to minimize the risk of fraud. Smarter asset management, enhanced customer support are going to be the core features. Smarter ML algorithms would detect any and every oddity in behavior or in transactions and would help prevent any kind of fraud from happening. With analytics being in place it would be easier to predict the future trends and thereby being more efficient in servicing the customers. The introduction of personalized services is going to be another key feature to look out for.
Retail space gets a boost
The retailers are now aiming to implement AI applications to offer smart shopping solutions to the future buyers. Along with coming up with personalized shopping suggestions for the customers and showing them suggestions based on their shopping pattern, the retailers would also be using the AI to predict the future trends and work accordingly. Not just that but they can easily maintain the supply and demand balance with the help of AI solutions and stock up items that are going to be in demand instead of items that would not be trendy. The smarter assistants would ensure that the customer queries are being handled and they could also be helping them with shopping by providing suggestions and information. From smart marketing to smarter delivery, the future of retail would be dominated by AI as the investment in this space is gradually going up.
The future is definitely going to be impacted by the AI technology in more ways than one. So, be future ready and get yourself upskilled as it is the need of the hour, stay updated and develop the skill to move towards the AI future with confidence.
Computer vision is an advanced branch of AI that revolves around the concept of object recognition and smart classification of objects in images or, videos. This is indeed a revolutionary innovation that aims to simulate the way human vision is trained to identify and classify objects. Studying deep learning for computer vision course can help gain specialized knowledge in this field. The growing application of computer vision across industries is now opening up multiple career avenues.
The application of computer vision is changing different industries:
Healthcare
In healthcare computer vision technology is adding efficiency to medical imaging procedures such as MRI. Detecting even the smallest of oddity is now possible which ensures accurate diagnosis. In departments like radiology, cardiology, computer vision techniques are gradually being adopted. Not just that, during surgical procedures too computer vision can offer cutting edge solutions. A case in point here would be Gauss Surgical’s blood monitoring system that analyzes the amount of blood loss during surgery.
Automotive
The self-driving cars are no longer a sci-fi theme, but, a hardcore reality, computer vision technology analyzes the road conditions, detects humans crossing the road, objects as well as road signs and lane changes. There are advanced systems that aim to prevent accidents that run on the same technology and could also signal if the driver behind the wheel is not awake, thus saving lives in real-time.
Manufacturing
The manufacturing industry is reaping benefits of computer vision technology in so many ways. Using computer vision the equipment condition can be monitored and measures could be taken accordingly to prevent untimely breakdown. Maintaining production quality also gets easier with computer vision application as even the smallest defect in a product or, on the packaging could be detected which might get missed by human eyes. Not just that but, even the labels could be efficiently screened to detect printing errors.
Agriculture
In the field of agriculture, computer vision technology is helping maintain quality and adding efficiency. Using drones to monitor the crops is getting easier, not just that but computer vision technology is helping farmers separate crops as per quality and decide which crop could be stored for a long time. Livestock monitoring is another job that could be efficiently handled using computer vision technology. However, one significant application is perhaps using computer vision to detect crops that are infected and need pesticide.
Military applications
Computer vision can add an edge to modern warfare, its adoption in the military surely indicate that. Autonomous vehicles powered with computer vision techniques can save so many lives, especially when deployed during battles. Not just that, but detecting landmines, or, enemy, both high-risk yet extremely important operations can be handled successfully by adopting computer vision techniques. Image sensors could deliver the intelligence the military think-tank needs to take timely decisions.
Surveillance
Surveillance is a highly crucial area that could immensely benefit from computer vision applications. In shops preventing crimes like shoplifting could become easier, as the cameras could easily detect any kind of suspicious behavior and activity going on in the shop premises. Another factor to consider here would be the application of facial recognition to identify miscreants from videos.
Computer vision technology is changing the way we look at our world, and with further research, there would be smarter products on the market that can truly transform our lives by allowing us to be more efficient. For someone aspiring to make a career in this promising domain should undergo computer vision course python training.
Running a business is a challenging job, especially when business operations take place on a small-scale platform. Small business owners need constant motivation and brainstorming to keep their business in a profitable position.
However, as the world is busy deriving benefits from AI technology, and professionals opting for artificial intelligence course in delhi for better career prospects, small business owners too should seize this opportunity to power up their businesses.
Why the small business owners are shying away from AI?
With biggies like Google, Amazon, Apple, Microsoft empowering themselves with AI tools, small businesses are somewhat showing reluctance towards the new technology. Only a small percentage of businesses ranging from small to medium have so far been influenced by it. A 2018 survey showed the number to be around 13.6%.
This indicates there is some inhibition in the small business community, but, it might not just be that, when questioned most small business owners often cite reasons like lack of expertise, financial concern to be the causes.
They are mostly under the misconception that such advanced technology is best suited for giant platforms and their small scale businesses are not going to rake in any profit, even if they invest. They don’t even have tons of data like most businesses, to begin with. So, AI being a data-driven technology, might not work for them.
Their perception is gradually changing because of the way AI has started seeping through the very fiber of civilization and impacting so many aspects of life. It is not possible for small businesses to indulge in AI research or, develop a platform specifically for their business needs for feasible reasons but, they can get ideas regarding how best to conduct business the AI way.
Let’s find out how AI can be incorporated into small business infrastructure to improve five core areas.
Smarter sales and marketing with AI-powered CRMs
A CRM is an indispensable tool for any business, let alone a small one. Basically, a CRM works to garner customer data from various platforms to enable the sales and marketing team to keep track of their valuable customers while pursuing new leads.
The fusion of AI and CRM could do wonders as it is evident from the way Einstein AI, introduced by SalesForce is working.
You stand to gain insight into the customer mindset as this fusion will work to analyze customer mindset by analyzing the conversations that happened across different channels. This insight can help shape your sales and marketing efforts accordingly especially if you can upskill your team with customer market analysis courses.
Keep an eye on your rivals
Staying one step ahead of your biggest competition in the market is a crucial need no business owner big or small can afford to ignore. However, it is not easy to monitor every move they make, but, AI can be your biggest ally in helping you track your rival’s every digital move.
AI-powered Crayon, is a smart tool that monitors what your competition is doing on social media, across websites and applications, you can gauge their performance and activities and keep a tab on their marketing strategies, pricing, and other such issues to make suitable modifications to your own.
Automate customer service
Handling your customers is an important but, tedious task and as your business starts to grow so does your customer base and their queries. Investing in a big support team might not always be a feasible option for you, so why don’t you take advantage of chatbots to automate the whole process and make it more efficient?
Not all queries are important, some of these are generic which the chatbots can handle while your sales team can focus on more personalized or, technical queries to keep your customers happy. Answering support tickets can be easy with a tool like Digital Genius. It is a great option even for those businesses which can’t afford a support team.
Smoother HR operations
No matter how small scale your business might be, you still have to manage your employees and hire new ones, which means having an HR team ready round the clock. Now you can manage this segment bypassing all hassles thanks to AI-powered platforms that automate your HR functions, be it screening applications, scheduling interviews or, onboarding the new employees, every segment will be well taken care of. Not just that but, the administrative jobs that the HR have to do repetitively could be automated too.
Customize your customer journey
Customers like to be pampered, when they shop from big brand names they hardly get to experience that personalized approach. The trendy products aimed at mass-market leave them wishing for something that would suit their style. Retail Analytics Courses can help you develop a better understanding of the whole issue.
Being a small business owner you already have the advantage to take care of this issue and you can be near perfect in your approach if you get support from smart AI algorithms that can browse through customer data and detect patterns to help you understand the personal preferences of customers and thereby allow you to modify your products accordingly to suit their needs.
Coupled with AI power you could also improve your logistics to ensure your supply chain does not experience any glitch.
The development of AI platforms programmed to perform specialized tasks need to be recognized by the small business community, only then they would find the motivation to channelize the power in the right direction. They can also consider upskilling themselves with deep learning for computer vision course, to be able to harness the power of AI.