Data Scientists Archives - DexLab Analytics | Big Data Hadoop SAS R Analytics Predictive Modeling & Excel VBA

Autocorrelation- Time Series – Part 3

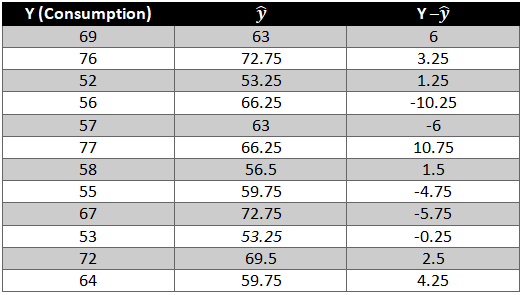
Autocorrelation is a special case of correlation. It refers to the relationship between successive values of the same variables .For example if an individual with a consumption pattern:-

spends too much in period 1 then he will try to compensate that in period 2 by spending less than usual. This would mean that Ut is correlated with Ut+1 . If it is plotted the graph will appear as follows :

Positive Autocorrelation : When the previous year’s error effects the current year’s error in such a way that when a graph is plotted the line moves in the upward direction or when the error of the time t-1 carries over into a positive error in the following period it is called a positive autocorrelation.
Negative Autocorrelation : When the previous year’s error effects the current year’s error in such a way that when a graph is plotted the line moves in the downward direction or when the error of the time t-1 carries over into a negative error in the following period it is called a negative autocorrelation.

Now there are two ways of detecting the presence of autocorrelation
By plotting a scatter plot of the estimated residual (ei) against one another i.e. present value of residuals are plotted against its own past value.

If most of the points fall in the 1st and the 3rd quadrants , autocorrelation will be positive since the products are positive.

If most of the points fall in the 2nd and 4th quadrant , the autocorrelation will be negative, because the products are negative.
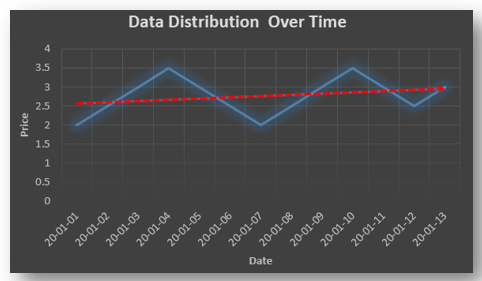
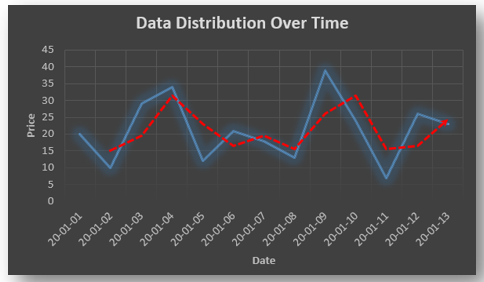
By plotting ei against time : The successive values of ei are plotted against time would indicate the possible presence of autocorrelation .If e’s in successive time show a regular time pattern, then there is autocorrelation in the function. The autocorrelation is said to be negative if successive values of ei changes sign frequently.
First Order of Autocorrelation (AR-1)
When t-1 time period’s error affects the error of time period t (current time period), then it is called first order of autocorrelation.
AR-1 coefficient p takes values between +1 and -1
The size of this coefficient p determines the strength of autocorrelation.
A positive value of p indicates a positive autocorrelation.
A negative value of p indicates a negative autocorrelation
In case if p = 0, then this indicates there is no autocorrelation.
To explain the error term in any particular period t, we use the following formula:-

Where Vt= a random term which fulfills all the usual assumptions of OLS
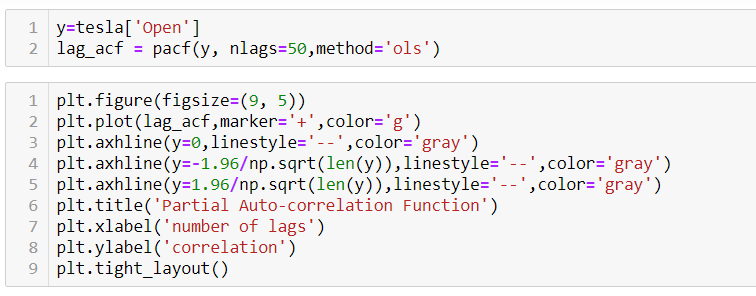
How to find the value of p?

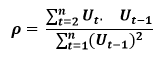
One can estimate the value of ρ by applying the following formula :-

Time Series Analysis Part I


A time series is a sequence of numerical data in which each item is associated with a particular instant in time. Many sets of data appear as time series: a monthly sequence of the quantity of goods shipped from a factory, a weekly series of the number of road accidents, daily rainfall amounts, hourly observations made on the yield of a chemical process, and so on. Examples of time series abound in such fields as economics, business, engineering, the natural sciences (especially geophysics and meteorology), and the social sciences.

  • Univariate time series analysis- When we have a single sequence of data observed over time then it is called univariate time series analysis.
  • Multivariate time series analysis – When we have several sets of data for the same sequence of time periods to observe then it is called multivariate time series analysis.

The data used in time series analysis is a random variable (Yt) where t is denoted as time and such a collection of random variables ordered in time is called random or stochastic process.

Stationary: A time series is said to be stationary when all the moments of its probability distribution i.e. mean, variance , covariance etc. are invariant over time. It becomes quite easy forecast data in this kind of situation as the hidden patterns are recognizable which make predictions easy.

Non-stationary: A non-stationary time series will have a time varying mean or time varying variance or both, which makes it impossible to generalize the time series over other time periods.

Non stationary processes can further be explained with the help of a term called Random walk models. This term or theory usually is used in stock market which assumes that stock prices are independent of each other over time. Now there are two types of random walks:
Random walk with drift : When the observation that is to be predicted at a time ‘t’ is equal to last period’s value plus a constant or a drift (α) and the residual term (ε). It can be written as
Yt= α + Yt-1 + εt
The equation shows that Yt drifts upwards or downwards depending upon α being positive or negative and the mean and the variance also increases over time.
Random walk without drift: The random walk without a drift model observes that the values to be predicted at time ‘t’ is equal to last past period’s value plus a random shock.
Yt= Yt-1 + εt
Consider that the effect in one unit shock then the process started at some time 0 with a value of Y0
When t=1
Y1= Y0 + ε1
When t=2
Y2= Y1+ ε2= Y0 + ε1+ ε2
In general,
Yt= Y0+∑ εt
In this case as t increases the variance increases indefinitely whereas the mean value of Y is equal to its initial or starting value. Therefore the random walk model without drift is a non-stationary process.

So, with that we come to the end of the discussion on the Time Series. Hopefully it helped you understand time Series, for more information you can also watch the video tutorial attached down this blog. DexLab Analytics offers machine learning courses in delhi. To keep on learning more, follow DexLab Analytics blog.


.

Linear Regression Part II: Predictive Data Analysis Using Linear Regression

Linear Regression Part II: Predictive Data Analysis Using Linear Regression

In our previous blog we studied about the basic concepts of Linear Regression and its assumptions and let’s practically try to understand how it works.

Given below is a dataset for which we will try to generate a linear function i.e.

y=b0+b1Xi

Where,

y= Dependent variable

Xi= Independent variable

b0 = Intercept (coefficient)

b1 = Slope (coefficient)

To find out beta (b0& b1) coefficients we use the following formula:-

Let’s start the calculation stepwise.

  1. First let’s find the mean of x and y and then find out the difference between the mean values and the Xi and Yie. (x-x ̅ ) and (y-y ̅ ).
  2. Now calculate the value of (x-x ̅ )2 and (y-y ̅ )2. The variation is squared to remove the negative signs otherwise the summation of the column will be 0.
  3. Next we need to see how income and consumption simultaneously variate i.e. (x-x ̅ )* (y-y ̅ )

Now all there is left is to use the above calculated values in the formula:-

As we have the value of beta coefficients we will be able to find the y ̂(dependent variable) value.

We need to now find the difference between the predicted y ̂ and observed y which is also called the error term or the error.

To remove the negative sign lets square the residual.

What is R2 and adjusted R2 ?

R2 also known as goodness of fit is the ratio of the difference between observed y and predicted  and the observed y and the mean value of y.

Hopefully, now you have understood how to solve a Linear Regression problem and would apply what you have learned in this blog. You can also follow the video tutorial attached down the blog. You can expect more such informative posts if you keep on following the DexLab Analytics blog. DexLab Analytics provides data Science certification courses in gurgaon.


.

How The Industries Are Being Impacted By Data Science?

How The Industries Are Being Impacted By Data Science?

The world has finally woken up and smelled the power of data science and now we are living in a world that is being driven by data. There is no denying the fact that new technologies are coming to the fore that are born out of data-driven insight and numerous sectors are also turning towards data science techniques and tools to increase their operational efficiency.

This in turn is also pushing a demand for skilled people in various sectors who are armed with Data Science course or, Retail Analytics Courses to be able to sift through mountains of data to clean it, sort it and analyze it for uncovering valuable information. Decisions that were earlier taken often on the basis of erroneous data or, assumption can now be more accurate thanks to application of data science.

Now  let’s take a look at which sectors are benefitting the most from data science

Healthcare

The healthcare industry has adopted the data science techniques and the benefits could already be perceived. Keeping track of healthcare records is easier not just that but digging through the pile of patient data and its analysis actually helps in giving hint regarding health issues that might crop up in near future. Preventive care is now possible and also monitoring patient health is easier than ever before.

The development in the field  can also predict which medication would be suitable for a particular patient. Data analytics and data science application is also enabling the professionals in this sector to offer better diagnostic results.

Retail

This is one industry that is reaping huge benefits from the application of data science. Now sorting through the customer data, survey data it is easier to gauge the customers’ mindset. Predictive analysis is helping the experts in this field to predict the personal preference of the consumers and they are able to come up with personalized recommendations that is bound to help them retain customers.  Not just that they can also find the problem areas in their current marketing strategy to make changes accordingly.

Transport

Transport is another sector that is using data science techniques to its advantage and  in turn it is increasing its service quality. Both the public and private transportation services providers are keeping track of customer journey and getting the details necessary to develop personalized information, they are also helping people be prepared for unexpected issues and most importantly they are helping people reach their destinations without any glitch.

Data Science Machine Learning Certification

Finance

If so many industries are reaping benefits, Finance is definitely to follow suit. Dealing with  valuable data regarding banking transactions, credit history is essential. Based on the data insight it is possible to offer customers personalized financial advice. Also the credit risk issue could be minimized thanks to the insight derived from a particular customer’s credit history. It would allow the financial institute make an informed decision. However, credit risk analytics training would be required for personnel working in this field. 

Telecom

The field of telecom is surely a busy sector that has to deal with tons of valuable data. With the application of data science now they are able to find a smart solution to process the data they gather from various call records, messages, social media platforms in order to design and deliver services that are in accordance with customers’ individualistic needs.

Harnessing the power of data science is definitely going to impact all the industries in future. The data science domain is expanding and soon there would be more miracles to observe. Data Science training can help upskill the employees reduce the skill gap that is bugging most sectors.


.

What Role Does A Data Scientist Play In A Business Organization?

What Role Does A Data Scientist Play In A Business Organization?

The job of a data scientist is one that is challenging, exciting and crucial to an organization’s success.  So, it’s no surprise that there is a rush to enroll in a Data Science course, to be eligible for the job. But, while you are at it, you also need to have the awareness regarding the job responsibilities usually bestowed upon the data scientists in a business organization and you would be surprised to learn that the responsibilities of a data scientist differs from that of a data analyst or, a data engineer.

So, what is the role and responsibility of a data scientist?  Let’s take a look.

The common idea regarding a data scientist role is that they analyze huge volumes of data in order to find patterns and extract information that would help the organizations to move ahead by developing strategies accordingly. This surface level idea cannot sum up the way a data scientist navigates through the data field. The responsibilities could be broken down into segments and that would help you get the bigger picture.

Data management

The data scientist, post assuming the role, needs to be aware of the goal of the organization in order to proceed. He needs to stay aware of the top trends in the industry to guide his organization, and collect data and also decide which methods are to be used for the purpose. The most crucial part of the job is the developing the knowledge of the problems the business is trying solve and the data available that have relevance and could be used to achieve the goal. He has to collaborate with other departments such as analytics to get the job of extracting information from data.

Data analysis

Another vital responsibility of the data scientist is to assume the analytical role and build models and implement those models to solve issues that are best fit for the purpose. The data scientist has to resort to data mining, text mining techniques. Doing text mining with python course can really put you in an advantageous position when you actually get to handle complex dataset.

Developing strategies

The data scientists need to devote themselves to tasks like data cleaning, applying models, and wade through unstructured datasets to derive actionable insight in order to gauge the customer behavior, market trends. These insights help a business organization to decide its future course of action and also measure a product performance. A Data analyst training institute is the right place to pick up the skills required for performing such nuanced tasks.

Collaborating

Another vital task that a data scientist performs is collaborating with others such as stakeholders and data engineers, data analysts communicating with them in order to share their findings or, discussing certain issues. However, in order to communicate effectively the data scientists need to master the art of data visualization which they could learn while pursuing big data courses in delhi along with deep learning for computer vision course.  The key issue here is to make the presentation simple yet effective enough so that people from any background can understand it.

Data Science Machine Learning Certification

The above mentioned responsibilities of a data scientist just scratch the surface because, a data scientist’s job role cannot be limited by or, defined by a couple of tasks. The data scientist needs to be in synch with the implementation process to understand and analyze further how the data driven insight is shaping strategies and to which effect. Most importantly, they need to evaluate the current data infrastructure of the company and advise regarding future improvement. A data scientist needs to have a keen knowledge of Machine Learning Using Python, to be able to perform the complex tasks their job demands.


.

Netflix develops in own data science management tool and open sources it

Netflix develops in own data science management tool and open sources it

Netflix in December last year introduced its own python framework called Metaflow. It was developed to apply to data science with a vision to make scalability a seamless proposition. Metaflow’s biggest strength is that it makes running the pipeline (constructed as a series of steps in a graph) easily movable from a stationary machine to cloud platforms (currently only the Amazon Web Services (AWS)).

What does Metaflow really do? Well, it primarily “provides a layer of abstraction” on computing resources. What it translates to is the fact that a programmer can concentrate on writing/working code while Metaflow will handle the aspect which ensures the code runs on machines.

Metaflow manages and oversees Python data science projects addressing the entire data science workflow (from prototype to model deployment), works with various machine learning libraries and amalgamates with AWS.

Machine learning and data science projects require systems to follow and track the trajectory and development of the code, data, and models. Doing this task manually is prone to mistakes and errors. Moreover, source code management tools like Git are not at all well-suited to doing these tasks.

Metaflow provides Python Application Programming Interfaces (APIs) to the entire stack of technologies in a data science workflow, from access to the data, versioning, model training, scheduling, and model deployment, says a report.

Netflix built Metaflow to provide its own data scientists and developers with “a unified API to the infrastructure stack that is required to execute data science projects, from prototype to production,” and to “focus on the widest variety of ML use cases, many of which are small or medium-sized, which many companies face on a day to day basis”, Metaflow’s introductory documentation says.

Data Science Machine Learning Certification

Metaflow is not biased. It does not favor any one machine learning framework or data science library over another. The video-streaming giant deploys machine learning across all aspects of its business, from screenplay analysis, to optimizing production schedules and pricing. It is bent on using Python to the best limits the programming language can stretch. For the best Data Science Courses in Gurgaon or Python training institute in Delhi, you can check out the Dexlab Analytics courses online.


Interested in a career in Data Analyst?

To learn more about Data Analyst with Advanced excel course – Enrol Now.
To learn more about Data Analyst with R Course – Enrol Now.
To learn more about Big Data Course – Enrol Now.

To learn more about Machine Learning Using Python and Spark – Enrol Now.
To learn more about Data Analyst with SAS Course – Enrol Now.
To learn more about Data Analyst with Apache Spark Course – Enrol Now.
To learn more about Data Analyst with Market Risk Analytics and Modelling Course – Enrol Now.

How Students Select a Good Data Science Course?

How Students Select a Good Data Science Course

Data science and analytics are in hype. This time, we decided to know what students look for while arming themselves in this new age field of study. For that, we bring you Analytics India Magazine’s recent survey.

We are on an interesting endeavor to tap into the key areas that IT professionals and aspiring candidates look up to for lessening the learning gap. Ready to join us?

Disclaimer – the below opinions are from budding data scientists – from young IT employees to fresh graduates; we have compiled them and presented in a concise way. All thanks to AIM.

2

What key element to consider in a data science or analytics course?

For students, there are many preconceived notions about a course’s curriculum, faculty, brand name and even fellow batch mates. No wonder, it’s always tricky to focus only on a single key element.

Nevertheless, going by the survey, the respondents voted the most for course content, only to be seconded by hands-on experience. Yes, course content is the life and soul of data science and analytics training program. But, it’s not enough, it has to be supplemented by good hands-on experience and placement opportunities.

For more,

What should be the duration of the data science or analytics course?

Short-term or long-term? This is a very common question plaguing the minds of interested candidates –in the recent survey, more than 66% of respondents said they would choose short-term programme over long-term, and almost 55% said that they would prefer part-time skill-training programme than full-time.

What format would you chose for data science training courses?

Always, course curriculum should be in an easy to learn format. When the expert guys at AIM asked the respondents what kind of format do they prefer for their educational course, this is what they revealed:

  • 47% or more voted for a hybrid format of education
  • 28% said they prefer online learning method
  • Less than 25% of the candidates said they would like to stick to the old-school classroom method of teaching

What about Capstone Projects and Placements?

Capstone Projects are important. 92% of respondents vouched for that.

Another 57% said that placements are crucial too if you are thinking of making a mark in the competitive tech industry. Up-skilling is the key in today’s world.

When is the best time to opt for a data science course?

There’s nothing like the best time to enroll in a data science and analytics course. Anytime, you can start learning. However, the 43% of respondents believe that it’s better to take up business analyst training course right after graduation or post graduation.

On the other hand, 33% think that gaining some work experience prior to start training would be helpful.

For more such updates, watch this space.

If you are looking for a decent data analyst training institute in Gurgaon, DexLab Analytics fits the bill right. Drop by their site and gather information.


Interested in a career in Data Analyst?

To learn more about Data Analyst with Advanced excel course – Enrol Now.
To learn more about Data Analyst with R Course – Enrol Now.
To learn more about Big Data Course – Enrol Now.

To learn more about Machine Learning Using Python and Spark – Enrol Now.
To learn more about Data Analyst with SAS Course – Enrol Now.
To learn more about Data Analyst with Apache Spark Course – Enrol Now.
To learn more about Data Analyst with Market Risk Analytics and Modelling Course – Enrol Now.

Explaining the Job Nitty Gritty of a Data Scientist

Explaining the Job Nitty Gritty of a Data Scientist

What do data scientists do? Since the inception of the term data science, we’ve heard about how it transforms all major sectors, including retail, agriculture, health, legal, telecommunications and automobile industry, but little do we know what exactly the job entails.

Following a recent DataCamp podcast DataFramed, we found out a set of key things about data scientists, and they are as follows:

2

Not only tech, but other industries are being explored

A prominent data scientist from Convoy shared insights about how their company is leveraging data science to revolutionize North American trucking industry. Then again, data science is also deemed to make a significant impact on cancer research. So, from this we can understand that data science is not only limited within the walls of technology but has started to seep through different industry verticals.

via GIPHY

It’s beyond AI and self-driving cars

Sure, deep learning and machine learning are powerful applications, but not all data scientists are lost waddling around these top notch techniques. Instead, most of the regular data scientists earn their daily bread and butter through data accumulation and cleaning, creating reports and dashboards, data viz, statistical inference, communicating and convincing decision-makers about key outcomes.

Skill evolution

“Which skill is more important for a data scientist: the ability to use the most sophisticated deep learning models, or the ability to make good PowerPoint slides?” – The latter is crucial, so is communicating results.

However, these skills are likely to change very quickly. In a very short span of time. Rapid development across diverse open-source ecosystem is evident; as a result any kind of skill or expertise is unlikely to last long.

For quick Data Science Certification, drop by DexLab Analytics.

Specialization is the key

It’s better to break down data science into three main components: Business Intelligence, which talks about pulling out data and presenting it to the right people in the form of reports, dashboards and mails; Decision Science, which is all about gathering company data and analyzing it for decision-making; and Machine Learning, which deals with the ways in which we can use data science models and put them into production.

Choosing a distinct career path is an emerging trend and it’s gaining a lot of popularity for all the right reasons.

Ethics is a driving factor

No wonder, this profession is full of uncertainty; at a time, when most of our daily interactions are influenced by algorithms designed by data scientists, what role do you think ethics play? On this context, this is what Omuji Miller, the senior machine learning data scientist at GitHub has to say:

‘We need to have that ethical understanding, we need to have that training, and we need to have something akin to a Hippocratic oath. And we need to actually have proper licenses so that if you actually do something unethical, perhaps you have some kind of penalty, or disbarment, or some kind of recourse, something to say this is not what we want to do as an industry, and then figure out ways to remediate people who go off the rails and do things because people just aren’t trained and they don’t know.’

Soon, we’re approaching a state where the need to maintain ethical standards would come from within data science itself and advocates, legislators and other stakeholders. Hope this consensus comes soon.

The data science revolution is quite the order of the day, and it’s going to stay for a while. So, if you want to ace up your data skills, we’ve superior Data Science Courses in Delhi. Just, visit our website and pore over our course offerings.


The blog has been sourced from — hbr.org/2018/08/what-data-scientists-really-do-according-to-35-data-scientists


Interested in a career in Data Analyst?

To learn more about Data Analyst with Advanced excel course – Enrol Now.
To learn more about Data Analyst with R Course – Enrol Now.
To learn more about Big Data Course – Enrol Now.

To learn more about Machine Learning Using Python and Spark – Enrol Now.
To learn more about Data Analyst with SAS Course – Enrol Now.
To learn more about Data Analyst with Apache Spark Course – Enrol Now.
To learn more about Data Analyst with Market Risk Analytics and Modelling Course – Enrol Now.

How Aspiring Data Scientists Should Choose a Suitable Programming Language for Data Science

How Aspiring Data Scientists Should Choose a Suitable Programming Language for Data Science

Data science is a fascinating and one of the fastest growing fields in the world to work in. This is why it’s becoming increasingly popular for data scientists to consider the potentials of programming languages-they form an integral part of data science.

Possessing incredible skills of programming instantly pumps up the chances of bagging a high-profile data science job, whereas the novices, who have never studied programming in their entire life have to struggle hard.

However, this is not all – only a sack of all-round programming skills won’t help you grab the sexiest job of 21st century, there are several things to consider before you set off on becoming a successful data scientist. And they are as follows:

Generality

For a true blue data scientist, it’s not enough to possess encompassing programming skills but also the aptitude for crunching numbers. Remember, a data scientist’s day is largely spent on sourcing and processing raw data for the purpose of data cleaning – no amount of smart set of programming languages or machine learning models would be of any help.

2

Specificity

In advanced data science, learning knows no bounds – each time you get to reinvent something new. Learn to ace a wide array of packages and modules available in a chosen language. However, the extent of the use and application is subject to the domain-particular packages you are working on.

Performance

In few cases, optimizing the performance of the codes is essential, especially when tackling huge volumes of crucial data. Compiled languages are normally faster as compared to interpreted ones; in the same way, statically typed languages are more fail-proof than dynamically typed. As a result, an apparent trade-off exists against productivity.

With all these in mind, it’s time to delve into the most popular languages used in the field of data science – let’s start with R – it’s the most powerful open source language used for a gamut of statistical and data visualization applications, including neural networks, advanced plotting, non-linear regression, phylogenetics and lot more.

Next, we can’t help but brag about an excellent all-rounder – Python – a top notch programming language choice for all types of data scientists, seasoned and freshers. A large chunk of the data science process revolves around the cutting edge ETL process – this makes Python a universal language to excel at. Google’s Tensorflow is an added bonus point.

Lastly, SQL tops rank as a leading data processing language instead of being just an advanced analytical tool. Owing to its longevity and efficiency, SQL is deemed to be one of the most powerful weapons that modern data scientist should know of.

Parting Thoughts

In the end of the discussion, we now have a set of languages to consider for excelling data science – what you need to do is comprehend your usage requirements and compare generality, specificity and performance factors. This will help you surge towards a successful career minus the complexities associated.

DexLab Analytics offers top of the line Data Science Courses in Delhi for data enthusiasts. If you are interested in a data analyst course in Noida, drop by this esteemed institute and navigate through our in-demand courses.


The blog has been sourced from – 

https://medium.freecodecamp.org/which-languages-should-you-learn-for-data-science-e806ba55a81f

https://towardsdatascience.com/what-programming-language-should-aspiring-data-scientists-learn-875017ad27e0

http://bigdata-madesimple.com/how-i-chose-the-right-programming-language-for-data-science


Interested in a career in Data Analyst?

To learn more about Data Analyst with Advanced excel course – Enrol Now.
To learn more about Data Analyst with R Course – Enrol Now.
To learn more about Big Data Course – Enrol Now.

To learn more about Machine Learning Using Python and Spark – Enrol Now.
To learn more about Data Analyst with SAS Course – Enrol Now.
To learn more about Data Analyst with Apache Spark Course – Enrol Now.
To learn more about Data Analyst with Market Risk Analytics and Modelling Course – Enrol Now.

Call us to know more