data science Archives - Page 6 of 11 - DexLab Analytics | Big Data Hadoop SAS R Analytics Predictive Modeling & Excel VBA

How Students Select a Good Data Science Course?

How Students Select a Good Data Science Course

Data science and analytics are in hype. This time, we decided to know what students look for while arming themselves in this new age field of study. For that, we bring you Analytics India Magazine’s recent survey.

We are on an interesting endeavor to tap into the key areas that IT professionals and aspiring candidates look up to for lessening the learning gap. Ready to join us?

Disclaimer – the below opinions are from budding data scientists – from young IT employees to fresh graduates; we have compiled them and presented in a concise way. All thanks to AIM.

2

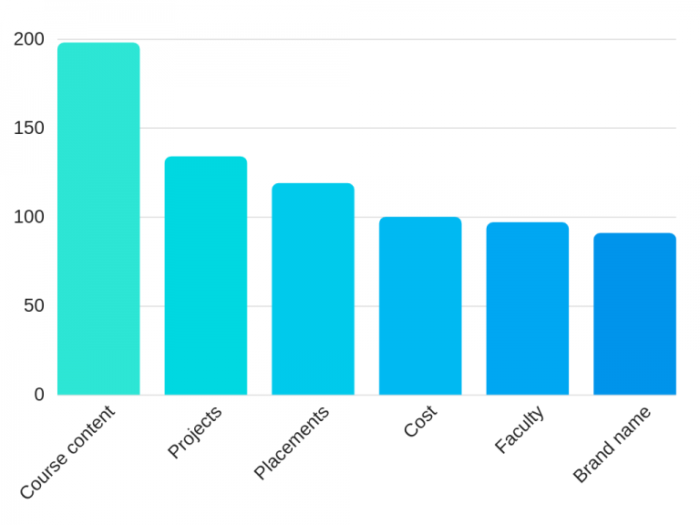
What key element to consider in a data science or analytics course?

For students, there are many preconceived notions about a course’s curriculum, faculty, brand name and even fellow batch mates. No wonder, it’s always tricky to focus only on a single key element.

Nevertheless, going by the survey, the respondents voted the most for course content, only to be seconded by hands-on experience. Yes, course content is the life and soul of data science and analytics training program. But, it’s not enough, it has to be supplemented by good hands-on experience and placement opportunities.

For more,

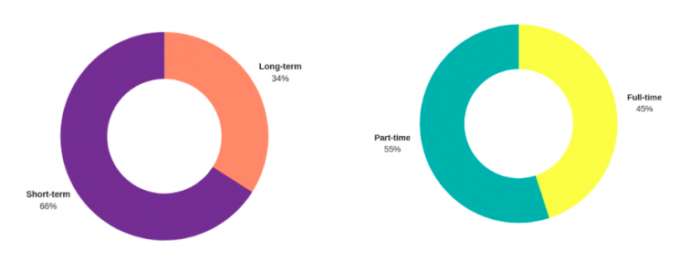
What should be the duration of the data science or analytics course?

Short-term or long-term? This is a very common question plaguing the minds of interested candidates –in the recent survey, more than 66% of respondents said they would choose short-term programme over long-term, and almost 55% said that they would prefer part-time skill-training programme than full-time.

What format would you chose for data science training courses?

Always, course curriculum should be in an easy to learn format. When the expert guys at AIM asked the respondents what kind of format do they prefer for their educational course, this is what they revealed:

  • 47% or more voted for a hybrid format of education
  • 28% said they prefer online learning method
  • Less than 25% of the candidates said they would like to stick to the old-school classroom method of teaching

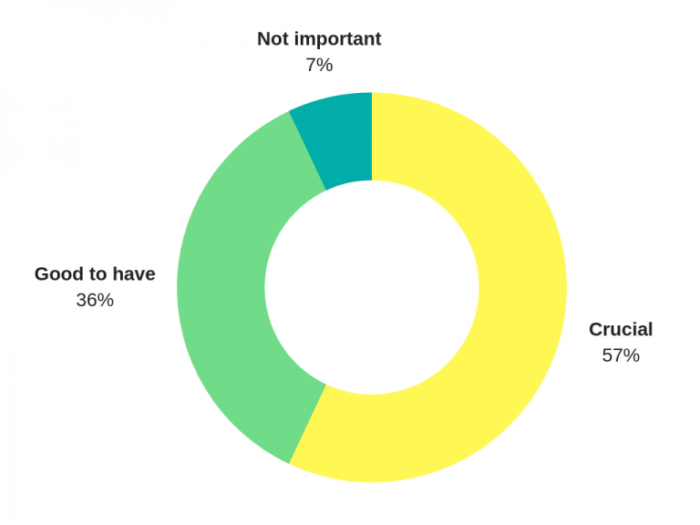
What about Capstone Projects and Placements?

Capstone Projects are important. 92% of respondents vouched for that.

Another 57% said that placements are crucial too if you are thinking of making a mark in the competitive tech industry. Up-skilling is the key in today’s world.

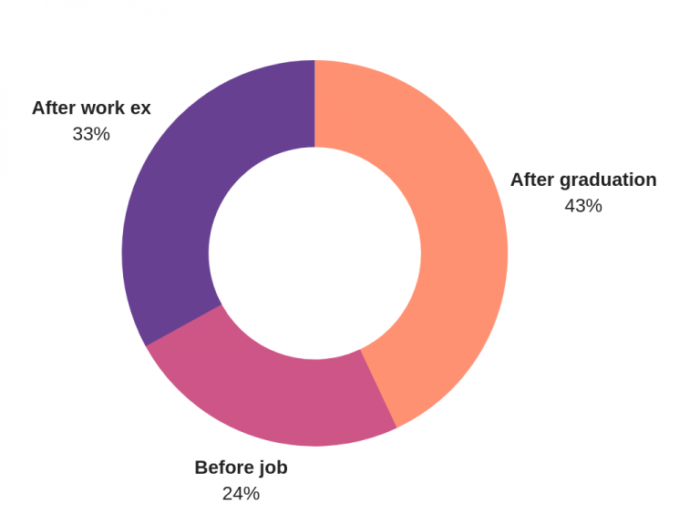
When is the best time to opt for a data science course?

There’s nothing like the best time to enroll in a data science and analytics course. Anytime, you can start learning. However, the 43% of respondents believe that it’s better to take up business analyst training course right after graduation or post graduation.

On the other hand, 33% think that gaining some work experience prior to start training would be helpful.

For more such updates, watch this space.

If you are looking for a decent data analyst training institute in Gurgaon, DexLab Analytics fits the bill right. Drop by their site and gather information.


Interested in a career in Data Analyst?

To learn more about Data Analyst with Advanced excel course – Enrol Now.
To learn more about Data Analyst with R Course – Enrol Now.
To learn more about Big Data Course – Enrol Now.

To learn more about Machine Learning Using Python and Spark – Enrol Now.
To learn more about Data Analyst with SAS Course – Enrol Now.
To learn more about Data Analyst with Apache Spark Course – Enrol Now.
To learn more about Data Analyst with Market Risk Analytics and Modelling Course – Enrol Now.

5 Big Challenges That Data Scientists Face Each Day

5 Big Challenges That Data Scientists Face Each Day

Data is lucrative; the world is revolving around how we churn out data. As a result, there’s been a high demand for data scientists. But of course, as rightfully said there’s no gain without pain – the promising field of data science is laden with many challenges, which needs to be overcome by expert consultants under needful guidance and with deft expertise.

Below, we’ve mentioned top 5 data science challenges, and how to handle them well…

Address the Specifics

Successful data scientists don’t try to do everything on their own. Instead, they individually focus on a single specific area. “I would encourage new professionals to understand that data science is a bit like medicine—it’s a vast and vague term that encapsulates wildly different practices under one roof,” said Tal Kedar, CTO at Optimove. “Data scientists [can have] very different engineering skill sets [and be] experienced with very different platforms and tools.”

For data science certification, look no further. DexLab Analytics is a prime data science training institute catering to the needs of enthusiast students. 

2

Be Guided By Your Intuition

Being a data scientist not only exposes you to the question of ‘how’, but also ‘why’. No longer do you just sift through data to make connections, instead you have to use your comprehensive knowledge to develop ‘mental model’, which can be accepted or rejected by your data.

Cross-Department Expertise is Appreciable

“The best data scientists are not just statisticians or machine learning experts; they are also an authority in the field or business where they are applying those skills,” said Kedar. It’s no hard fact, data scientists are arguably the best bridge between technical and non-technical teams. Quite naturally, whichever career they chose next, their skills will be treated as an asset to the next company in question.

Seamless Flow of Communication

Communication amongst the data teams is crucial – data scientists need to explain technical concepts to audiences from other departments, including executives and stakeholders, who might not belong from technical backgrounds. “It can be exciting to share all of the technical complexities that got you to your conclusions,” said Andrew Seitz, senior data analyst at Snowflake. “But what your stakeholders need are the key findings and action items. Save the details for the appendix (or Q&A).”

Raw Data Play

The biggest challenge for data scientists is to find ways of using the data – how the process of data extraction, data cleaning, data analysis and data modeling are carried out. Data scientists need to possess broad domain expertise in all programming languages, such as Python, R and SQL.

The work life of a data scientist revolves around creating clean data sets loaded with useful information on which machine learning algorithms can be applied. This kind of job is mostly treated as an art instead of science, because a majority of hard work and effort goes unnoticed when observing the final product, just like an artist’s craft.

The scope and capability of data science is encompassing, so are the challenges. But, of course, most of the challenges can be mitigated with considerable preparation and communication. How? With an intensive Python data science course – from the expert consultants of DexLab Analytics.


The blog has been sourced fromwww.forbes.com/sites/laurencebradford/2018/09/06/8-real-challenges-data-scientists-face/#8adbc206d999


Interested in a career in Data Analyst?

To learn more about Data Analyst with Advanced excel course – Enrol Now.
To learn more about Data Analyst with R Course – Enrol Now.
To learn more about Big Data Course – Enrol Now.

To learn more about Machine Learning Using Python and Spark – Enrol Now.
To learn more about Data Analyst with SAS Course – Enrol Now.
To learn more about Data Analyst with Apache Spark Course – Enrol Now.
To learn more about Data Analyst with Market Risk Analytics and Modelling Course – Enrol Now.

Explaining the Job Nitty Gritty of a Data Scientist

Explaining the Job Nitty Gritty of a Data Scientist

What do data scientists do? Since the inception of the term data science, we’ve heard about how it transforms all major sectors, including retail, agriculture, health, legal, telecommunications and automobile industry, but little do we know what exactly the job entails.

Following a recent DataCamp podcast DataFramed, we found out a set of key things about data scientists, and they are as follows:

2

Not only tech, but other industries are being explored

A prominent data scientist from Convoy shared insights about how their company is leveraging data science to revolutionize North American trucking industry. Then again, data science is also deemed to make a significant impact on cancer research. So, from this we can understand that data science is not only limited within the walls of technology but has started to seep through different industry verticals.

via GIPHY

It’s beyond AI and self-driving cars

Sure, deep learning and machine learning are powerful applications, but not all data scientists are lost waddling around these top notch techniques. Instead, most of the regular data scientists earn their daily bread and butter through data accumulation and cleaning, creating reports and dashboards, data viz, statistical inference, communicating and convincing decision-makers about key outcomes.

Skill evolution

“Which skill is more important for a data scientist: the ability to use the most sophisticated deep learning models, or the ability to make good PowerPoint slides?” – The latter is crucial, so is communicating results.

However, these skills are likely to change very quickly. In a very short span of time. Rapid development across diverse open-source ecosystem is evident; as a result any kind of skill or expertise is unlikely to last long.

For quick Data Science Certification, drop by DexLab Analytics.

Specialization is the key

It’s better to break down data science into three main components: Business Intelligence, which talks about pulling out data and presenting it to the right people in the form of reports, dashboards and mails; Decision Science, which is all about gathering company data and analyzing it for decision-making; and Machine Learning, which deals with the ways in which we can use data science models and put them into production.

Choosing a distinct career path is an emerging trend and it’s gaining a lot of popularity for all the right reasons.

Ethics is a driving factor

No wonder, this profession is full of uncertainty; at a time, when most of our daily interactions are influenced by algorithms designed by data scientists, what role do you think ethics play? On this context, this is what Omuji Miller, the senior machine learning data scientist at GitHub has to say:

‘We need to have that ethical understanding, we need to have that training, and we need to have something akin to a Hippocratic oath. And we need to actually have proper licenses so that if you actually do something unethical, perhaps you have some kind of penalty, or disbarment, or some kind of recourse, something to say this is not what we want to do as an industry, and then figure out ways to remediate people who go off the rails and do things because people just aren’t trained and they don’t know.’

Soon, we’re approaching a state where the need to maintain ethical standards would come from within data science itself and advocates, legislators and other stakeholders. Hope this consensus comes soon.

The data science revolution is quite the order of the day, and it’s going to stay for a while. So, if you want to ace up your data skills, we’ve superior Data Science Courses in Delhi. Just, visit our website and pore over our course offerings.


The blog has been sourced from — hbr.org/2018/08/what-data-scientists-really-do-according-to-35-data-scientists


Interested in a career in Data Analyst?

To learn more about Data Analyst with Advanced excel course – Enrol Now.
To learn more about Data Analyst with R Course – Enrol Now.
To learn more about Big Data Course – Enrol Now.

To learn more about Machine Learning Using Python and Spark – Enrol Now.
To learn more about Data Analyst with SAS Course – Enrol Now.
To learn more about Data Analyst with Apache Spark Course – Enrol Now.
To learn more about Data Analyst with Market Risk Analytics and Modelling Course – Enrol Now.

Fundamental Concepts of Statistics for Data Science Beginners- Part One

Fundamental Concepts of Statistics for Data Science Beginners- Part One

Do you aspire to be a data scientist? Then is it essential that you have a solid understanding of the core concepts of statistics. Everyone doesn’t have a Ph.D. in Statistics. And that isn’t the only way to excel in the field of data science. But yes, knowing stats well is a prerequisite for data science.

Nowadays, popularly used libraries, like Tesorflow, liberate the user from the intricacies of complex mathematics. Still, it is advisable to be familiar with the fundamental principles on which they work, because that will enable you to use the libraries better.

In this blog, we attempt to shed light on some basic concepts, theorems and equations of statistics for data science.

Statistical Distributions:

Statistical distributions are important tools that you must arm yourself with to be a skilled data scientist. Here, we shall talk about two important distributions, namely Poisson distribution and Binomial distribution.

Poisson distribution:
This distribution is used to find out the number of events that are expected to occur during an interval of time. For example, the number of page views in one second, the number of phone calls in a particular period of time, number of sales per hour, etc.

The symbols used in the equation are:

x: exact number of successes

e: constant equal to 2.71828 approximately

λ: average number of successes per time interval

Poisson distribution is used for calculating losses in manufacturing. Let us consider that a machine generates metal sheets that have ‘x’ flaws per yard. Suppose the error rate is 2 per yard of sheet (λ). Applying this information to Poisson distribution, we can calculate the probability of having exactly two errors in a yard.

Source: Brilliant.org

Poisson distribution is used for faster detection of anomalies.

Binomial distribution:

This is a very common distribution in Statistics. Suppose you have flipped a coin thrice. Using basic combinatorics for flipping a coin thrice, we see that there are eight combinations possible. We find out the probabilities of getting 0, 1, 2 or 3 heads and plot this on a graph. This gives us the binomial distribution for this particular problem. It must be remembered that Binomial distribution curve is similar to a Normal distribution Curve. Normal distribution is used when values are continuous and Binomial distribution is used for discrete values.

Source: mathnstuff.com

Binomial distribution is a discrete probability distribution where number of trials is predetermined and there are two possible outcomes– success and failure, win or lose, gain or loss. Depending on a few conditions, like the total number of trails is large, the probability of success is near 1 and the probability of failure is near 0, the trails are independent and identical, etc., the binomial distribution is approximated to a normal distribution.

Source: MathBitsNotebook

Binomial distribution has many applications in business. For example, it is estimated that 5% of tax returns for individuals with high net worth in USA is fraudulent. These frauds might be uncovered through audits. Binomial distribution is used to find out for ‘n’ number of tax returns that are audited, what is the probability for say 5 fraudulent returns to be uncovered.

There are some more probability distributions, like Bernoulli and Geometric distributions. We shall cover that and more in the following blogs. So, stay tuned and follow DexLab Analytics. The experts here offer top-quality data science courses in Delhi. Go through the data science certification details right now!


References:

upgrad.com/blog/basics-of-statistics-for-data-science

anomaly.io/anomaly-detection-poisson-distribution

analyticsvidhya.com/blog/2017/09/6-probability-distributions-data-science


Interested in a career in Data Analyst?

To learn more about Data Analyst with Advanced excel course – Enrol Now.
To learn more about Data Analyst with R Course – Enrol Now.
To learn more about Big Data Course – Enrol Now.

To learn more about Machine Learning Using Python and Spark – Enrol Now.
To learn more about Data Analyst with SAS Course – Enrol Now.
To learn more about Data Analyst with Apache Spark Course – Enrol Now.
To learn more about Data Analyst with Market Risk Analytics and Modelling Course – Enrol Now.

Business Intelligence: How to Enhance User Adoption?

Business Intelligence: How to Enhance User Adoption?

For business modernization, smart business intelligence solution is the key. Getting to the crux and leveraging vast pools of data that companies gain access to triggers encompassing digital transformation. BI tools not only let companies grasp the data but also develop actionable insights to smoothen the impactful decision-making capabilities and take companies towards future progress.

It’s not an out of ordinary kind of concept, for half a decade, companies have been utilizing these kinds of tools for better efficiency and productive outcomes, yet user adoption for BI tool remains relatively low.

2

Reasons behind Lower User Adoption of Business Intelligence:

Guys at the helm of company affairs, including Chief Information Officers, Chief Technology Officers and Chief Data Officers may think it’s high time to incorporate Business Intelligence tools for smarter operations, but it may not have the same effect on the employees. Employees may not be much inspired!

It holds truer, especially for those employees, who have been in the workforce for long and haven’t for once used such intricate, new-age tools to decipher what data says. For them, old is gold – they prefer to continue their own kind of data analysis in the same way they have been doing for so many years.

How Companies Can Improve Data-Driven Mindsets?

In order to be ahead of the curve, the data mindset of the workforce needs to be changed. If businesses have to be completely data-driven, they can’t just take Business Intelligence lightly.

Here are a few ways business can drive user adoption of BI:

Introduce BI as a necessity, not luxury

Once understanding company data was considered as an added advantage to normal work procedures. But, in this age of digital transformation, it’s no longer a luxury but a necessity. And sooner the employees realize this, the better it becomes.

Employees across organizations should have thorough access to data. It boosts decision-making. By going completely data-driven, business intelligence user adoption will automatically improve. Along with employees, businesses too will benefit a lot from such adoption.

Promote Favorable Impacts of BI

Putting light on success stories of BI implementation helps! It’s being regarded as a powerful way to encourage budding data scientists and already in-workforce employees: the powerful impression of BI and its significant impacts on key performance indicators will tell a different story to the world.

The best way of doing it would be by developing an internal case study that will elucidate how a team after incorporating Business Intelligence fulfilled their desired organizational goals. For best results, let a manager or C-level employee present the case study to the workforce. Surely, this will enhance levels of user adoption of BI.

Continuous Training is a Must

Business Intelligence calls for no one-track solutions; the concept deals with almost endless opportunities, which means continuous training initiatives should be taken up to explore every facet of this cutting edge tool.

When an employee have deeper knowledge about a particular tool, they are more likely to derive maximum benefits out of it. So, by giving continuous training, through various FAQs, webinars and video tutorials, employees can now become very easily completely data-driven.

Now, following these easy yet effective tips, business leaders can increase their lower rates of BI adoption and stride towards full digital transformation of their companies, triggering impactful future goals.

Want to know more about Data Science Courses in Noida? Drop by DexLab Analytics; for a fulfilling learning experience, opt for their Data Science Courses. They are simply excellent and student-friendly. 

 
The blog has been sourced from — www.sisense.com/blog/make-business-intelligence-necessity-drive-user-adoption
 

Interested in a career in Data Analyst?

To learn more about Data Analyst with Advanced excel course – Enrol Now.
To learn more about Data Analyst with R Course – Enrol Now.
To learn more about Big Data Course – Enrol Now.

To learn more about Machine Learning Using Python and Spark – Enrol Now.
To learn more about Data Analyst with SAS Course – Enrol Now.
To learn more about Data Analyst with Apache Spark Course – Enrol Now.
To learn more about Data Analyst with Market Risk Analytics and Modelling Course – Enrol Now.

An ABC Guide to Sampling Theory

An ABC Guide to Sampling Theory

Sampling theory is a study involving collection, analysis and interpretation of data accumulated from random samples of a population. It’s a separate branch of statistics that observes the relationship existing between a population and samples drawn from the population.

In simple terms, sampling means the procedure of drawing a sample out of a population. It aids us to draw a conclusion about the characteristics of the population after carefully studying only the objects present in the sample.

Here we’ve whisked out a few sampling-related terms and their definitions that would help you understand the nuanced notion of sampling better. Let’s have a look:

Sample – It’s the finite representative subset of a population. It’s chosen from a population with an aim to scrutiny its properties and principles.

Population – When a statistical investigation focuses on the study of numerous characteristics involving items on individuals associated with a particular group, this group under study is known as the population or the universe. A group containing a finite number of objects is known as finite population, while a group with infinite or large number of objects is called infinite population.

Population parameter – It’s an obscure numerical factor of the population. It’s no brainer that the primary objective of a survey is to find the values of different measures of population distribution; and the parameters are nothing but a functional variant inclusive of all population units.

2

Estimator – Calculated based on sample values, an estimator is a functional measure.

Sampling fluctuation of an estimator – When you draw a particular sample from a given population, it contains different set of population members. As a result, the value of the estimator varies from one sample to another. This difference in values of the estimator is known as the sampling fluctuations of an estimator.

Next, we would like to discuss about the types of sampling:

There are mainly two types of random sampling, and they are as follows:

Simple Random Sampling with Replacement

In the first case, the ‘n’ units of the sample are drawn from the population in such a way that at each drawing, each of the ‘n’ numbers of the population gets the same probability 1⁄N of being selected. Hence, this methods is called the simple random sampling with replacement, clearly, the same unit of population may occur more than once inj a simple. Hence, there are N^n samples, regard being to the orders in which ‘n’ sample unit occur and each such sample has the probability 1/N^n .

Simple Random Sampling Without Replacement

In the second case each of the ‘n’ members of the sample are drawn one by one but the members once drawn are not returned back to the population and at each stage remaining amount of the population is given the same probability of being includes in the sample. This method of drawing the sample is called SRSWOR therefore under SRSWOR at any r^th number of draw there remains (N-r+1) units. And each unit has the probability of 1/((N-r+1) ) of being drawn.

Remember, if we take ‘n’ individuals at once from a given population giving equal probability to each of the observations, then the total number of possible example in (_n^N)C i.e.., combination of ‘n’ members out of ‘N’ numbers of the population will from the total no. of possible sample in SRSWOR.

The world of statistics is huge and intensively challenging. And so is sampling theory.

But, fret now. Our data science courses in Noida will help you understand the nuances of this branch of statistics. For more, visit our official site.  

P.S: This is our first blog of the series ‘sampling theory’. The rest will follow soon. Stay tuned.


Interested in a career in Data Analyst?

To learn more about Data Analyst with Advanced excel course – Enrol Now.
To learn more about Data Analyst with R Course – Enrol Now.
To learn more about Big Data Course – Enrol Now.

To learn more about Machine Learning Using Python and Spark – Enrol Now.
To learn more about Data Analyst with SAS Course – Enrol Now.
To learn more about Data Analyst with Apache Spark Course – Enrol Now.
To learn more about Data Analyst with Market Risk Analytics and Modelling Course – Enrol Now.

Here’s How Technology Made Education More Enjoyable and Interactive

Here’s How Technology Made Education More Enjoyable and Interactive

Technology is revamping education. The entire education system has undergone a massive change, thanks to technological advancement. The institutions are setting new goals and achieving their targets more effectively with the help of new tools and practices. These cutting edge methods not only enhances the learning approach, but also results in better interaction and fuller participation between teachers and students.

The tools of technology have turned students into active learners; they are now more engaged with their subjects. In fact, they even discover solutions to the problems on their own. The traditional lectures are now mixed with engaging illustrations and demonstrations, and classrooms are replaced with interactive sessions in which students and teachers both participate equally.

Let’s take a look at how technology has changed the classroom learning experience:

Online Classes

No longer, students have to sit through a classroom all day. If a student is interested in a particular course or subject, he or she can easily pursue degrees online without going anywhere. The internet has made interactions between students and teachers extremely easy. From the comfort of the home, anyone can learn anything.

DexLab Analytics offers Data Science Courses in Noida. Their online and classroom training is over the top.

Free educational resources found online

The internet is full of information. From a vast array of blogs, website content and applications, students as well as teachers can learn anything they desire to. Online study materials coupled with classroom learning help the students in strengthening their base on any subject as they get to learn concepts from different sources with examples and practice enough problems. This explains why students are so crazy for the internet!

2

Webinars and video streaming

The facilitators and educationists are nowadays looking up to video streaming to communicate ideas and knowledge to the students. Videos are anytime more helpful than other digital communications; they help deliver the needful content, boosting the learning abilities among the learners, while making them understand the subject matter to the core. Webinars (seminars over the web) replaces classroom seminars; teachers look up to new methods of video conferencing for smoother interaction with the students.

Podcasts

Podcasts are digital audio files. Users can easily download them. They are available over the internet for a bare subscription fee. It’s no big deal to create podcasts. Teachers can easily create podcasts that syncs well with students’ demand, thus paving a way for them to learn more efficiently. In short, podcasts allow students a certain flexibility to learn from anywhere, anytime.

Laptops, smartphones and tablets

For a better learning experience overall, both students and teachers are looking forward to better software and technology facilities. A wide number of web and mobile applications are now available for students to explore the wide horizon of education. The conventional paper notes are now replaced with e-notes that are uploaded on the internet and can be accessible from anywhere. Laptops and tablets are also used to manage course materials, research, schedules and presentations.

No second thoughts, by integrating technology with classroom training, students and teachers have an entire world to themselves. Sans the geographical limitations, they can now explore the bounties of new learning methods that are more fun and highly interactive.

DexLab Analytics appreciates the power of technology, and in accordance, have curated state of the art Data Science Courses that can be accessed both online and offline for students’ benefit. Check out the courses NOW!


The article has been sourced from – http://www.iamwire.com/2017/08/technology-teaching-education/156418


Interested in a career in Data Analyst?

To learn more about Data Analyst with Advanced excel course – Enrol Now.
To learn more about Data Analyst with R Course – Enrol Now.
To learn more about Big Data Course – Enrol Now.

To learn more about Machine Learning Using Python and Spark – Enrol Now.
To learn more about Data Analyst with SAS Course – Enrol Now.
To learn more about Data Analyst with Apache Spark Course – Enrol Now.
To learn more about Data Analyst with Market Risk Analytics and Modelling Course – Enrol Now.

How American Express Uses Data Analytics to Promote a Data-Driven Culture

data analytics training institute

Since 2010, American Express, with an encompassing database crossing over 100 million credit cards accounting for more than $ 1 trillion in charge volume annually, is harnessing the power of big data. Undeniably, it resulted in incredible improvements in speed and performance.

In the last four decades, the entire financial services industry has undergone a massive change, notably in the spheres of:

Electronic payments – Online payments, comprising credit and debit cards have dramatically increased over cash, globally.

E-commerce – An excessive reliance on smartphones and internet have boosted E-commerce capabilities manifold times.

With an increasing interaction between company and customers, the latter’s online and offline identity is being collaborated for an encompassing 360-degree view. This eventually drives innovation in product designing and marketing.

Formulating a Data-Driven Culture

Data analytics is like the bull’s eye of effective marketing, and servicing and risk management. Data curation and management is now a prerequisite for competitive excellence.

Since its inception, American Express flaunts transformation: the company has transformed itself from being a trivial freight forwarding business to a top notch player in payments and customized service industry. Over the years, the working mechanism of the firm has changed dramatically, and today, it is #1 small business card issuer in the whole of the US.

No matter, while the company strives to evolve, its core values remain somewhat same. Keeping their customers above anything else and behave like a good citizen are two core values of American Express that are beyond alterations. To become a successful data-driven organization, they believe in investing on technology, analytics, along with human talent, emphasizing on a proper synthesis between technology and human cognition to trigger robust growth and future success.

How American Express Stays Relevant and Fresh?

Risk 2020 – American Express envisions how an economy or marketplace might look like after a few years, and in the process, assesses the risks to combat to address the weaker issues in the economy. A comprehensive approach, including cloud, deep learning, mobile computing and AI is the solution.

Cornerstone – This is an encompassing, global big data ecosystem. The data is stored and shared with global potentialities across trusted sources. In any organization, data is the centre of attraction, and the consultants at American Express recognize the essence of innovation lies at company’s DNA and not somewhere on the top.

The data-driven culture in American Express is simple, natural and nuanced. A huge data base is created, from acquisition to customer management, which eventually needs to be shared with third parties and partners to derive insightful conclusions for better customer experience and risk assessment. “At American Express, we take our responsibility to serve customers and the public seriously, always ensuring that solutions are best-in-class and valuable to our customers,” says Ash Gupta, president, Global Credit Risk & Information Management, American Express.

“American Express’ closed-loop data allows us to analyze a large volume of real spending that can help marketers across a range of industries connect with customers and provide unique value,” he further adds.

Data Science Machine Learning Certification

To know more about data-driven customer experience, visit DexLab Analytics, a premier data analyst training institute in Delhi. They offer a plethora of data analyst training courses for interested candidates.


The blog has been sourced from:

https://www.forbes.com/sites/ciocentral/2018/03/15/how-american-express-excels-as-a-data-driven-culture/#5c5ed1a81635

https://digit.hbs.org/submission/american-express-using-data-analytics-to-redefine-traditional-banking/


Interested in a career in Data Analyst?

To learn more about Data Analyst with Advanced excel course – Enrol Now.
To learn more about Data Analyst with R Course – Enrol Now.
To learn more about Big Data Course – Enrol Now.

To learn more about Machine Learning Using Python and Spark – Enrol Now.
To learn more about Data Analyst with SAS Course – Enrol Now.
To learn more about Data Analyst with Apache Spark Course – Enrol Now.
To learn more about Data Analyst with Market Risk Analytics and Modelling Course – Enrol Now.

5 Best Data Science Resources to Ace the Game of Data

Wondering how a data scientist makes advances in his data career? Or how does he expand his skills in the future? Reading is the most common answer; nothing helps better than keeping a close eye on the industry news. Data science is evolving at a rapid speed; to be updated with the latest innovations and technology discoveries would be the best thing to stay ahead of the curve.

5 Best Data Science Resources to Ace the Game of Data

If you are a newbie in this field, make sure you are well-read about the current industry trends and articulate it well to the HR heads that you are someone who is always a step ahead to consume knowledge about data science and its related fields. This helps!

A wide number of data science blogs and articles are available over the internet, but with so many options, it’s easy to feel lost. For this and more, we have compiled a comprehensive list of 5 best data science blog recommendations that would help aspiring data scientists maneuver smoothly through this sphere.

Data Elixir

For a one stop destination for all things DATA, Data Elixir is the right choice. Crafted by ex-NASA data scientist Lon Riesberg, Data Elixir offers a list-wise view of the posts; easy categorization of content is anytime preferable and renders easy search options.

Data Science Weekly

The brain child of Hannah Brooks and Sebastian Gutierrez, Data Science Weekly is the ultimate hub for recent news, well-curated articles and promising jobs related to data science. You can either sign up for their newsletter or simply scroll through their archives dated back to 2013.

The Analytics Dispatch

The Analytics Dispatch is more like a newsletter content creating hub, wherein they send weekly emails about data science related stuff to its readers. Collected, analyzed and developed by a robust team at Mode Analytics, which also happens to be an Udacity partner, the newsletters focus on practical advices on data analysis and how data scientists should work.

Let’s Take Your Data Dreams to the Next Level

O’Reilly Media’s data science blog

To read some of the most amazing articles on AI and data science, make O’Reilly Media’s data science blog your best companion. The articles are curated, researched and written by influencers and data science pundits, who are technically sound and understands the advanced nuances of the field in-depth.

Cloudera

Being top notch big data software, Cloudera’s contribution to the world of data science is immense. Time to time, it publishes interesting articles, know-hows and guides on a plethora of open source big data software, like Hadoop, Flume, Apache, Kafka, Zookeeper and more.

Besides, DexLab Analytics, a pioneering analytics training institute headquartered in Gurgaon, India also publishes technical articles, amazing blogs, riveting case studies and interviews with analytics leaders on myriad data science topics, including Apache Spark, Retail Analytics and Risk Modeling. The content is crisp, easy to understand and offers crucial insights on a gamut of topics: it helps the aspiring readers to broaden their horizons.

The realms of data science are fascinating and intimidating as well; but with the right knowledge partner, carry suave data skill in your sleeves – Data Science Courses in Noida from DexLab Analytics are the best in town! Also, their Business Analytics Training Courses in Noida are worth checking for.

Some of the parts of the blog have been sourced from – http://dataconomy.com/2018/01/5-awesome-data-science-subscriptions-keep-informed/ and https://www.springboard.com/blog/data-science-blogs


Interested in a career in Data Analyst?

To learn more about Machine Learning Using Python and Spark – click here.

To learn more about Data Analyst with Advanced excel course – click here.
To learn more about Data Analyst with SAS Course – click here.
To learn more about Data Analyst with R Course – click here.
To learn more about Big Data Course – click here.

Call us to know more