The job of a data scientist is one that is challenging, exciting and crucial to an organization’s success. So, it’s no surprise that there is a rush to enroll in a Data Science course, to be eligible for the job. But, while you are at it, you also need to have the awareness regarding the job responsibilities usually bestowed upon the data scientists in a business organization and you would be surprised to learn that the responsibilities of a data scientist differs from that of a data analyst or, a data engineer.
So, what is the role and responsibility of a data scientist? Let’s take a look.
The common idea regarding a data scientist role is that they analyze huge volumes of data in order to find patterns and extract information that would help the organizations to move ahead by developing strategies accordingly. This surface level idea cannot sum up the way a data scientist navigates through the data field. The responsibilities could be broken down into segments and that would help you get the bigger picture.
Data management
The data scientist, post assuming the role, needs to be aware of the goal of the organization in order to proceed. He needs to stay aware of the top trends in the industry to guide his organization, and collect data and also decide which methods are to be used for the purpose. The most crucial part of the job is the developing the knowledge of the problems the business is trying solve and the data available that have relevance and could be used to achieve the goal. He has to collaborate with other departments such as analytics to get the job of extracting information from data.
Data analysis
Another vital responsibility of the data scientist is to assume the analytical role and build models and implement those models to solve issues that are best fit for the purpose. The data scientist has to resort to data mining, text mining techniques. Doing text mining with python course can really put you in an advantageous position when you actually get to handle complex dataset.
Developing strategies
The data scientists need to devote themselves to tasks like data cleaning, applying models, and wade through unstructured datasets to derive actionable insight in order to gauge the customer behavior, market trends. These insights help a business organization to decide its future course of action and also measure a product performance. A Data analyst training institute is the right place to pick up the skills required for performing such nuanced tasks.
Collaborating
Another vital task that a data scientist performs is collaborating with others such as stakeholders and data engineers, data analysts communicating with them in order to share their findings or, discussing certain issues. However, in order to communicate effectively the data scientists need to master the art of data visualization which they could learn while pursuing big data courses in delhi along with deep learning for computer vision course. The key issue here is to make the presentation simple yet effective enough so that people from any background can understand it.
The above mentioned responsibilities of a data scientist just scratch the surface because, a data scientist’s job role cannot be limited by or, defined by a couple of tasks. The data scientist needs to be in synch with the implementation process to understand and analyze further how the data driven insight is shaping strategies and to which effect. Most importantly, they need to evaluate the current data infrastructure of the company and advise regarding future improvement. A data scientist needs to have a keen knowledge of Machine Learning Using Python, to be able to perform the complex tasks their job demands.
With 2.5 quintillion bytes of data being created everyday companies are scrambling to build models and hire experts to extract information hidden in massive unstructured datasets and the data scientists have become the most sought-after professionals in the world. The job portals are full of job postings looking for data scientists whose resume has the perfect combination of skill and experience. In this world which is being driven by the data revolution, achieving your big data career dreams need a little bit of planning and strategizing. So, here is a step-by-step guide for you.
Grabbing a high paying and skilled data job is not going to be easy, industries will only invest money on individuals with the right skillset. Your job responsibility will involve wading through tons of unstructured data to find pattern and meaning, making forecasts regarding marketing trends, customer behavior and deliver the insight in a presentable format to the company on the basis of which they are going to be strategizing.
So, before you even begin make sure that you have the tenacity and enthusiasm required for the job. You would need to undergo Data science using python training, in order to gain the necessary skills and knowledge and since this is an evolving field you should be ready to constantly upskill yourself and stay updated about the latest developments in the field.
Are you ready? If it’s a resounding yes, then, without wasting any more time let’s get straight to the point and explore the steps that will lead you to become a data scientist.
Step 1: Complete education
Before you pursue data science, you must complete your bachelors degree, if you are coming from computer science, applied mathematics, or, economics that could give you a head start. However, you need to undergo Data Science training, post that to acquire the required skillset.
Step 2: Gain knowledge of Mathematics and statistics
You do not need to have a PHD in either, but, since both are at the core of the data science you must have a good grasp on applied mathematics and statistics. Your task would require you to have knowledge regarding linear algebra, probability & statistics. So, your first step would be to update yourself and be familiar with the concepts if you happen to hail from a non-science background so that you can sail through the rest of the journey.
Step 3: Get ready to do programming
Just like mathematics and statistics, having a grip on a programming language preferably Python, is essential. Now, why do you need to learn coding? Well, coding is important as you have to work with large datasets comprising mostly unstructured data and coding will help you to clean, organize, read data and also process it. Now the stress is on Python because it is one of the widely used languages in the data science community and is comparatively easier to pick up.
Step 4: Learn Machine Learning
Machine learning plays a crucial role in data science as it helps finding patterns in data and making predictions. Mastering machine learning techniques would enable you develop algorithms for the models and create an automated system that enables you to make predictions in real-time. Consider undergoing a Machine Learning training gurgaon.
Step 5: Learn Data Munging, Visualization, and Reporting
It has been mentioned before that you would mostly be handling unstructured data, which means in order to process that data you must transform that data into a format that is easy to work with. Data munging helps you achieve that. Data visualization is again a must-have skill for a data scientist as it allows you to visually present your data findings that is easy to understand through graphs, charts, while data reporting lets you prepare and present reports for businesses.
Step 6: Be certified
Now that the field has advanced so much, there is a requirement for professionals who have undergone Data Science course. Doing a certification course would upskill you and arm you with industry knowledge. Reputed institutes like Dexlab Analytics offer cutting edge courses such as Python for data science training. If you just follow this step it would take care of the rest of the worries, the best part of getting your training is that here you will be taught everything from scratch so, no need to fret if you do not know programming language. Your learning would be aided by hands-on training.
Step 7: Practice your skills
You need to test the skills you have acquired and to hone the skills you must explore Kaggle, which lets your access resources you need and this platform also allows you to take part in competitions that further helps you sharpen your abilities. You should also keep on practicing by doing projects in order to put the theories into action.
Step 8: Work on your soft skills
In order to be a professional data scientist you must acquire soft skills as well. So along with working on your communication skills, you must also need to develop problem solving skills while learning how business organizations function to understand what would be required of you when you assume the role of a data scientist.
Step 9: Get an internship
Now that you have the skill and certification you need experience to get hired, build a resume stressing on the skills you have acquired and search the job portals to land an internship. It would not only enhance your resume, but, it also gives you exposures to real projects, the more projects you handle the better and you would also learn from the experts there.
Step 10: Apply for a job
Once you have gathered enough experience start applying for full-time positions as now you have both skill and experience. But, do not stop learning once you land a job, because this field is growing many changes will happen so you have to mold yourself accordingly. Be a part of the community, network with people, keep on exploring GitHub and find out what other skills you require.
So, those were the steps you need to follow to build a rewarding career in data science. The job opportunities are plenty and to grab the right job you must do big data training in gurgaon. These courses are aimed to prepare individuals for the industry, so get ready for an exciting career!
Today we will begin discussion about a significant concept, probability, which measures the likelihood of the occurrence of an event. This is the first part of the series, where you would be introduced to the core concept. So, let’s begin.
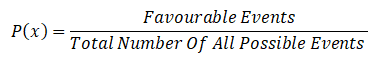
What is probability?
It is a measure of quantifying the likelihood that an event will occur and it is written as P(x).
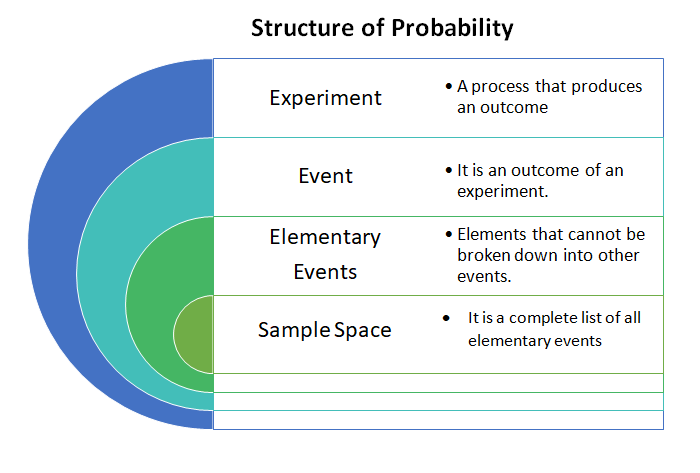
Key concepts of probability
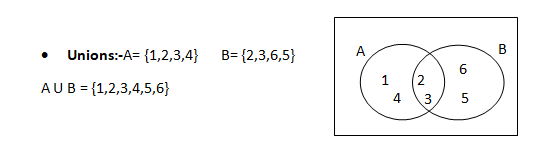
A union comprises of only unique values.
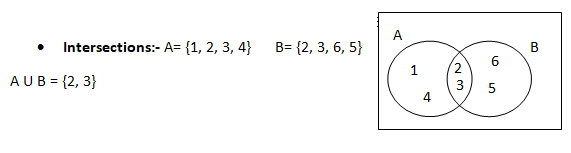
Intersection comprises of common values of the two sets
Mutually Exclusive Events:- If the occurrence of one event preludes the occurrence of the other event(s), then it is called mutually exclusive event.
P(A∩B) = 0
Independent Events:- If the occurrence or non-occurrence of an event does not have any effect on the occurrence or non-occurrence of other event(s), then it is called an independent event. For example drinking tea is independent of going for shopping.
Collectively Exhaustive Events:– A set of collectively exhaustive events comprises of all possible elementary events for an experiment. Therefore, all sample spaces are collectively exhaustive sets.
Complementary Events:– A complement of event A will be A` i.e. P(A`) = 1 ─ P(A)
Properties of probability
Probabilities are non-negative values ranging between 0 & 1.
Ω = 1 i.e. combined probability of sample is 1
If A & B are two mutually exclusive events then P(A U B)= P(A) +P(B)
Probability of not happening of an event is P(A)= 1 ─ P(A)
Rules of Counting the possibilities
The mn counting rule:- When a customer has a set of combinations to choose from like two different engines, five different paint colors and three different interior packages , how will he calculate the total number of options available to him? The answer to the question is “ mn counting rule”. Simply multiply the given options, like in our case 2 * 5 * 3 will give us 30.This means the customer has 30 combinations to choose from when it comes to purchasing a car.
Sampling from a population with replacement:- Suppose that you roll a dice three times i.e. the number of trials is 3, now if we want to check how many combinations are possible in this particular experiment we use Nn = 63 = 216
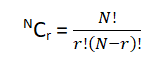
Sampling from a population without replacement:- When the sample space shrinks after each trial then you use the following formula :-
Conclusion
There is a video covering the same concept attached down the blog, go through it to be more clear about this.
Among all the decisions we make in our lives, choosing the right career path seems to be the most crucial one. Except for a couple of clueless souls, most students know by the time they clear their boards what they aspire to be. A big chunk of them veer towards engineering, MBA, even pursue masters degree in academics and post completion of their studies they settle for relevant jobs. So far that used to be the happily ever after career story, but, in the last couple of years there seems to be a big paradigm shift and it is causing a stir across industries. Professionals having an engineering background, or, masters degree are opting for a mid-career switch and a majority of them are opting for the data science domain by pursuing a Data Science course. So, what’s pushing them towards DS? Let’s investigate.
What’s causing the career switch?
No matter which field someone has chosen for career, achieving stability is a common goal. However, in many fields be it engineering, or, something else the job opportunities are not unlimited yet the number of job seekers is growing every year. So, thereby one can expect to face a stiff competition grabbing a well-paid job.
There have been many layoffs in recent times especially due to the unprecedented situation the world is going through. Even before that there were reports of job cuts and certain sectors not doing well would directly impact the career of thousands. Even if we do not concentrate on the extremes, the growth prospect in most places could be limited and achieving the desired salary or, promotion oftentimes becomes impossible. This leads to not only frustration but uncertainty as well.
The demand for big data
If you haven’t been living as a hermit, then you are aware of the data explosion that impacted nearly every industry. The moment everyone understood the power of big data they started investing in research and in building a system that can handle, store and process data which is a storehouse of information. Now, who is going to process data to extract the information? And here comes the new breed of data experts, namely the data scientists, who have mastered the technology having undergone Data Science training and are able to develop models and parse through data to deliver the insights companies are looking for to make informed decisions. The data trend is pushing the boundaries and as cutting edge technologies like AI, machine learning are percolating every aspect of the industries, the demand for avant-garde courses like natural language processing course in gurgaon, is skyrocketing.
Lack of trained industry ready data science professionals
Although big data has started trending as businesses started gathering data from multiple sources, there are not many professionals available to handle the data. The trend is only gaining momentum and if you just check the top job portals such as Glassdoor, Indeed and go through the ads seeking data scientists you would immediately know how far the field has traveled. With more and more industries turning to big data, the demand for qualified data scientists is shooting up.
Why data science is being chosen as the best option?
In the 21st century data science is a field which has plethora of opportunities for the right people and this is one field which is not only growing now but is also poised to grow in future as well. The data scientist is one of the most highest paid professional in today’s job market. According to the U.S. Bureau of Labor Statistics report by the year 2026 there is a possibility of creation of 11.5 million jobs in this field.
Now take a look at the Indian context, from agriculture to aviation the demand for data scientists would continue to grow as there is a severe shortage of professionals. As per a report the salary of a data scientist could hover around ₹1,052K per annum and remember the field is growing which means there is not going to be a dearth of job opportunities or, lucrative pay packages.
The shift
Considering all of these factors there has been a conscious shift in the mindset of the professionals, who are indeed making a beeline for institutes that offer data science certification. By doing so they hope to-
Access promising career opportunities
Achieve job satisfaction and financial stability
Earn more while enjoying job security
Work across industries and also be recruited by industry biggies
Gain valuable experience to be in demand for the rest of their career
Be a part of a domain that promises innovation and evolution instead of stagnation
Keeping in mind the growing demand for professionals and the dearth of trained personnel, premier institutes like DexLab Analytics have designed courses that are aimed to build industry-ready professionals. The best thing about such courses is that you can hail from any academic background, here you will be taught from scratch so that you can grasp the fundamentals before moving on to sophisticated modules.
Along with providing data science certification training, they also offer cutting edge courses such as, artificial intelligence certification in delhi ncr, Machine Learning training gurgaon. Such courses enable the professionals enhance their skillset to make their mark in a world which is being dominated by big data and AI. The faculty consists of skilled professionals who are armed with industry knowledge and hence are in a better position to shape students as per industry demands and standards.
The mid-career switch is happening and will continue to happen. There must be professionals who have the expertise to drive an organization towards the future by unlocking their data secrets. However, something must be kept in mind if you are considering a switch, you need to be ready to meet challenges, along with knowledge of Python for data science training, you need to have a vision, a hunger and a love for data to be a successful data scientist.
In this series we cover the basic of statistical inference, this is the fourth part of our discussion where we explain the concept of hypothesis testing which is a statistical technique. You could also check out the 3rd part of the series here.
Introduction
The objective of sampling is to study the features of the population on the basis of sample observations. A carefully selected sample is expected to reveal these features, and hence we shall infer about the population from a statistical analysis of the sample. This process is known as Statistical Inference.
There are two types of problems. Firstly, we may have no information at all about some characteristics of the population, especially the values of the parameters involved in the distribution, and it is required to obtain estimates of these parameters. This is the problem of Estimation. Secondly, some information or hypothetical values of the parameters may be available, and it is required to test how far the hypothesis is tenable in the light of the information provided by the sample. This is the problem of Test of Hypothesis or Test of Significance.
In many practical problems, statisticians are called upon to make decisions about a population on the basis of sample observations. For example, given a random sample, it may be required to decide whether the population, from which the sample has been obtained, is a normal distribution with mean = 40 and s.d. = 3 or not. In attempting to reach such decisions, it is necessary to make certain assumptions or guesses about the characteristics of population, particularly about the probability distribution or the values of its parameters. Such an assumption or statement about the population is called Statistical Hypothesis. The validity of a hypothesis will be tested by analyzing the sample. The procedure which enables us to decide whether a certain hypothesis is true or not, is called Test of Significance or Test of Hypothesis.
What Is Testing Of Hypothesis?
Statistical Hypothesis
Hypothesis is a statistical statement or a conjecture about the value of a parameter. The basic hypothesis being tested is called the null hypothesis. It is sometimes regarded as representing the current state of knowledge & belief about the value being tested. In a test the null hypothesis is constructed with alternative hypothesis denoted by 𝐻1 ,when a hypothesis is completely specified then it is called a simple hypothesis, when all factors of a distribution are not known then the hypothesis is known as a composite hypothesis.
Testing Of Hypothesis
The entire process of statistical inference is mainly inductive in nature, i.e., it is based on deciding the characteristics of the population on the basis of sample study. Such a decision always involves an element of risk i.e., the risk of taking wrong decisions. It is here that modern theory of probability plays a vital role & the statistical technique that helps us at arriving at the criterion for such decision is known as the testing of hypothesis.
Testing Of Statistical Hypothesis
A test of a statistical hypothesis is a two action decision after observing a random sample from the given population. The two action being the acceptance or rejection of hypothesis under consideration. Therefore a test is a rule which divides the entire sample space into two subsets.
A region is which the data is consistent with 𝐻0.
The second is its complement in which the data is inconsistent with 𝐻0.
The actual decision is however based on the values of the suitable functions of the data, the test statistic. The set of all possible values of a test statistic which is consistent with 𝐻0 is the acceptance region and all these values of the test statistic which is inconsistent with 𝐻0 is called the critical region. One important condition that must be kept in mind for efficient working of a test statistic is that the distribution must be specified.
Does the acceptance of a statistical hypothesis necessarily imply that it is true?
The truth a fallacy of a statistical hypothesis is based on the information contained in the sample. The rejection or the acceptance of the hypothesis is contingent on the consistency or inconsistency of the 𝐻0 with the sample observations. Therefore it should be clearly bowed in mind that the acceptance of a statistical hypothesis is due to the insufficient evidence provided by the sample to reject it & it doesn’t necessarily imply that it is true.
Elements: Null Hypothesis, Alternative Hypothesis, Pot
Null Hypothesis
A Null hypothesis is a hypothesis that says there is no statistical significance between the two variables in the hypothesis. There is no difference between certain characteristics of a population. It is denoted by the symbol 𝐻0. For example, the null hypothesis may be that the population mean is 40 then
𝐻0(𝜇 = 40)
Let us suppose that two different concerns manufacture drugs for including sleep, drug A manufactured by first concern and drug B manufactured by second concern. Each company claims that its drug is superior to that of the other and it is desired to test which is a superior drug A or B? To formulate the statistical hypothesis let X be a random variable which denotes the additional hours of sleep gained by an individual when drug A is given and let the random variable Y denote the additional hours to sleep gained when drug B is used. Let us suppose that X and Y follow the probability distributions with means 𝜇𝑥 and 𝜇𝑌 respectively.
Here our null hypothesis would be that there is no difference between the effects of two drugs. Symbolically,
𝐻0: 𝜇𝑋 = 𝜇𝑌
Alternative Hypothesis
A statistical hypothesis which differs from the null hypothesis is called an Alternative Hypothesis, and is denoted by 𝐻1. The alternative hypothesis is not tested, but its acceptance (rejection) depends on the rejection (acceptance) of the null hypothesis. Alternative hypothesis contradicts the null hypothesis. The choice of an appropriate critical region depends on the type of alternative hypothesis, whether both-sided, one-sided (right/left) or specified alternative.
Alternative hypothesis is usually denoted by 𝐻1.
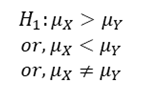
For example, in the drugs problem, the alternative hypothesis could be
Power Of Test
The null hypothesis 𝐻0 𝜃 = 𝜃0 is accepted when the observed value of test statistic lies the critical region, as determined by the test procedure. Suppose that the true value of 𝜃 is not 𝜃0, but another value 𝜃1, i.e. a specified alternative hypothesis 𝐻1 𝜃 = 𝜃1 is true. Type II error is committed if 𝐻0 is not rejected, i.e. the test statistic lies outside the critical region. Hence the probability of Type II error is a function of 𝜃1, because now 𝜃 = 𝜃1 is assumed to be true. If 𝛽 𝜃1 denotes the probability of Type II error, when 𝜃 = 𝜃1 is true, the complementary probability 1 − 𝛽 𝜃1 is called power of the test against the specified alternative 𝐻1 𝜃 = 𝜃1 . Power = 1-Probability of Type II error=Probability of rejection 𝐻0 when 𝐻1 is true Obviously, we could like a test to be as ‘powerful’ as possible for all critical regions of the same size. Treated as a function of 𝜃, the expression of 𝑃 𝜃 = 1 − 𝛽 𝜃 is called Power Function of the test for 𝜃0 against 𝜃. the curve obtained by plotting P(𝜃) against all possible values of 𝜃, is known as Power Curve.
Elements: Type I & Type II Error
Type I Error & Type Ii Error
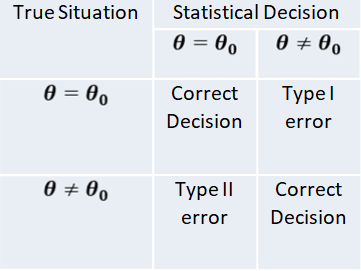
The procedure of testing statistical hypothesis does not guarantee that all decisions are perfectly accurate. At times, the test may lead to erroneous conclusions. This is so, because the decision is taken on the basis of sample values, which are themselves fluctuating and depend purely on chance. The errors in statistical decisions are two types:
Type I Error – This is the error committed by the test in rejecting a true null hypothesis.
Type II Error – This is the error committed by the test in accepting a false null hypothesis.
Considering for the population mean is 40, i.e. 𝐻0 𝜇 = 40 , let us imagine that we have a random sample from a population whose mean is really 40. if we apply the test for 𝐻0 𝜇 = 40 , we might find that the values of test statistic lines in the critical region, thereby leading to the conclusion that the population mean is not 40; i.e. the test rejects the null hypothesis although it is true. We have thus committed what is known as “Type I error” or “Error of first kind”. On the other hand, suppose that we have a random sample from a population whose mean is known to different from 40, say 43. if we apply the test for 𝐻0 𝜇 = 40 , the value of the statistic may, by chance, lie in the acceptance region, leading to the conclusion that the mean may be 40; i.e. the test does not reject the null hypothesis 𝐻0 𝜇 = 40 , although it is false. This is again another form of incorrect decision, and the error thus committed is known as “Type II error” or “Error of second kind”.
Using sampling distribution of the test statistic, we can measure in advance the probabilities of committing the two types of error. Since the null hypothesis is rejected only when the test statistic falls in the critical region.
Probability of Type I error = Probability of rejecting 𝐻0 𝜃 = 𝜃0 , when it is true = Probability that the test statistic lies in the critical region, assuming 𝜃 = 𝜃0.
The probability of Type I error must not exceed the level of significance (𝛼) of the test.
The probability of Type II error assumes different values for different values of 𝜃 covered by the alternative hypothesis 𝐻1. Since the null hypothesis is accepted only when the observed value of the best statistic lies outside the critical region.
Probability of Type II error 𝑊ℎ𝑒𝑛 𝜃 = 𝜃1 = Probability of accepting 𝐻0 𝜃 = 𝜃0 , when it is false = Probability that the test statistic lies in the region of acceptance, assuming 𝜃 = 𝜃1
The probability of Type I error is necessary for constructing a test of significance. It is in fact the ‘size of the Critical Region’. The probability of Type II error is used to measure the “power” of the test in detecting falsity of the null hypothesis. When the population has a continuous distribution
Probability of Type I error = Level of significance = Size of critical region
Elements: Level Of Significance & Critical Region
Level Of Significance And Critical Region
The decision about rejection or otherwise of the null hypothesis is based on probability considerations. Assuming the null hypothesis to be true, we calculate the probability of obtaining a difference equal to or greater than the observed difference. If this probability is found to be small, say less than .05, the conclusion is that the observed value of the statistic is rather unusual and has been caused due to the underlying assumption (i.e. null hypothesis) that is not true. We say that the observed difference is significant at 5 per cent level, and hence the ‘null hypothesis is rejected’ at 5 per cent level of significance. If, however, this probability is not very small, say more than .05, the observed difference cannot be considered to be unusual and is attributed to sampling fluctuation only. The difference is, now said to be not significant at 5 per cent level, and we conclude that there is no reason to reject the null hypothesis’ at 5 per cent level of significance. It has become customary to use 5% and 1% level of significance, although other levels, such as 2% or 5% may also be used.
Without actually going to calculate this probability, the test of significance may be simplified as follows. From the sampling distribution of the statistic, we find the maximum difference is which is exceeded in (say 5) percent of cases. If the observed difference in larger than this value, the null hypothesis is rejected. It is less there in no reason to reject the null hypothesis.
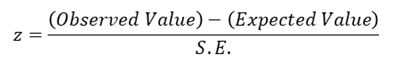
Suppose, the sampling distribution of the statistic is a normal distribution. Since the area under normal curve outside the ordinates at mean ±1.96 (𝑠. 𝑑. ) is only 5%, the probability that the observed value of the statistic differs from the expected value of 1.96 times the S.E. or more is .05; and the probability of a larger difference will be still smaller. If, therefore
Is either greater than 1.96 or less than -1.96 (i.e. numerically greater than 1.96), the null hypothesis 𝐻0 is rejected at 5% level of significance. The set values 𝑧 ≥ 1.96 𝑜𝑟 ≤ −1.96, i.e.
|𝑧| ≥ 1.96
constitutes what is called the Critical Region for the test. Similarly since the area outside mean ±2.58 (s.d.) is only 1%. 𝐻0 is rejected at 1% level of significance, if z numerically exceeds 258, i.e. the critical region is 𝑧 ≥ 2.58 at 1% level. Using the sampling distribution of an appropriate test statistic we are able to establish the maximum difference at a specified level between the observed and expected values that is consistent with null hypothesis 𝐻0 . The set of values of the test statistic corresponding to this difference which lead to the acceptance of 𝐻0 is called Region of acceptance. Conversely, the set of values of the statistic leading to the rejection of 𝐻0 is referred to as Region of Rejection or “Critical Region” of the test. The value of the statistic which lies at the boundary of the regions of acceptance and the rejection is called Critical value. When the null hypothesis is true, the probability of observed value of the test statistic falling in the critical region is often called the “Size of Critical Region”.
𝑆𝑖𝑧𝑒 𝑜𝑓 𝐶𝑟𝑖𝑡𝑖𝑐𝑎𝑙 𝑅𝑒𝑔𝑖𝑜𝑛 ≤ 𝐿𝑒𝑣𝑒𝑙 𝑜𝑓 𝑆𝑖𝑔𝑛𝑖𝑓𝑖𝑐𝑎𝑛𝑐𝑒
However, for a continuous population, the critical region is so determined that its size equals the Level of Significance (𝛼).
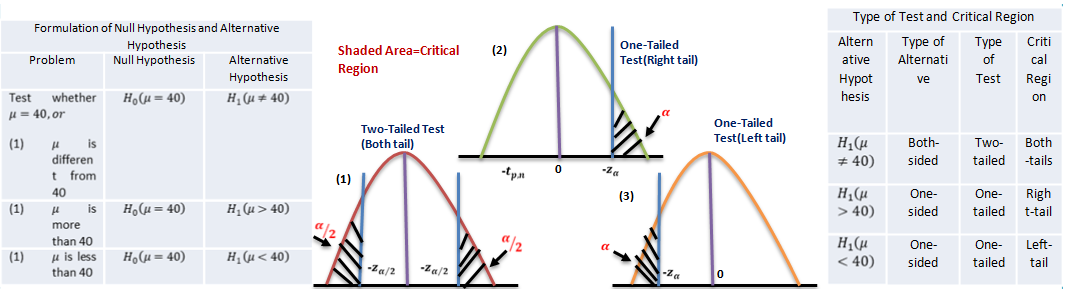
Two-Tailed And One-Tailed Tests
Our discussion above were centered around testing the significance of ‘difference’ between the observed and expected values, i.e. whether the observed value is significantly different from (i.e. either larger or smaller than) the expected value, as could arise due to fluctuations of random sampling. In the illustration, the null hypothesis is tested against “both-sided alternatives” 𝜇 > 40 𝑜𝑟 𝜇 < 40 , i.e.
𝐻0 𝜇 = 40 𝑎𝑔𝑎𝑖𝑛𝑠𝑡 𝐻1 𝜇 ≠ 40
Thus assuming 𝐻0 to be true, we would be looking for large differences on both sides of the expected value, i.e. in “both tails” of the distribution. Such tests are, therefore, called “Two-tailed tests”.
Sometimes we are interested in tests for large differences on one side only i.e., in one ‘one tail’ of the distribution. For example, whether a change in the production bricks with a ‘higher’ breaking strength, or whether a change in the production technique yields ‘lower’ percentage of defectives. These are known as “One-tailed tests”.
For testing the null hypothesis against “one-sided alternatives (right side)” 𝜇 > 40 , i.e.
𝐻0 𝜇 = 40 𝑎𝑔𝑎𝑖𝑛𝑠𝑡𝐻1 𝜇 > 40
The calculated value of the statistic z is compared with 1.645, since 5% of the area under the standard normal curve lies to the right of 1.645. if the observed value of z exceeds 1.645, the null hypothesis 𝐻0 is rejected at 5% level of significance. If a 1% level were used, we would replace 1.645 by 2.33. thus the critical regions for test at 5% and 1% levels are 𝑧 ≥ 1.645 and 𝑧 ≥ 2.33 respectively.
For testing the null hypothesis against “one-sided alternatives (left side)” 𝜇 < 40 i.e.
𝐻0 𝜇 = 40 𝑎𝑔𝑎𝑖𝑛𝑠𝑡𝐻1 𝜇 < 40
The value of z is compared with -1.645 for significance at 5% level, and with -2.33 for significance at 1% level. The critical regions are now 𝑧 ≤ −1.645 and 𝑧 ≤ −2.33 for 5% and 1% levels respectively. In fact, the sampling distributions of many of the commonly-used statistics can be approximated by normal distributions as the sample size increases, so that these rules are applicable in most cases when the sample size is ‘large’, say, more than 30. It is evident that the same null hypothesis may be tested against alternative hypothesis of different types depending on the nature of the problem. Correspondingly, the type of test and the critical region associated with each test will also be different.
Solving Testing Of Hypothesis Problem
Step 1 Set up the “Null Hypothesis” 𝐻0 and the “Alternative Hypothesis” 𝐻1 on the basis of the given problem. The null hypothesis usually specifies the values of some parameters involved in the population: 𝐻0 𝜃 = 𝜃0 . The alternative hypothesis may be any one of the following types: 𝐻1 ( ) 𝜃 ≠ 𝜃1 𝐻1 𝜃 > 𝜃0 , 𝐻1 𝜃 < 𝜃0 . The types of alternative hypothesis determines whether to use a two-tailed or one-tailed test (right or left tail).
Step 2
State the appropriate “test statistic” T and also its sampling distribution, when the null hypothesis is true. In large sample tests the statistic 𝑧 = (𝑇 − 𝜃0)Τ𝑆. 𝐸. , (T) which approximately follows Standard Normal Distribution, is often used. In small sample tests, the population is assumed to be Normal and various test statistics are used which follow Standard Normal, Chi-square, t for F distribution exactly.
Step 3 Select the “level of significance” 𝛼 of the test, if it is not specified in the given problem. This represents the maximum probability of committing a Type I error, i.e., of making a wrong decision by the test procedure when in fact the null hypothesis is true. Usually, a 5% or 1% level of significance is used (If nothing is mentioned, use 5% level).
Step 4
Find the “Critical region” of the test at the chosen level of significance. This represents the set of values of the test statistic which lead to rejection of the null hypothesis. The critical region always appears in one or both tails of the distribution, depending on weather the alternative hypothesis is one-sided or both-sided. The area in the tails must be equal to the level of significance 𝛼. For a one-tailed test, 𝛼 appears in one tail and for two-tailed test 𝛼/2 appears in each tail of the distribution. The critical region is
Where 𝑇𝛼 is the value of T such that the area to its tight is 𝛼.
Step 5
Compute the value of the test statistic T on the basis of sample data the null hypothesis. In large sample tests, if some parameters remain unknown they should be estimated from the sample. Step 6
If the computed value of test statistic T lies in the critical region, “reject 𝐻0”; otherwise “do not reject 𝐻0 ”. The decision regarding rejection or otherwise of 𝐻0 is made after a comparison of the computed value of T with critical value (i.e., boundary value of the appropriate critical region).
Step 7 Write the conclusion in plain non-technical language. If 𝐻0 is rejected, the interpretation is: “the data are not consistent with the assumption that the null hypothesis is true and hence 𝐻0 is not tenable”. If 𝐻0 is not rejected, “the data cannot provide any evidence against the null hypothesis and hence 𝐻0 may be accepted to the true”. The conclusion should preferably be given in the words stated in the problem.
Conclusion
Hypothesis is a statistical statement or a conjecture about the value of a parameter. The legal concept that one is innocent until proven guilty has an analogous use in the world of statistics. In devising a test, statisticians do not attempt to prove that a particular statement or hypothesis is true. Instead, they assume that the hypothesis is incorrect (like not guilty), and then work to find statistical evidence that would allow them to overturn that assumption. In statistics this process is referred to as hypothesis testing, and it is often used to test the relationship between two variables. A hypothesis makes a prediction about some relationship of interest. Then, based on actual data and a pre-selected level of statistical significance, that hypothesis is either accepted or rejected. There are some elements of hypothesis like null hypothesis, alternative hypothesis, type I & type II error, level of significance, critical region and power of test and some processes like one and two tail test to find the critical region of the graph as well as the error that help us reach the final conclusion.
A Null hypothesis is a hypothesis that says there is no statistical significance between the two variables in the hypothesis. There is no difference between certain characteristics of a population. It is denoted by the symbol 𝐻0. A statistical hypothesis which differs from the null hypothesis is called an Alternative Hypothesis, and is denoted by 𝐻1. The procedure of testing statistical hypothesis does not guarantee that all decisions are perfectly accurate. At times, the test may lead to erroneous conclusions. This is so, because the decision is taken on the basis of sample values, which are themselves fluctuating and depend purely on chance, this process called types of error. Hypothesis testing is very important part of statistical analysis. By the help of hypothesis testing many business problem can be solved accurately.
That was the fourth part of the series, that explained hypothesis testing and hopefully it clarified your notion of the same by discussing each crucial aspect of it. You can find more informative posts like this one on Data Science course topics. Just keep on following the Dexlab Analytics blog to stay informed.
A business organization has to deal with a massive amount of data streaming from myriad sources, and data warehousing refers to the process of collection and storage of that data that needs to be analyzed to glean valuable business insight. Data warehousing plays a crucial role in business intelligence. The concept originated in the 1980s, it basically involves data extraction from disparate sources which later gets processed and post formatting the data stays in the system ready to be utilized for taking important decisions.
Data warehouse basically performs the task of running an analysis on the stored data which could be both structured and unstructured even semi-structured, however, the data that is in the warehouse cannot be modified. Data warehousing basically helps companies gain insight regarding factors influencing business, and they could use the data insight to formulate new strategies, developing products and so on. This highly skilled task demands professionals who have a background in Data science using python training.
What are the different steps in data warehousing?
Data warehousing involves the following steps
Transactional data extraction: In this step, the data is extracted from multiple sources available and loaded into the system.
Data transformation: The transactional data extracted from different sources need to be transformed and it would need relating as well.
Building a dimensional model: A dimensional model comprising fact and dimension tables are built and the data gets loaded.
Getting a front-end reporting tool: The tool could be built or, purchased, a crucial decision that needs much deliberation.
Benefits of data warehousing
An edge over the competition
This is undeniably one benefit every business would be eager to reap from data warehousing. The data that is untapped could be the source of valuable information regarding risk factors, trends, customers and so many other factors that could impact the business. Data warehousing collates the data and arranges them in a contextual manner that is easy for a company to access and utilize to make informed decisions.
Enhanced data quality
Since data pooled from different sources could be structured or, unstructured and in different formats, working with such data inconsistency could be problematic and data warehousing takes care of the issue by transforming the data into a consistent format. The standardized data that easily conforms to the analytics platform can be of immense value.
Historical data analysis
A data warehouse basically stores a big amount of data and that includes historical data as well. Such data are basically old records of the company regarding sales, employee data, or, product-related information. Now the historical data belonging to different time periods need to be analyzed to predict upcoming trends.
Smarter business intelligence
Since businesses now rely on data-driven insight to devise strategies, they need access to data that is consistent, error-free, and high quality. However, data coming from numerous sources could be erroneous and irrelevant. But, data warehousing takes care of this issue by formatting the data to make it consistent and free from any error and could be analyzed to offer valuable insight that could help the management take decisions regarding sales, marketing, finance.
High ROI
Building a data warehouse requires significant investment but in the long term, the revenue that it generates can be significant. In fact, keen business intelligence now plays a crucial role in determining the success of an organization and with data warehousing the organizations can have access to data that is consistent and high quality thus enabling the company to derive actionable intel. When a company implements such insight in making smarter strategies, they do gain in the long run.
Data warehousing plays a significant role in collating and storing valuable data that fuels a company’s business decisions. However, given the specialized nature of the task, one must undergo Data Science training, to learn the nuances. The field of big data has plenty of opportunities for the right candidates.
Big data is certainly is getting a lot of hype and for good reasons. Different sectors ranging from business to healthcare are intent on harnessing the power of data to find solutions to their most imminent problems. Huge investments are being made to build models, but, there are some niggling issues that are not being resolved.
So what are the big challenges the data science industry is facing?
Managing big data
Thanks to the explosion of information now the amount of data being created every year is adding to the already overstocked pile, and, most of the data we are talking about here is unstructured data. So, handling such a massive amount of raw data that is not even in a particular database is a big challenge that could only be overcome by implementing advanced tools.
Lack of skilled personnel
One of the biggest challenges the data science industry has to deal with is the shortage of skilled professionals that are well equipped with Data Science training. The companies need somebody with specific training to manage and process the datasets and present them with the insight which they can channelize to develop business strategies. Sending employees to a Data analyst training institute can help companies address the issue and they could also consider making additional efforts for retaining employees by offering them a higher remuneration.
Communication gap
One of the challenges that stand in the way, is the lack of understanding on the part of the data scientists involved in a project. They are in charge of sorting, cleaning, and processing data, but before they take up the responsibility they need to understand what is the goal that they are working towards. When they are working for a business organization they need to know what the set business objective is, before they start looking for patterns and build models.
Data integration
When we are talking about big data, we mean data pouring from various sources. The myriad sources could range from emails, documents, social media, and whatnot. In order to process, all of this data need to be combined, which can be a mammoth task in itself. Despite there being data integration tools available, the problem still persists. Investment in developing smarter tools is the biggest requirement now.
Data security
Just the way integrating data coming from different sources is a big problem, likewise maintaining data security is another big challenge especially when interconnectivity among data sources exists. This poses a big risk and renders the data vulnerable to hacking. In the light of this problem, procuring permission for utilizing data from a source becomes a big issue. The solution lies in developing advanced machine learning algorithms to keep the hackers at bay.
Data validity
Gaining insight from data processing could only be possible when that data is free from any sort of error. However, sometimes data hailing from different sources could show disparity regardless of being about the same subject. Especially in healthcare, for example, patient data when coming from two different sources could often show dissimilarity. This poses a serious challenge and it could be considered an extension of the data integration issue. Advanced technology coupled with the right policy changes need to be in place to address this issue, otherwise, it would continue to be a roadblock.
The challenges are there, but, recognizing those is as essential as continuing research work to finding solutions. Institutes are investing money in developing data science tools that could smoothen the process by eliminating the hurdles. Accessing big data courses in delhi, is a good way to build a promising career in the field of data science, because despite there being challenges the field is full big opportunities.
The term big data refers to the massive amount of data being generated from various sources that need to be sorted, processed, and analyzed using advanced data science tools to derive valuable insight for different industries. Now, big data comprises structured, semi-structured, and mostly unstructured data. Processing this huge data takes skill and expertise and which only someone with Data Science training would be able to do.
The concept of big data is relatively new and it started emerging post the arrival of internet closely followed by the proliferation of advanced mobile devices, social media platforms, IoT devices, and all other myriad platforms that are the breeding grounds of user-generated data. Managing and storing this data which could be in text, audio, image formats is essential for not just businesses but, for other sectors as well. The information data holds can help in the decision-making process and enable people to understand the vital aspects of an issue better.
The characteristics of big data
Now, any data cannot be classified as big data, there are certain characteristics that define big data and getting in-depth knowledge regarding these characteristics can help you grasp the concept of big data better. The main characteristics of big data could be broken down into 5Vs.
What are the 5Vs of data?
The 5Vs of data basically refers to the core elements of big data, the presence of which acts as a differentiating factor. Although many argue in favor of the essential 3 VS, other pundits prefer dissecting data as per 5Vs. These 5Vs denote Volume, Velocity, Variety, Veracity, Value the five core factors but, not necessarily in that order. However, Volume would always be the element that lays the foundation of big data. Pursuing a Data Science course would further clarify your idea of big data.
Volume
This concept is easier to grasp as it refers to the enormous amount of data being generated and collected every day. This amount is referred to as volume, the size of data definitely plays a crucial role as storing this data is posing a serious challenge for the companies. Now the size of the data would vary from one industry to the other, the amount of data an e-commerce site generates would vary from the amount generated on a popular social media platform like Facebook. Now, only advanced technology could handle and process and not to mention deal with the cost and space management issue for storing such large volumes of data.
Velocity
Another crucial feature of big data is velocity which basically refers to the speed at which data is generated and processed, analyzed, and moved across platforms to deliver insight in real-time if possible. Especially, in a field like healthcare the speed matters, crucial trading decisions that could result in loss or profit, must also be taken in an instant. Only the application of advanced data science technology can collect data points in an instant and process those at a lightning speed to deliver results. Another point to be noted here is the fact that just like volume the velocity of data is also increasing.
Variety
The 3rd V refers to the variety, a significant aspect of big data that sheds light on the diversity of data and its sources. As we already know that the data now hails from multiple sources, including social media platforms, IoT devices, and whatnot. The problem does not stop there, the data is also diverse in terms of format such as videos, texts, images, audios and it is a combination of structured and unstructured data. In fact, almost 80%-90% of data is unstructured in nature. This poses a big problem for the data scientists as sorting this data into distinct categories for processing is a complicated task. However, with advanced data science technologies in place determining the relationship among data is a lot hassle-free process now.
Veracity
It is perhaps the most significant aspect of all other elements, no matter how large datasets you have and in what variety, if the data is messy and inaccurate then it is hardly going to be of any use. Data quality matters and dirty data could be a big problem especially because of the fact that data comes from multiple sources. So, you have apparently no control, the problems range from incomplete data to inconsistency of information. In such situations filtering the data to extract quality data for analysis purposes is essential. Pursuing Data science using python training can help gain more skill required for such specific tasks.
Value
The 5th V of big data refers to the value of the data we are talking about. You are investing money in collecting, storing, and processing the big data but if it does not generate any value at the end of the day then it is completely useless. Managing this massive amount of data requires a big investment in advanced infrastructure and additional resources, so, there needs to be ROI. The data teams involved in the process of collecting, sorting, and analyzing the data need to be sure of the quality of data they are handling before making any move.
The significance of big data in generating valuable insight is undeniable and soon it would be empowering every industry. Further research in this field would lead to the development of data science tools for handling big data issues in a more efficient manner. The career prospects in this field are also bright, training from a Data analyst training institute can help push one towards a rewarding career.
In the competitive world of business, branding plays a pivotal role in making sure that your company can rise above the noise and be noticed. The concept of branding thrives on the dual power of brand recognition and brand recall meaning the customer’s ability to identify your brand among a host of other similar products.
Creating brand awareness is a crucial task for any business done through carefully measured and planned strategies. Familiarizing the audience with a specific brand takes time and apt utilization of all available communication platforms.
What role data science can play in devising branding strategy?
The emergence of online shopping, as well as the proliferation of communication channels, are making the job complicated for marketers, along with the explosion of information sources causing an exponential increase in data generation. The large data if assessed correctly can reveal useful information regarding customers and allow them to make data-driven branding strategies. Data Science training is required for enabling the professionals to help companies assess valuable data.
Handling this vast data can baffle any seasoned marketing team, but, with the application of data science tools and techniques manipulating and extracting valuable information becomes easier. Not just that, but, the marketing team now has the power to peek into customer preferences to angle their branding strategy the right away to make their imprint on the customer’s mind.
So, here is how branding is getting smarter
Personalized messages
Data science allows the marketers to assess the customer data spread across various channels including social media platforms. When analyzed this data points the marketers towards the customers’ buying habits, preferences, and they can develop a message for individual customers keeping these preferences in mind. Marketing personnel having undergone customer market analysis courses would be able to guide their team better.
When a brand approaches a specific customer with recommendations specifically tailored to their preferences they tend to return to that brand. Furthermore, it also helps them to find reasons why the customers change buying decision midcourse and leave a site, or, product page. Data analysis will assess that behavior and offer insight.
Another factor to consider here is that the marketing team can also find the errors in their previous marketing campaigns contained in past data through the right analysis.
Shaper social media strategy
Accessing social media platforms to target customers is a strategy all marketers resort to, after all, a huge chunk of their target audience spends a significant amount of time here. However, creating content and aiming it randomly at all platforms or, some platforms based on guesswork can go for a toss.
Data collected regarding social media usage patterns of customers can point the strategists towards the platforms to invest in. A certain section of their targeted customers might spend time on Twitter, while another segment might veer towards Instagram. So, identifying those platforms for specific segments and delivering content accordingly needs data-backed insight. Assessing data patterns can help marketers position their brands on the right platform.
Delivering the right content
Brands reach out to the target audience via different types of content that they promote across various channels to gain customer attention and push their brand identity. However, their strategy is often very loosely based on an assumption that might go wrong. Engaging the customer gets a lot easier if the team puts the data-driven insight into their content marketing plan.
Data regarding customer age, gender, personal interests, the time they spend over different types of content and what they retweet, or, share on their timeline matters. The team can gain a perspective analyzing the search data of customers to understand what they are looking for and what kind of content resonates with which demographic. Data analysis can solve this entire puzzle and enable the team to devise a content marketing strategy accordingly.
When the customers find that a specific brand has the answers to their queries and offers meaningful information they will naturally gravitate towards it.
Assess brand performance
Application of data science tools can not only lead towards measuring customer behavior but also allow the company to assess its performance. Data could reveal valuable information regarding the bounce rate, the social media image of the brand, customer reviews all of that to point out the problem areas that need immediate attention.
The insight gained from the data could help the team to collaborate with other teams to work on the problem areas and make changes. This does send out a positive message regarding the brand which continuously works to improve itself.
Understanding the value of data is vital for any brand wishing to win customers’ hearts. Applying data science tools to process this data requires skill. Companies should invest in building a team comprising data scientists, analysts to get the job done. They can also train their personnel by sending them to Data analyst training institute.