data science online learning Archives - Page 5 of 11 - DexLab Analytics | Big Data Hadoop SAS R Analytics Predictive Modeling & Excel VBA

Summer Internship/Training 101

Summer Internship/Training 101

Hard Fact: Nowadays, all major organizations seek candidates who are technically sound, knowledgeable and creative. They don’t prefer spending time and money on employee training.  Thus, fresh college graduates face a tricky situation.

Summer internship is a quick solution for them. Besides guaranteeing a valuable experience to the fresh graduates, internship helps them secure a quick job. However, the question is what exactly is a summer internship program and how does it help bag the best job in town?

What Is a Summer Internship?

Summer internships are mostly industrial-level training programs for students who are interested in core technical industry domain. Such internships offer students hands-on learning experience while letting them gain glimpses of the real world – following a practical approach. Put simply, summer trainings enhance skills, sharpen theoretical knowledge and are a great way to pursue a flourishing career. In most cases, the candidates are hired by the companies in which they are interning.

The duration of such internships is mostly between eight to twelve weeks following the college semesters. Mostly, they start from May or June and proceeds through August. So, technically, this is the time for summer internships and at DexLab Analytics, we offer industry-relevant certification courses that break open a gamut of job opportunities. Also, such accredited certifications add value to your CV. They help build powerful CVs.

If you are a college student and from Delhi, NCR, drop by DexLab Analytics! Browse through our business analytics, risk analytics, machine learning and data science course sections. Summer internships are your key to success. Hurry now!

Deep Learning and AI using Python

Why Is It Important?

Summers are crucial. If you are college-goer, you will understand that summertime is the most opportune time to explore diverse career interests without being bogged down by homework or classroom assignments.

Day by day, summer internships are becoming popular. Not only do they expose aspiring candidates to the nuances of the big bad world but also hone their communication skills, create great resumes and make them super confident. Building confidence is extremely important. If you want to survive in this competitive industry, you have to present a confident version of you. Summer training programs are great in this respect. Plus, they add value to your resume. A good internship will help you get noticed by the prospective employers. Always, try to add references; however, ask permission from your supervisors before including their names as references in your resume.

Moreover, summer training gives you the scope to experiment and explore options. Suppose, you are pursuing Marketing Major and bagged an internship in the same, but you are not happy with it. Maybe, marketing is not your thing. No worries! Complete your internship and move on.  

On the other hand, let’s say you are very happy with your selected internship and want to do something in the respective field! Finish the internship, wait for some time and then try for recruitment in the same company where you interned or explore possibilities in the same domain.

2

It’s no wonder that summer internships open a roadway of opportunities. The technical aptitude and in-demand skills learned during the training help you accomplish your desired goal in life.

For more advice or expert guide, follow DexLab Analytics.


Interested in a career in Data Analyst?

To learn more about Data Analyst with Advanced excel course – Enrol Now.
To learn more about Data Analyst with R Course – Enrol Now.
To learn more about Big Data Course – Enrol Now.

To learn more about Machine Learning Using Python and Spark – Enrol Now.
To learn more about Data Analyst with SAS Course – Enrol Now.
To learn more about Data Analyst with Apache Spark Course – Enrol Now.
To learn more about Data Analyst with Market Risk Analytics and Modelling Course – Enrol Now.

Bayesian Thinking & Its Underlying Principles

Bayesian Thinking & Its Underlying Principles

In the previous blog on Bayes’ Theorem, we left off at an interesting junction where we just touched upon the ideas on prior odds ratio, likelihood ratio and the resulting Posterior Odds Ratio. However, we didn’t go into much detail of what it means in real life scenarios and how should we use them.

In this blog, we will introduce the powerful concept of “Bayesian Thinking” and explain why it is so important. Bayesian Thinking is a practical application of the Bayes’ Theorem which can be used as a powerful decision-making tool too!

We’ll consider an example to understand how Bayesian Thinking is used to make sound decisions.

For the sake of simplicity, let’s imagine a management consultation firm hires only two types of employees. Let’s say, IT professionals and business consultants. You come across an employee of this firm, let’s call him Raj. You notice something about Raj instantly. Raj is shy. Now if you were asked to guess which type of employee Raj is what would be your guess?

If your guess is that Raj is an IT guy based on shyness as an attribute, then you have already fallen for one of the inherent cognitive biases. We’ll talk more about it later. But what if it can be proved Raj is actually twice as likely to be a Business Consultant?!

This is where Bayesian Thinking allows us to keep account of priors and likelihood information to predict a posterior probability.

The inherent cognitive bias you fell for is actually called – Base Rate Neglect. Base Rate Neglect occurs when we do not take into account the underlying proportion of a group in the population. Put it simply, what is the proportion of IT professionals to Business consultants in a business management firm? It would be fair to assume for every 1 IT professional, the firm hires 10 business consultants.

Another assumption could be made about shyness as an attribute. It would be fair to assume shyness is more common in IT professionals as compared to business consultants. Let’s assume, 75% of IT professionals are in fact shy corresponding to about 15% of business consultants.

Think of the proportion of employees in the firm as the prior odds. Now, think of the shyness as an attribute as the Likelihood. The figure below demonstrates when we take a product of the two, we get posterior odds.

Plugging in the values shows us that Raj is actually twice as likely to be a Business consultant. This proves to us that by applying Bayesian Thinking we can eliminate bias and make a sound judgment.

Now, it would be unrealistic for you to try drawing a diagram or quantifying assumptions in most of the cases. So, how do we learn to apply Bayesian Thinking without quantifying our assumptions? Turns out we could, if we understood what are the underlying principles of Bayesian Thinking are.

Principles of Bayesian Thinking

Rule 1 – Remember your priors!

As we saw earlier how easy it is to fall for the base rate neglect trap. The underlying proportion in the population is often times neglected and we as human beings have a tendency to just focus on just the attribute. Think of priors as the underlying or the background knowledge which is essentially an additional bit of information in addition to the likelihood. A product of the priors together with likelihood determines the posterior odds/probability.

Rule 2 – Question your existing belief

This is somewhat tricky and counter-intuitive to grasp but question your priors. Present yourself with a hypothesis what if your priors were irrelevant or even wrong? How will that affect your posterior probability? Would the new posterior probability be any different than the existing one if your priors are irrelevant or even wrong?

Rule 3 – Update incrementally

We live in a dynamic world where evidence and attributes are constantly shifting. While it is okay to believe in well-tested priors and likelihoods in the present moment. However, always question does my priors & likelihood still hold true today? In other words, update your beliefs incrementally as new information or evidence surfaces. A good example of this would be the shifting sentiments of the financial markets. What holds true today, may not tomorrow? Hence, the priors and likelihoods must also be incrementally updated.

Conclusion

In conclusion, Bayesian Thinking is a powerful tool to hone your judgment skills. Developing Bayesian Thinking essentially tells us what to believe in and how much confident you are about that belief. It also allows us to shift our existing beliefs in light of new information or as the evidence unfolds. Hopefully, you now have a better understanding of Bayesian Thinking and why is it so important.

On that note, we would like to say DexLab Analytics is a premium data analytics training institute located in the heart of Delhi NCR. We provide intensive training on a plethora of data-centric subjects, including data science, Python and credit risk analytics. Stay tuned for more such interesting blogs and updates!

About the Author: Nish Lau Bakshi is a professional data scientist with an actuarial background and a passion to use the power of statistics to tackle various pressing, daily life problems.


Interested in a career in Data Analyst?

To learn more about Data Analyst with Advanced excel course – Enrol Now.
To learn more about Data Analyst with R Course – Enrol Now.
To learn more about Big Data Course – Enrol Now.

To learn more about Machine Learning Using Python and Spark – Enrol Now.
To learn more about Data Analyst with SAS Course – Enrol Now.
To learn more about Data Analyst with Apache Spark Course – Enrol Now.
To learn more about Data Analyst with Market Risk Analytics and Modelling Course – Enrol Now.
Study: The Demand for Data Scientists is Likely to Rise Sharply

Study: The Demand for Data Scientists is Likely to Rise Sharply

Data is like the new oil. A large number of companies are leveraging artificial intelligence and big data to mine these vast volumes of data in today’s time. Data science is a promising landmine of job opportunities – and it’s high time to consider it as a successful career avenue.

The prospect of data science is skyrocketing. Today, it is estimated that more than 50000 data science and machine learning jobs are lying vacant. Plus, nearly 40000 new jobs are to be generated in India alone by 2020. If you follow the global trends, the role of data scientist has expanded over 650% since 2012 yet only 35000 people in the US are skilled enough.

Data scientists are like the platform that connects the dots between programming and implementation of data to solve challenging business intricacies – says Pankaj Muthe, Academic Program Manager (APAC), Company Spokesperson, QlikTech. The company delivers intuitive platform solutions for embedded analytics, self-service data visualizations and guided analytics and reporting across the globe.

According to a pool of experts, data science is the hottest job trend of this century and is the second most popular degree to have at the master level next to MBA. No wonder, this new breed of science and technology is believed to be driving a new wave of innovation! Data scientists and front-end developers attracted the highest remuneration across Indian startups throughout 2017.

2

Eligibility Criteria

To become a professional data scientist, a degree in computer science/engineering or mathematics is a must. Most of the data scientists have a knack for intricate tasks and aptitude to learn challenging programming languages. Any good organization seeks interested and intelligent candidates with the zeal to learn more. The subjects in which they need to be proficient are mathematics, statistics and programming. Moreover, data science jobs need a very sound base in machine learning algorithms, statistical modeling and neural networks as well as incredible communication skills.

Today, a lot of institutes offer state-of-the-art data science online courses that prove extremely beneficial for career growth and expansion. Combining theoretical knowledge and technical aspects of data science training, these institutes provide skill and assistance to develop real-world applications. DexLab Analytics is one such institute that is located in the heart of Delhi NCR. For more, feel free to reach us at <www.dexlabanalytics.com>

Future Prospects

After land, labour and capital, data ranks as the fourth factor of production. According to the US Department of Statistics, the demand for data engineers is likely to grow by 40% by 2020. If you are looking for a flourishing career option, this is the place to be: an entry-level engineer begins their career as a business analyst and then proceeds towards becoming a project manager. Later, after years of experience, these virgin business analysts further get promoted to become chief data officers.


Interested in a career in Data Analyst?

To learn more about Data Analyst with Advanced excel course – Enrol Now.
To learn more about Data Analyst with R Course – Enrol Now.
To learn more about Big Data Course – Enrol Now.

To learn more about Machine Learning Using Python and Spark – Enrol Now.
To learn more about Data Analyst with SAS Course – Enrol Now.
To learn more about Data Analyst with Apache Spark Course – Enrol Now.
To learn more about Data Analyst with Market Risk Analytics and Modelling Course – Enrol Now.

Know All about Usage-Driven Grouping of Programming Languages Used in Data Science

Know All about Usage-Driven Grouping of Programming Languages Used in Data Science

Programming skills are indispensable for data science professionals. The main job of machine learning engineers and data scientists is drawing insights from data, and their expertise in programming languages enable them to do this crucial task properly. Research has shown that professionals of the data science field typically work with three languages simultaneously. So, which ones are the most popular? Are some languages more likely to be used together?

Recent studies explain that certain programming languages are used jointly besides other programming languages that are used independently. With the survey data collected from Kaggle’s 2018 Machine Learning and Data Science study, usage patterns of over 18,000 data science experts working with 16 programming languages were analyzed. The research revealed that these languages can actually be categorized into smaller sets, resulting in 5 main groupings. The nature of the groupings is indicative of specific roles or applications that individual groups support, like analytics, front-end work and general-purpose tasks.

2

Principal Component Analysis for Dimension Reduction

In this article, we will explain how Bob E. Hayes, PhD holder, scientist, blogger and data science writer has used principal component analysis, a type of data reduction method, to categorize 16 different programming languages. Herein, the relationship among various languages is inspected before putting them in particular groups. Basically, principal component analysis looks into statistical associations like covariance within a large collection of variables, and then justifies these correlations with the help of a few variables, called components.

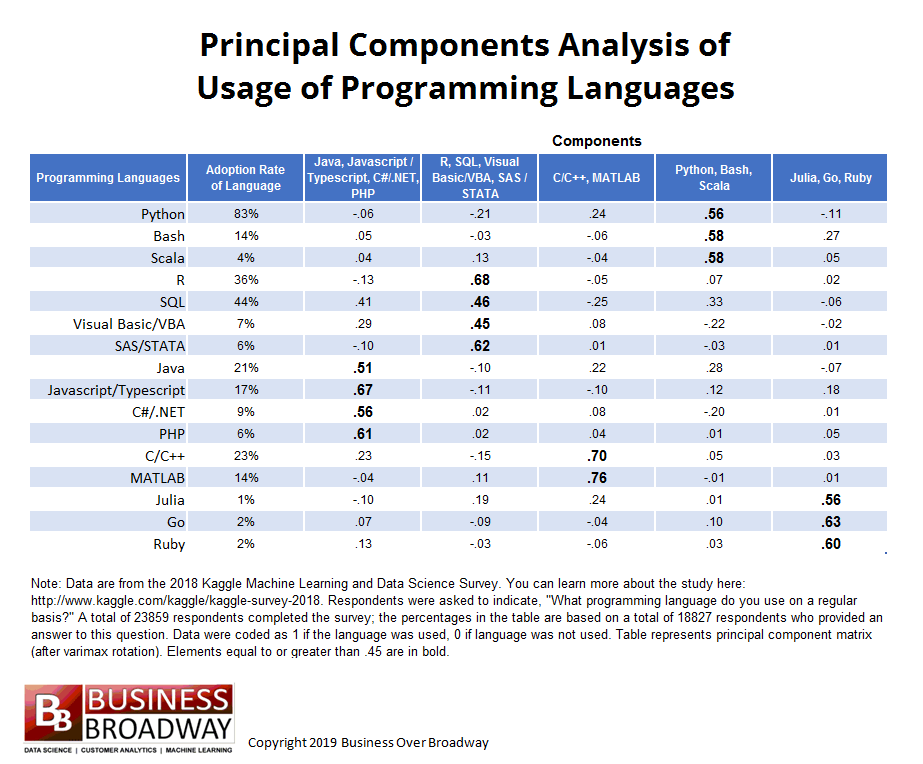
Principal component matrix presents the results of this analysis. The matrix is an nXm table, where:

n= total no. of original variables, which in this case are the number of programming languages

m= number of main components

The strength of relationship between each language and underlying components is represented by the elements of the matrix. Overall, the principal component analysis of programming language usage gives us two important insights:

  • How many underlying components (groupings of programming languages) describe the preliminary set of languages
  • The languages that go best with each programming language grouping

Result of Principal Component Analysis:

The nature of this analysis is exploratory, meaning no pre-defined structure was imposed on the data. The result was primarily driven by the type of relationship shared by the 16 languages. The aim was to explain the relationships with as less components as possible. In addition, few rules of thumb were used to establish the number of components. One was to find the number of eigen values with value greater than 1 – that number determines the number of components. Another method is to identify the breaking point in the scree plot, which is a plot of the 16 eigen values.

businessoverbroadway.com


5-factor solution was chosen to describe the relationships. This is owing to two reasons – firstly, 5 eigen values were greater than one and secondly, the scree plot showed a breaking point around 6th eigen value.

Following are two key interpretations from the principal component matrix:

  • Values greater than equal to .45 have been made bold
  • The headings of different components are named on the basis of tools that loaded highly on that component. For example, component 4 has been labeled as Python, Bash, Scala because these languages loaded highest on this component, implying respondents are likely to use Bash and Scala if they work with Python. Other 4 components were labeled in a similar manner.

Groupings of Programming Languages

The given data set is appropriately described by 5 tool grouping. Below are given 5 groupings, including the particular languages that fall within the group, meaning they are likely to be used together.

  1. Java, Javascript/Typescript, C#/.NET, PHP
  2. R, SQL, Visual Basic/VBA, SAS/STATA
  3. C/C++, MATLAB
  4. Python, Bash, Scala
  5. Julia, Go, Ruby

One programming language didn’t properly load into any of the components: SQL. However, SQL is used moderately with three programming languages, namely Java (component 1), R (component 2) and Python (component 4).

It is further understood that the groupings are determined by the functionality of different languages in the group. General-purpose programming languages, Python, Scala and Bash, got grouped under a single component, whereas languages used for analytical studies, like R and the other languages under comp. 2, got grouped together. Web applications and front-end work are supported by Java and other tools under component 1.

Conclusion:

Data science enthusiasts can succeed better in their projects and boost their chances of landing specific jobs by choosing correct languages that are suited for the job role they want. Being skilled in a single programming language doesn’t cut it in today’s competitive industry. Seasoned data professionals use a set of languages for their projects. Hence, the result of the principal component analysis implies that it’s wise for data pros to skill up in a few related programming languages rather than a single language, and focus on a specific part of data science.

For more help with your data science learning, get in touch with DexLab Analytics, a leading data analyst training institute in Delhi. Also check our Machine learning courses in Delhi to be trained in the essential and latest skills in the field.

 
Reference: http://customerthink.com/usage-driven-groupings-of-data-science-and-machine-learning-programming-languages
 

Interested in a career in Data Analyst?

To learn more about Data Analyst with Advanced excel course – Enrol Now.
To learn more about Data Analyst with R Course – Enrol Now.
To learn more about Big Data Course – Enrol Now.

To learn more about Machine Learning Using Python and Spark – Enrol Now.
To learn more about Data Analyst with SAS Course – Enrol Now.
To learn more about Data Analyst with Apache Spark Course – Enrol Now.
To learn more about Data Analyst with Market Risk Analytics and Modelling Course – Enrol Now.

How Students Select a Good Data Science Course?

How Students Select a Good Data Science Course

Data science and analytics are in hype. This time, we decided to know what students look for while arming themselves in this new age field of study. For that, we bring you Analytics India Magazine’s recent survey.

We are on an interesting endeavor to tap into the key areas that IT professionals and aspiring candidates look up to for lessening the learning gap. Ready to join us?

Disclaimer – the below opinions are from budding data scientists – from young IT employees to fresh graduates; we have compiled them and presented in a concise way. All thanks to AIM.

2

What key element to consider in a data science or analytics course?

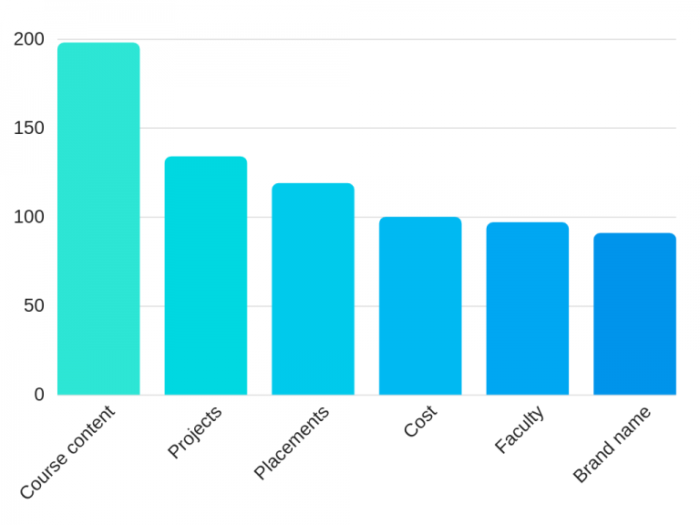
For students, there are many preconceived notions about a course’s curriculum, faculty, brand name and even fellow batch mates. No wonder, it’s always tricky to focus only on a single key element.

Nevertheless, going by the survey, the respondents voted the most for course content, only to be seconded by hands-on experience. Yes, course content is the life and soul of data science and analytics training program. But, it’s not enough, it has to be supplemented by good hands-on experience and placement opportunities.

For more,

What should be the duration of the data science or analytics course?

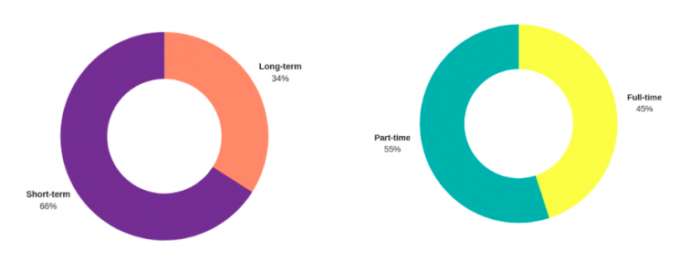
Short-term or long-term? This is a very common question plaguing the minds of interested candidates –in the recent survey, more than 66% of respondents said they would choose short-term programme over long-term, and almost 55% said that they would prefer part-time skill-training programme than full-time.

What format would you chose for data science training courses?

Always, course curriculum should be in an easy to learn format. When the expert guys at AIM asked the respondents what kind of format do they prefer for their educational course, this is what they revealed:

  • 47% or more voted for a hybrid format of education
  • 28% said they prefer online learning method
  • Less than 25% of the candidates said they would like to stick to the old-school classroom method of teaching

What about Capstone Projects and Placements?

Capstone Projects are important. 92% of respondents vouched for that.

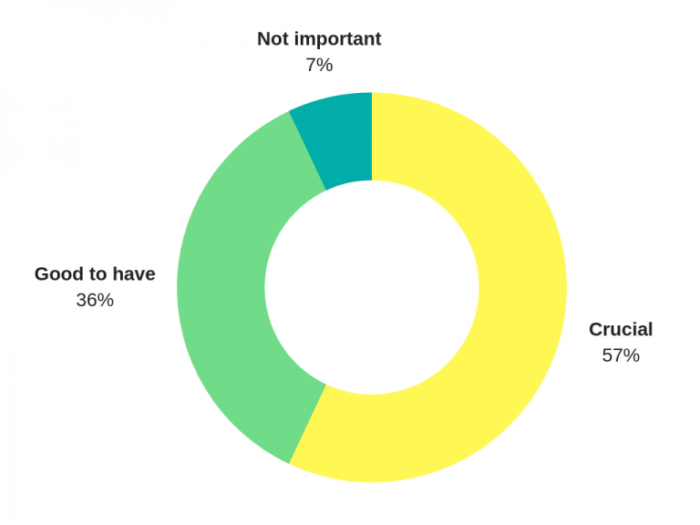
Another 57% said that placements are crucial too if you are thinking of making a mark in the competitive tech industry. Up-skilling is the key in today’s world.

When is the best time to opt for a data science course?

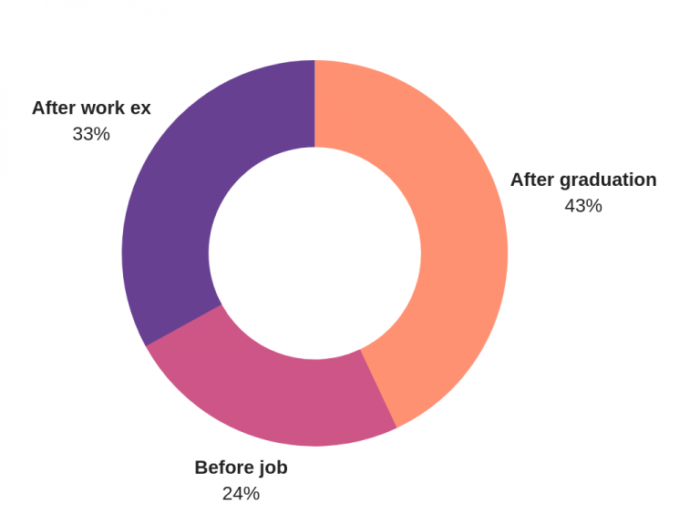
There’s nothing like the best time to enroll in a data science and analytics course. Anytime, you can start learning. However, the 43% of respondents believe that it’s better to take up business analyst training course right after graduation or post graduation.

On the other hand, 33% think that gaining some work experience prior to start training would be helpful.

For more such updates, watch this space.

If you are looking for a decent data analyst training institute in Gurgaon, DexLab Analytics fits the bill right. Drop by their site and gather information.


Interested in a career in Data Analyst?

To learn more about Data Analyst with Advanced excel course – Enrol Now.
To learn more about Data Analyst with R Course – Enrol Now.
To learn more about Big Data Course – Enrol Now.

To learn more about Machine Learning Using Python and Spark – Enrol Now.
To learn more about Data Analyst with SAS Course – Enrol Now.
To learn more about Data Analyst with Apache Spark Course – Enrol Now.
To learn more about Data Analyst with Market Risk Analytics and Modelling Course – Enrol Now.
Explaining the Job Nitty Gritty of a Data Scientist

Explaining the Job Nitty Gritty of a Data Scientist

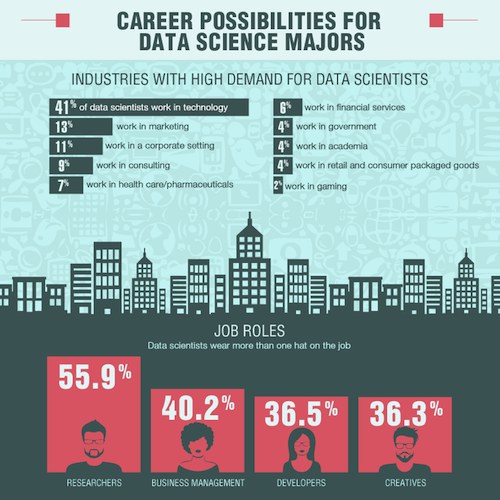
What do data scientists do? Since the inception of the term data science, we’ve heard about how it transforms all major sectors, including retail, agriculture, health, legal, telecommunications and automobile industry, but little do we know what exactly the job entails.

Following a recent DataCamp podcast DataFramed, we found out a set of key things about data scientists, and they are as follows:

2

Not only tech, but other industries are being explored

A prominent data scientist from Convoy shared insights about how their company is leveraging data science to revolutionize North American trucking industry. Then again, data science is also deemed to make a significant impact on cancer research. So, from this we can understand that data science is not only limited within the walls of technology but has started to seep through different industry verticals.

via GIPHY

It’s beyond AI and self-driving cars

Sure, deep learning and machine learning are powerful applications, but not all data scientists are lost waddling around these top notch techniques. Instead, most of the regular data scientists earn their daily bread and butter through data accumulation and cleaning, creating reports and dashboards, data viz, statistical inference, communicating and convincing decision-makers about key outcomes.

Skill evolution

“Which skill is more important for a data scientist: the ability to use the most sophisticated deep learning models, or the ability to make good PowerPoint slides?” – The latter is crucial, so is communicating results.

However, these skills are likely to change very quickly. In a very short span of time. Rapid development across diverse open-source ecosystem is evident; as a result any kind of skill or expertise is unlikely to last long.

For quick Data Science Certification, drop by DexLab Analytics.

Specialization is the key

It’s better to break down data science into three main components: Business Intelligence, which talks about pulling out data and presenting it to the right people in the form of reports, dashboards and mails; Decision Science, which is all about gathering company data and analyzing it for decision-making; and Machine Learning, which deals with the ways in which we can use data science models and put them into production.

Choosing a distinct career path is an emerging trend and it’s gaining a lot of popularity for all the right reasons.

Ethics is a driving factor

No wonder, this profession is full of uncertainty; at a time, when most of our daily interactions are influenced by algorithms designed by data scientists, what role do you think ethics play? On this context, this is what Omuji Miller, the senior machine learning data scientist at GitHub has to say:

‘We need to have that ethical understanding, we need to have that training, and we need to have something akin to a Hippocratic oath. And we need to actually have proper licenses so that if you actually do something unethical, perhaps you have some kind of penalty, or disbarment, or some kind of recourse, something to say this is not what we want to do as an industry, and then figure out ways to remediate people who go off the rails and do things because people just aren’t trained and they don’t know.’

Soon, we’re approaching a state where the need to maintain ethical standards would come from within data science itself and advocates, legislators and other stakeholders. Hope this consensus comes soon.

The data science revolution is quite the order of the day, and it’s going to stay for a while. So, if you want to ace up your data skills, we’ve superior Data Science Courses in Delhi. Just, visit our website and pore over our course offerings.


The blog has been sourced from — hbr.org/2018/08/what-data-scientists-really-do-according-to-35-data-scientists


Interested in a career in Data Analyst?

To learn more about Data Analyst with Advanced excel course – Enrol Now.
To learn more about Data Analyst with R Course – Enrol Now.
To learn more about Big Data Course – Enrol Now.

To learn more about Machine Learning Using Python and Spark – Enrol Now.
To learn more about Data Analyst with SAS Course – Enrol Now.
To learn more about Data Analyst with Apache Spark Course – Enrol Now.
To learn more about Data Analyst with Market Risk Analytics and Modelling Course – Enrol Now.
Fundamental Concepts of Statistics for Data Science Beginners- Part One

Fundamental Concepts of Statistics for Data Science Beginners- Part One

Do you aspire to be a data scientist? Then is it essential that you have a solid understanding of the core concepts of statistics. Everyone doesn’t have a Ph.D. in Statistics. And that isn’t the only way to excel in the field of data science. But yes, knowing stats well is a prerequisite for data science.

Nowadays, popularly used libraries, like Tesorflow, liberate the user from the intricacies of complex mathematics. Still, it is advisable to be familiar with the fundamental principles on which they work, because that will enable you to use the libraries better.

In this blog, we attempt to shed light on some basic concepts, theorems and equations of statistics for data science.

Statistical Distributions:

Statistical distributions are important tools that you must arm yourself with to be a skilled data scientist. Here, we shall talk about two important distributions, namely Poisson distribution and Binomial distribution.

Poisson distribution:
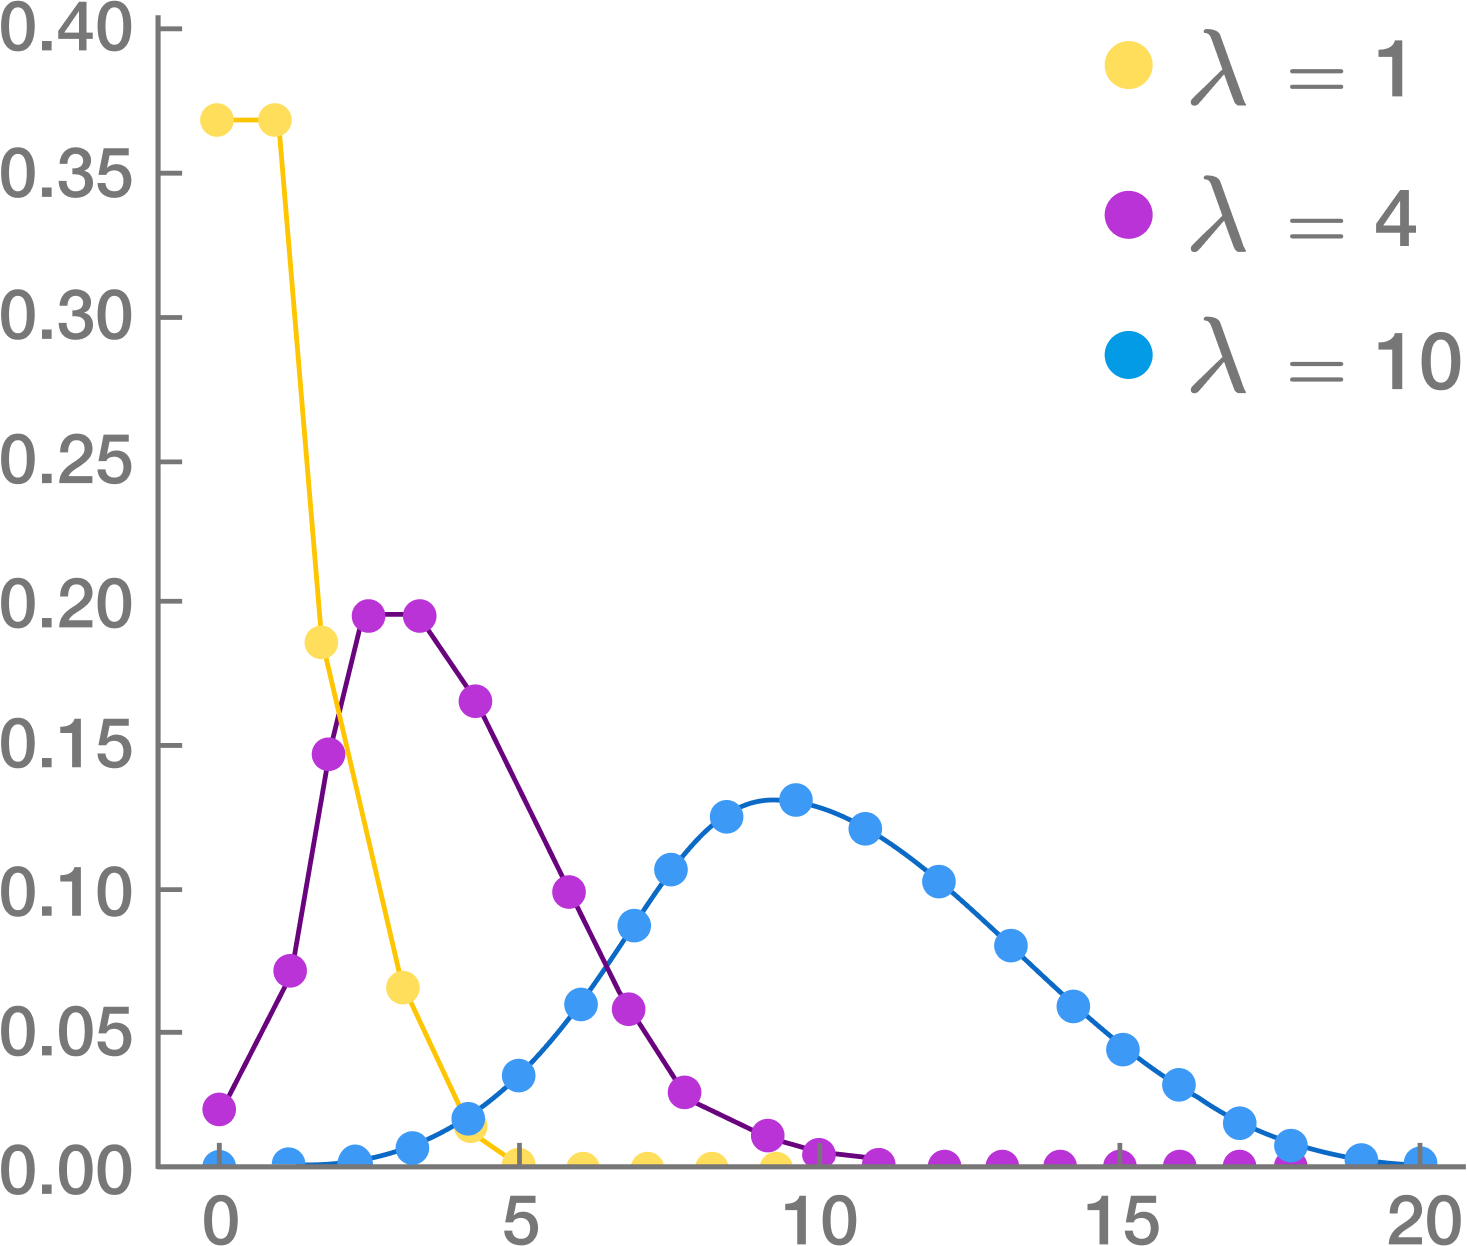
This distribution is used to find out the number of events that are expected to occur during an interval of time. For example, the number of page views in one second, the number of phone calls in a particular period of time, number of sales per hour, etc.

The symbols used in the equation are:

x: exact number of successes

e: constant equal to 2.71828 approximately

λ: average number of successes per time interval

Poisson distribution is used for calculating losses in manufacturing. Let us consider that a machine generates metal sheets that have ‘x’ flaws per yard. Suppose the error rate is 2 per yard of sheet (λ). Applying this information to Poisson distribution, we can calculate the probability of having exactly two errors in a yard.

Source: Brilliant.org

Poisson distribution is used for faster detection of anomalies.

Binomial distribution:

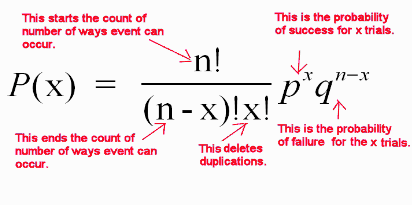
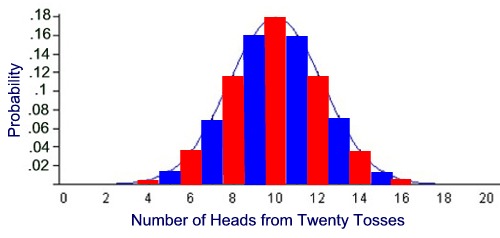
This is a very common distribution in Statistics. Suppose you have flipped a coin thrice. Using basic combinatorics for flipping a coin thrice, we see that there are eight combinations possible. We find out the probabilities of getting 0, 1, 2 or 3 heads and plot this on a graph. This gives us the binomial distribution for this particular problem. It must be remembered that Binomial distribution curve is similar to a Normal distribution Curve. Normal distribution is used when values are continuous and Binomial distribution is used for discrete values.

Source: mathnstuff.com

Binomial distribution is a discrete probability distribution where number of trials is predetermined and there are two possible outcomes– success and failure, win or lose, gain or loss. Depending on a few conditions, like the total number of trails is large, the probability of success is near 1 and the probability of failure is near 0, the trails are independent and identical, etc., the binomial distribution is approximated to a normal distribution.

Source: MathBitsNotebook

Binomial distribution has many applications in business. For example, it is estimated that 5% of tax returns for individuals with high net worth in USA is fraudulent. These frauds might be uncovered through audits. Binomial distribution is used to find out for ‘n’ number of tax returns that are audited, what is the probability for say 5 fraudulent returns to be uncovered.

There are some more probability distributions, like Bernoulli and Geometric distributions. We shall cover that and more in the following blogs. So, stay tuned and follow DexLab Analytics. The experts here offer top-quality data science courses in Delhi. Go through the data science certification details right now!


References:

upgrad.com/blog/basics-of-statistics-for-data-science

anomaly.io/anomaly-detection-poisson-distribution

analyticsvidhya.com/blog/2017/09/6-probability-distributions-data-science


Interested in a career in Data Analyst?

To learn more about Data Analyst with Advanced excel course – Enrol Now.
To learn more about Data Analyst with R Course – Enrol Now.
To learn more about Big Data Course – Enrol Now.

To learn more about Machine Learning Using Python and Spark – Enrol Now.
To learn more about Data Analyst with SAS Course – Enrol Now.
To learn more about Data Analyst with Apache Spark Course – Enrol Now.
To learn more about Data Analyst with Market Risk Analytics and Modelling Course – Enrol Now.
Here’s How Technology Made Education More Enjoyable and Interactive

Here’s How Technology Made Education More Enjoyable and Interactive

Technology is revamping education. The entire education system has undergone a massive change, thanks to technological advancement. The institutions are setting new goals and achieving their targets more effectively with the help of new tools and practices. These cutting edge methods not only enhances the learning approach, but also results in better interaction and fuller participation between teachers and students.

The tools of technology have turned students into active learners; they are now more engaged with their subjects. In fact, they even discover solutions to the problems on their own. The traditional lectures are now mixed with engaging illustrations and demonstrations, and classrooms are replaced with interactive sessions in which students and teachers both participate equally.

Let’s take a look at how technology has changed the classroom learning experience:

Online Classes

No longer, students have to sit through a classroom all day. If a student is interested in a particular course or subject, he or she can easily pursue degrees online without going anywhere. The internet has made interactions between students and teachers extremely easy. From the comfort of the home, anyone can learn anything.

DexLab Analytics offers Data Science Courses in Noida. Their online and classroom training is over the top.

Free educational resources found online

The internet is full of information. From a vast array of blogs, website content and applications, students as well as teachers can learn anything they desire to. Online study materials coupled with classroom learning help the students in strengthening their base on any subject as they get to learn concepts from different sources with examples and practice enough problems. This explains why students are so crazy for the internet!

2

Webinars and video streaming

The facilitators and educationists are nowadays looking up to video streaming to communicate ideas and knowledge to the students. Videos are anytime more helpful than other digital communications; they help deliver the needful content, boosting the learning abilities among the learners, while making them understand the subject matter to the core. Webinars (seminars over the web) replaces classroom seminars; teachers look up to new methods of video conferencing for smoother interaction with the students.

Podcasts

Podcasts are digital audio files. Users can easily download them. They are available over the internet for a bare subscription fee. It’s no big deal to create podcasts. Teachers can easily create podcasts that syncs well with students’ demand, thus paving a way for them to learn more efficiently. In short, podcasts allow students a certain flexibility to learn from anywhere, anytime.

Laptops, smartphones and tablets

For a better learning experience overall, both students and teachers are looking forward to better software and technology facilities. A wide number of web and mobile applications are now available for students to explore the wide horizon of education. The conventional paper notes are now replaced with e-notes that are uploaded on the internet and can be accessible from anywhere. Laptops and tablets are also used to manage course materials, research, schedules and presentations.

No second thoughts, by integrating technology with classroom training, students and teachers have an entire world to themselves. Sans the geographical limitations, they can now explore the bounties of new learning methods that are more fun and highly interactive.

DexLab Analytics appreciates the power of technology, and in accordance, have curated state of the art Data Science Courses that can be accessed both online and offline for students’ benefit. Check out the courses NOW!


The article has been sourced from – http://www.iamwire.com/2017/08/technology-teaching-education/156418


Interested in a career in Data Analyst?

To learn more about Data Analyst with Advanced excel course – Enrol Now.
To learn more about Data Analyst with R Course – Enrol Now.
To learn more about Big Data Course – Enrol Now.

To learn more about Machine Learning Using Python and Spark – Enrol Now.
To learn more about Data Analyst with SAS Course – Enrol Now.
To learn more about Data Analyst with Apache Spark Course – Enrol Now.
To learn more about Data Analyst with Market Risk Analytics and Modelling Course – Enrol Now.
How Blockchain Technology is Transforming these Four Popular Industries

How Blockchain Technology is Transforming these Four Popular Industries

Blockchain technology is the next big thing. It is defying industry norms and altering the manner in which industries implement new projects. The decentralized nature of blockchain technology is the key to its success. Blockchain is transforming every organization through its secure and decentralized protocols, protected peer-to peer applications, and a new approach towards distributed management.

Here are some everyday industries that blockchain technology is revamping.

  • Finance:

There are all kinds of opinions regarding how cryptocurrency is impacting macroeconomics pertaining to the financial sector. The rapidly increasing demand for Bitcoin signals a flourishing future for cryptocurrency. In 2017, ICOs (Initial Coin Offerings), which are means of crowd funding centered on cryptocurrency, raised more money than venture capital investments. Cryptocurrencies, like Bitcoin, Ethereum and Ripple are improving their speed for processing transaction fees, and will be able to contend with speed of transaction for credit card companies in the near future. Bitcoin permits people to transfer money across borders instantaneously and at low costs. Many banks, such as Barclays, are set to use blockchain technology to facilitate speedier business procedures.

2

  • Cloud Computing:

The evolution of cloud has outmoded hard drives, which was the popular choice for transferring files from one computer to another, even a few years ago. Blockchain-based companies, like Akash, want to seize this opportunity and create an open market place where cloud computing costs are determined by demand and supply, instead of centralized, fixed prices. Most large-scale data centers depend on idle computing power. Akash Network makes idle server capacity available for cloud deployments. This system enables users to ‘’rent’’ idle computing power and providers to generate revenue from their idle power. Developers specify their deployment conditions in a file that is posted on the Akash blockchain. Providers capable of fulfilling these conditions bid on it. Low bid wins; after this parties go off chain to allocate workload in Docker containers. Akash tokens are then transferred from tenant‘s wallet to provider’s wallet.

  • Online Gaming:

The online sports industry is embracing the blockchain technology. An increasing number of developers in the world of e-Sports are employing blockchain technology and cryptocurrencies. Leading fantasy sport companies, like MyDFS, permit their users to create virtual arrays of real players and obtain winnings through tokens. In-app purchase is the newest monetization model for Smartphone app games. Blockchain technology is also advantageous for e-Sports betting platforms. The tech constructs a secure environment for low fee betting that is free from the control of a central party.

  • Decentralized Governance:

One of the most famed features of blockchain is decentralization. The thought of decentralized, autonomous organizations is no doubt very fascinating, but they are very difficult to establish. A hierarchical structure, where one person or group tends to dominate, is very natural. However, new and advanced frameworks are facilitating decentralized platforms to function effectively. An example of such a framework is DAOstack, which is striving to build a platform that enables collectives to self-organize around similar goals and interests. It is a platform that authorizes emerging organizations to select suitable governance model that will work for them and execute the same through DAOstack’s technological protocol. DAOstack’s founding principle is collaboration- it aims to provide a setting where goals of individuals can work in harmony with goals of a group.

The ‘’blockchain boom’’ is driving breakthroughs for a range of industries. This is just the beginning, though. As this tech evolves, it will enable rapid progress across every industry.

To read more blogs on emerging technologies, follow DexLab Analytics; it is a premier institute providing data science certification courses in Delhi. Do take a look their data analytics certification courses.


Interested in a career in Data Analyst?

To learn more about Machine Learning Using Python and Spark – click here.

To learn more about Data Analyst with Advanced excel course – click here.
To learn more about Data Analyst with SAS Course – click here.
To learn more about Data Analyst with R Course – click here.
To learn more about Big Data Course – click here.

Call us to know more