data science online learning Archives - Page 11 of 11 - DexLab Analytics | Big Data Hadoop SAS R Analytics Predictive Modeling & Excel VBA

Secrets To Clinch Victory in Global Data Science Competitions

Data scientists are often perceived as crazy IT nerds who would use formulas and algorithms to even determine how many teaspoons of sugar to put in their tea! Well, we would not argue about this, as much as stereotypical this may sound, but a data scientist feels a rush when he solves a problem with calculations, analysis and logic; a rush that incomparable to anything else.

 
Secrets To Clinch Victory in Global Data Science Competitions


Just as an avid gamer who plays COD (Call of Duty) or CS (Counter Strike) waits for WCG (World Cyber Games). A data analyst waits for – Datahack. People who are just crazy about machine learning wait for the whole year to participate in Datahack. For them this is Olympics of Data Analysis. Continue reading “Secrets To Clinch Victory in Global Data Science Competitions”

Prepare For Your Data Science Job Interview With Answers to These Puzzles

Prepare For Your Data Science Job Interview With Answers to These Puzzles

You may have passed your data science certification course with flying colours, but getting your first break in an analytical job role can be quite difficult. Did you know that more than 30 percent of top tier analytical firms evaluate and select their candidates on their ability to solving puzzles? After all this is the best way to determine that they are logical, with ample creative thinking abilities and are definitely pros at dealing with numbers (a skill must have for data personnel).

The companies are keen on hiring people who have the ability to bring a unique perspective in solving business problems. Such individuals are capable of to offer their hiring firms with a huge advantage over other candidates. But to garner such capabilities an individual must practice regularly with consistent efforts.

As fellow data analysts, we recommend that you develop a daily habit of solving puzzles. They are mental exercises which on disciplined training will help you to get better with time. When employed in a job role that involves having to deal with complex problems everyday such a skill will prove to be an asset.

Are you ready to work out your grey matter cells? Here are the most common puzzles asked at interviews for data science positions:

These questions have been asked to candidates at companies like Amazon, Google, Goldman Sachs, and JP Morgan etc.

Note: Try solving these problems on your own before checking the solution, and feel free to share your logic behind the solutions in the comments below. We are all ears eyes to see how unique someone’s mind can be!

Puzzle #1:

Blind game challenge:

You have been placed in a dark room, there is a table kept in the room. The table has 50 coins atop its surface, out of these 50 coins 10 coins have their tails side up and 40 coins have their heads side up. Your task is to divide this set of 50 coins into 2 groups (not necessarily of equal size) so that both the groups have equal numbers of coins with the tails side up.

Solution #1:

The coins should be divided into two groups one with 40 coins and one with 10 coins, then flip all the coins in the group with 10 coins.

Puzzle #2:

Bag of coins problem:

You have been given 10 bags full of coins; each bag comes with an infinite number of coins. But there is a twist, one of the bags is full of forged coins but sadly you do not remember which one it is. But you do know that the weight of the real coins are 1 gram and those which are forged are 1.1 gram. Your task is to identify the bags in minimum readings with a digital weighing machine that has been provided with you.

2

Solutions #2:

You need to take 1 coin from the first bag, 2 coins from the second bag, and 3 coins from the third bag and so on and so forth. Eventually you will end up with 55 coins in total (1+2+3+4+…10). The next step is to weigh all the 55 coins together. You can identify which bag has the forged coins based on the final reading of the weighing machine. For instance, if the reading ends with 0.4 then it is the fourth bag with forged coins. And if it comes 0.7 then it is the 7th bag with the forgeries.

Puzzle #3:

The Sand timer trouble:

You have two hourglasses or sand timers one of which can show 4 minutes and the next one can show 7 minutes respectively. Your job is to use both the sand times (either one at a time or simultaneously or in any other combination) and measure a time of 9 minutes.

Solution #3:

Step 1: start the 7 minute sand timer along with the 4 minute sand timer

Step 2: when the 4 minute sand timer ends turn it upside down instantaneously

Step 3: when the 7 minute sand time ends also turn it down at that instant

Step 4: when the 4 minute sand timer ends turn the 7 minute sand timer upside down and it will have 1 minute worth of sand in it

Thus, effectively 8 + 1 = 9

In closing thoughts:

Hope these questions were enough to get your brain rolling, while a lot of these questions may seem challenging to most of the people, but with a little out-of-the-box analytical thinking you will soon discover that they are not too difficult to solve.

If these questions were simple enough for you, we have plenty more with increasing difficulty. And if all these brain picking has left you overwhelmed to the peak and all you want is to solve real-world data problems, then follow our regular social media uploads advertising latest job openings in the field of data science.

DexLab Analytics is a premier data science training institute in Gurgaon that offers program centric courses. Their online certification course on data science is stellar, come check out the course itinerary now.
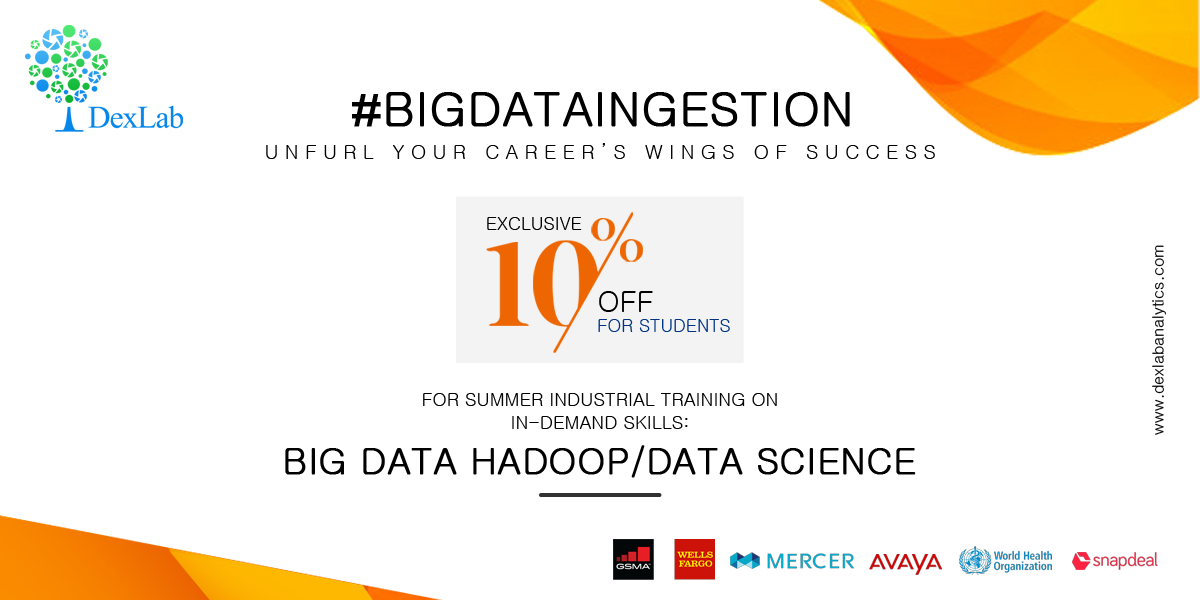
DexLab Analytics Presents #BigDataIngestion

DexLab Analytics has started a new admission drive for prospective students interested in big data and data science certification. Enroll in #BigDataIngestion and enjoy 10% off on in-demand courses, including data science, machine learning, hadoop and business analytics.


Interested in a career in Data Analyst?

To learn more about Data Analyst with Advanced excel course – Enrol Now.
To learn more about Data Analyst with R Course – Enrol Now.
To learn more about Big Data Course – Enrol Now.

To learn more about Machine Learning Using Python and Spark – Enrol Now.
To learn more about Data Analyst with SAS Course – Enrol Now.
To learn more about Data Analyst with Apache Spark Course – Enrol Now.
To learn more about Data Analyst with Market Risk Analytics and Modelling Course – Enrol Now.

India Will Lead in Analytics Services:

Today is a time when each day is witnessing the field of analytics gets more and more pervasive. It is helping other fields and sectors to achieve more. At a time like this our nation is expected to maintain its ground over other major offshore destinations such as Philippines, China, Eastern Europe and Latin America as per a recent survey.


A host of factors will drive the demand for this service from India. They are – availability of talent pool, industry maturity and a wide spectrum of services which was reported by the survey that was conducted by Avendus Capital which is a financial services company. Continue reading “India Will Lead in Analytics Services:”

Most Commonly Asked Tableau Interview Questions

Most Commonly Asked Tableau Interview Questions

In the near future, the world’s data generation will nearly double in amount than what it is now. According to a survey conducted by the IDC (International Data Corporation) by 2020 we will generate 50 times more data than in 2011. Now that such a gargantuan amount of data will be generated which will come with real-world business implications, thus, businesses around the world will require tools which should be capable to analyze this data and gather actionable insights from them. Tableau is a tool that helps organizations do exactly that, i.e. data mining and visualizing business opportunities to take requisite actions for amplifying revenue generation. So, it is understandable that the demand for personnel proficient in Tableau is expected to rise by manifolds in the next few years.

So, we India’s leading Tableau training institute have compiled a list of the most commonly asked interview questions for a position of Tableau operator/executive in this post. If you have more such questions that you have recently come across in an interview and would like to know the answer feel free to drop them in the comments below and our data science training faculty will get to them ASAP. And if you would like to take up a Tableau Certification course or take up an online Tableau training check out our curriculum on Tableau BI Certification.

2

Common interview questions on Tableau:

  • Do you know the difference between Live Data and Extract Data in Tableau?

The best answer to this question: An ‘extract’ connection is a connection with a static database, which is refreshed every day/hour/period. In this case all data are copied from the data source to the Tableau Server. Refreshing the data source will not give you the latest data – you have to refresh the extract to get them.

A live connection will query the underlying data in the data source/database – refreshing the visualization will give you the latest results. In this case no data is copied to Tableau Server for pre-processing.

• Name a few of the different types of filters used in tableau.

The best answer to this question:

The 3 types of Filters in Tableau are:
1) Quick Filter
2) Data Source Filter
3) Context Filter

  • Can you tell me the difference between parameters and filters in Tableau?

The best answer to this question: The difference actually lies in the application. Parameters allow users to insert their values these can be float, integers, string, date that can be used in calculations. However, filters receive only values users choose to ‘filter by’ the list this cannot be used to perform calculations.

Users can dynamically change measures and dimensions in parameter but filters do not support of this feature.

  • How will you view underlying SQL Queries in Tableau?

The best answer to this question: Viewing underlying SQL Queries in Tableau can be done in two ways:

• Create a Performance Recording, to register performance information about the main events you interact with workbook. Users can view the performance metrics in a workbook created by Tableau.

Help> Settings and Performance> Start Performance Recording
Help> Setting and Performance > Stop Performance Recording

• Reviewing the Tableau Desktop Logs located at C:\Users\\My Documents\My Tableau Repository. For live connection to data source, you can check log.txt and tabprotosrv.txt files. For an extract, check tdeserver.txt file.

  • Do you know the difference between .(dot) twb and .(dot) twbx?

The best answer to this question: The .(dot) twb is the most common file extension used in Tableau, which presents an XML format file and comprises all the data present in each dashboard and sheet like what fields are used in the views, styles and formatting that are applied to a sheet and dashboard.

But this workbook does not contain any data. The Packaged Workbook merges the data in a Tableau workbook with the local data available (which is not on server). A. (dot) twbx serves as a zip file this includes custom images if any. Packaged Workbook allows users to share their workbook information with other Tableau Desktop users and let them open it in Tableau Reader.

  • How many maximum tables can you join in Tableau?

The best answer to this question: A maximum number of 32 tables can be joined in Tableau. A table size must also be limited to 255 columns (fields).

Here were the answers to the most commonly asked Tableau interview questions, for more such interesting data analytics news, job updates and discussions follow our daily uploads from DexLab Analytics. We have recently launched our new branch in Pune, so, now Maharashtrians can also get their data analytics certification from DexLab Analytics, we add values to dull data!

Best of luck for your Tableau interview!


Interested in a career in Data Analyst?

To learn more about Data Analyst with Advanced excel course – Enrol Now.
To learn more about Data Analyst with R Course – Enrol Now.
To learn more about Big Data Course – Enrol Now.

To learn more about Machine Learning Using Python and Spark – Enrol Now.
To learn more about Data Analyst with SAS Course – Enrol Now.
To learn more about Data Analyst with Apache Spark Course – Enrol Now.
To learn more about Data Analyst with Market Risk Analytics and Modelling Course – Enrol Now.

Aspiring Data Analysts Must Know the Answer to These Interview Questions

Aspiring data analysts must know the answer to these interview questions

You have recently completed Data analyst certification and are hunting vigorously for a job as a data scientist. But the prospect of sitting for such an important job role at a corporate firm in front of a room full of C-suite interviewers is an intimidating prospect. But fear not as we at DexLab Analytics have got you covered both inside the class room as well out.

This megatrend on Big Data analysts started first in 2013, when the leading universities of the world began to realize the gap in between the demand and supply of Big Data professionals. And soon several , Data analyst training institutes cropped up here and there and rooms transformed into classrooms with several students being keen to learn about the steps to handle Big Data  and to join the ranks of data scientists which is a highly sought after profession of these days. Continue reading “Aspiring Data Analysts Must Know the Answer to These Interview Questions”

Infographic: List of Our Courses from Dexlab Analytics

infographic6


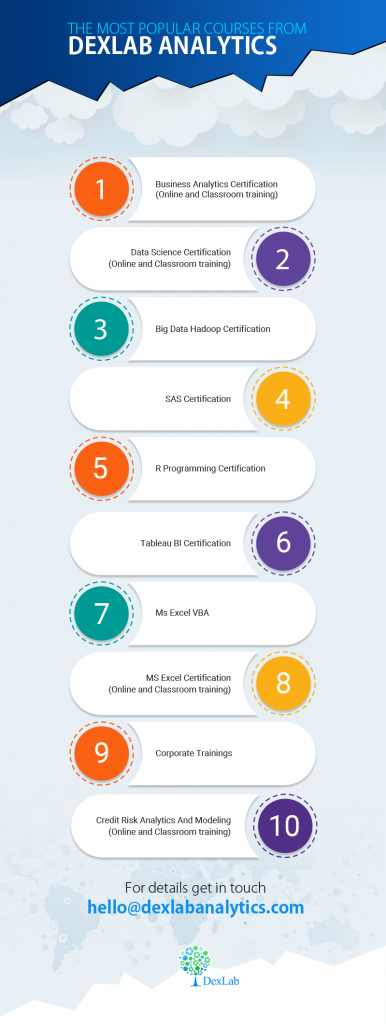
View our infographic on the list of most in-demand courses among data enthusiasts who want to advance their careers with the top trends in the job market. Come to DexLab Analytics and launch your career in light speed with the requisite skills to harness the power of data.


Our Courses: MS Excel, Data Science, Business Analytics

Trending Data Job Role: Chief Data Officer

Trending data job role: Chief Data Officer

Financial firms are going berserk in order to employ the best Chief Data Officers from around the world. This is the new hype in the C-suite world who wants to manage risks associated with data and also grasp its opportunities for conducting better business.

These days all financial firms are sincerely focused on maintaining their data and governing them to comply with the latest rules and regulations. They want to comply with customer demands to maintain their competitive edge and stay on top of the game. And in order to maintain this, the financial services teams are on a hyper drive in hiring the C-suite role of a Chief Data Officer i.e. CDO.

Recent developments in the regulatory mandates of Volcker Rule of the Dodd-Frank Act in relation to capital planning have made it difficult for financial organizations to aggregate and manage their data. In a recent stress test a large number of major US corporate banks and other financial institutions have failed as the quality of their data was not up to scratch.

But expert data analyst and scientists state that only regulatory compliance is not the main issue at hand. Effective risk management goes hand-in-hand with efficient data management. And firms are lacking that front as they do not manage their data effectively and are simply gambling with chances of a hug penalty at the risk of losing customers and acquiring a bad name in the business.

2

The opportunities in this position of Chief Data Officer:

While the aspects of regulatory compliance and risk management are becoming more and more complex every day, but that is not the only reason to move up information management positions and invite them into the boardroom. That is why as most financial organizations know that good governance requires strong data management skills with good understanding of architecture and analytics. Companies have come to realize that this kind of information can prove to be effective and provide them with competitive advantage in terms of reaching out to customers and protecting them with the offering of innovative products and services.

According to latest research, experts predicted that 25 percent of every financial organization will have employed a Chief Data Officer by the end of 2015. The job responsibility of this role is still clouded and most organizations are trying to refine and boil it down, but as of now three main roles have been identified – data governance, data analysis and data architecture and technology. While according to this survey 77 percent of the CDOs will remain focused in governance focused but their responsibilities are likely to grow into other areas as well. The main objective behind data architecture is to oversee how data is sourced, integrated and then consumed in the global organizations. The way to lead efficiencies in this respect is to consider this aspect in depth. Thus, it can be concluded that data analytics has the most potential.

For more details on Online Certificate in Business Analytics, visit DexLab Analytics. Their online courses in data science are up to the mark as per industry standards. Check out the course module today.

DexLab Analytics Presents #BigDataIngestion

DexLab Analytics has started a new admission drive for prospective students interested in big data and data science certification. Enroll in #BigDataIngestion and enjoy 10% off on in-demand courses, including data science, machine learning, hadoop and business analytics.


Interested in a career in Data Analyst?

To learn more about Machine Learning Using Python and Spark – click here.
To learn more about Data Analyst with Advanced excel course – click here.
To learn more about Data Analyst with SAS Course – click here.
To learn more about Data Analyst with R Course – click here.
To learn more about Big Data Course – click here.

How Data Scientists Take Their Coffee Every Morning

How Data Scientists Have Their Coffee

To a data scientist we are all sources of data, from the very moment we wake up in the morning to visit our local Starbucks (or any other local café) to get our morning coffee and swipe the screen of our tablets/iPads or smart phones to go through the big headlines for the day. With these few apparently simple regular exercises we are actually giving the data scientists more data which in-turn allows them to offer tailor-made news articles about things that interest us, and also prepares our favorite coffee blend ready for us to pick up every morning at the café.

The world of data science came to exist due to the growing need of drawing valuable information from data that is being collected every other day around the world. But is data science? Why is it necessary? A certified data scientist can be best described as a breed of experts who have in-depth knowledge in statistics, mathematics and computer science and use these skills to gather valuable insights form data. They often require innovative new solutions to address the various data problems.

Data Science: Is It the Right Answer? – @Dexlabanalytics.

As per estimates from the various job portals it is expected that around 3 million job positions are needed to be fulfilled by 2018 with individuals who have in-depth knowledge and expertise in the field of data analytics and can handle big data. Those who have already boarded the data analytics train are finding exciting new career prospects in this field with fast-paced growth opportunities. So, more and more individuals are looking to enhance their employability by acquiring a data science certification from a reputable institution. Age old programs are now being fast replaced by new comers in the field of data mining with software like R, SAS etc. Although SAS has been around in the world of data science for almost 40 years now, but it took time for it to really make a big splash in the industry. However, it is slowly emerging to be one the most in-demand programming languages these days.What a data science certification covers?

Tracing Success in the New Age of Data Science – @Dexlabanalytics.

This course covers the topics that enable students to implement advanced analytics to big data. Usually a student after completion of this course acquires an understanding of model deployment, machine language, automation and analytical modeling. Moreover, a well-equipped course in data science helps students to fine-tune their communication skills as well.

Keep Pace with Automation: Emerging Data Science Jobs in India – @Dexlabanalytics.

Things a data scientist must know:

All data scientists must have good mathematical skills in topics like: linear algebra, multivariable calculus, Python and linear algebra. For those with strong backgrounds in linear algebra and multivariable calculus it will be easy to understand all probability, machine learning and statistics in no time, which is a requisite for the job.

More and more data-hungry professionals are seeking excellent Data Science training in Delhi. If you are one of them, kindly drop by DexLab Analytics: we are a pioneering Data Science training institute. Peruse through our course details for better future.


Interested in a career in Data Analyst?

To learn more about Data Analyst with Advanced excel course – Enrol Now.
To learn more about Data Analyst with R Course – Enrol Now.
To learn more about Big Data Course – Enrol Now.

To learn more about Machine Learning Using Python and Spark – Enrol Now.
To learn more about Data Analyst with SAS Course – Enrol Now.
To learn more about Data Analyst with Apache Spark Course – Enrol Now.
To learn more about Data Analyst with Market Risk Analytics and Modelling Course – Enrol Now.

Quantitative Analysis 1 – Five Number Summary

To be a successful analyst or be a part of great analytics team, there are 3 important dimensions one would aspire to be or have. They are technical, business and tools. Hence, we would begin with one of the sub dimension of the technical skills, i.e. being quantified self or developing quantitative skills.

 Quantitative Analysis 1 – Five Number Summary

As per the Informs, the definition of Analytics shall be:

  Continue reading “Quantitative Analysis 1 – Five Number Summary”

Call us to know more