data science online learning Archives - Page 10 of 11 - DexLab Analytics | Big Data Hadoop SAS R Analytics Predictive Modeling & Excel VBA

Harnessing Big Data for Water Management

World Water Day: Save Water with Big Data

Appalling forces are re-establishing the relationship between humans and water.

In the past, communities developed slowly, while the weather remained constant. Water sources never depleted at tumultuous rates as it has today. Water is no longer a dependable resource. That’s why many countries and cities are embracing smart technologies to manage water efficiently and preserve it for the coming generations.

As we observe the United Nations World Water Day on Wednesday, 22nd March, it is apt to assess the development being made in conserving this diminishing resource.

World-Water-Day-Save-Water-Save-Water-Save-Nature

 Today, the Internet of Things (IoT) – a blooming worldwide network of devices and appliances linked to the internet – has materialized as a propitious solution to save water and protect clean drinking water, especially in cities.  

To begin our discussion, Netherlands is on its way to develop a pioneering program to address the relevant problems of increasing sea levels, surging number of droughts and the effect of extreme weather changes on its trains, bus networks and roadways, and the efficiency with which the entire nation tackles situations like this. The ambitious project, Digital Delta draws in local and regional water jurisdictions, top-notch scientists and proliferating businesses to implement Big Data technology for upgrading the systems of its €7 billion water management, while restricting the costs of preserving water by 15%.

Prophecies about Urban Centres
data_flow

Plummeting freshwater resources: a serious challenge faced by the global population is now at its apex. An overwhelming 89 percent of the world population thrives on enhanced water supply systems, which results in a loss of more than 32 billion cubic meters of fresh water, through physical leakage. Thereby, more than 50 percent of world population will be vulnerable in water-stressed regions by 2025. And by 2040, the figures will further push the energy demand by 56%, making US the second highest energy consumer across the globe.

Saving Water Globally

In the meantime, most of the world cities should re-invent and re-structure their assets to pull together advanced functions encompassing different complex systems and to associate with new powerful allies. Urbanization comes with its own costs. Day by day, these networks are growing more complicated and even more expensive. By delving deeper into the interconnections of systems, the societies will be in a better position to grasp how to run them more efficiently.

Water has never grabbed eyeballs, as it has today. Many countries are not at all prepared to manage such burgeoning complexities of water management. Besides, water management authorities are constantly under pressure to harness their power for flood protection and drinking water standards.

Reality Check: Water demand is set to rise by 30% by 2030. Ever increasing population and swelling urbanization are the reasons behind such calamitous figures.

Smart City Technology – The Key to Urban Sustainability

AAEAAQAAAAAAAAgTAAAAJDllNmM3YjJmLWI3NTEtNDkxNS05MWYxLTYxMTM3OTUyZGE2OQ

New Jersey Institute of Technology (NJIT) revealed that by 2025 smart city technologies would multiply to an industry estimating $27.5 billion. Moreover, nearly 88 smart cities will develop by the end of 2025. Smart cities whirl around the concept of using improved, interconnecting technologies to make environment safe, lives easier and urban living cost-effective and more efficient.

Societies are enduring new weather extremes. It is the high time to use big data and analytical science to cure the growing complexities in managing our water systems. Smart technology is the only viable option that can take future generations towards a sustainable future.

Seeking data science courses online? Visit us at DexLab Analytics. We offer a wide array of highly interactive online courses in data science.


Interested in a career in Data Analyst?

To learn more about Data Analyst with Advanced excel course – Enrol Now.
To learn more about Data Analyst with R Course – Enrol Now.
To learn more about Big Data Course – Enrol Now.

To learn more about Machine Learning Using Python and Spark – Enrol Now.
To learn more about Data Analyst with SAS Course – Enrol Now.
To learn more about Data Analyst with Apache Spark Course – Enrol Now.
To learn more about Data Analyst with Market Risk Analytics and Modelling Course – Enrol Now.
Knock! Knock! It’s Time to Change Your Bad Data Habits

Knock! Knock! It’s Time to Change Your Bad Data Habits

Do you follow your instincts instead of data and insights?

Do you prefer storing data in different databases, in separate formats with varying values?

Habits are subject to change. Though it may take some time, but eventually it evolves. Good and bad habits make a person. Good habits don’t demand attention, but bad habits often need to be looked into.

If you suffer from bad data habits, then you must make sure you deal with it. It has to be a thing from your past rather than a dominating present. After all, data is incredibly important for business organizations to proliferate and generate decent revenues.


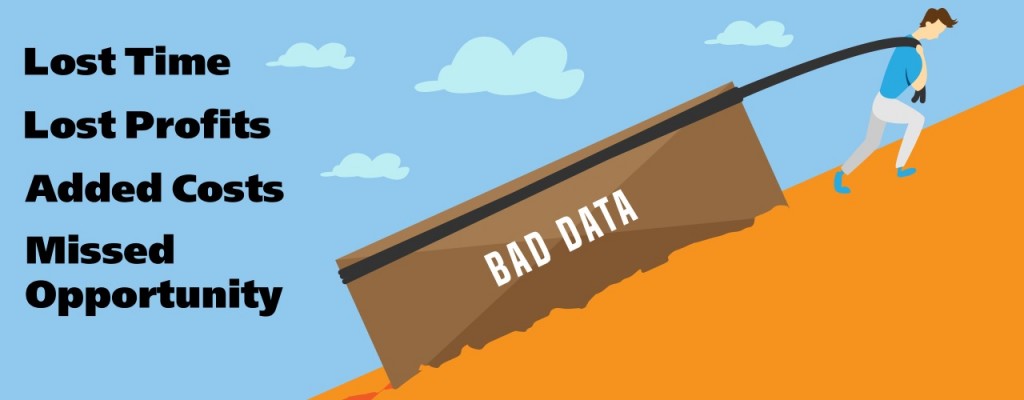
As per Experian’s Data Quality Report, 83% of companies consider their revenue suffers from inaccurate and insufficient customer data. It happens because of time and money wastage on insubstantial resources, which leads to a humungous loss of productivity and profit.

Bad Data Habits: The Ugly Truth

Data is the essence of business. From email delivery to customer feedback to profit generation, the impact of data trickles from strata to strata.

1280-blog-bad-data2

Sadly, many companies fail to fathom the significance of data and continue storing data on multiple systems, instead of a single location, in various formats without actually knowing ways to handle it. This eventually results into huge data pile-ups, where the entire data silo becomes difficult to manage.

However, if you have the right tools and a zeal to ensure data quality, you can confidently manage your data, eradicate duplications and fix errors before they inflict damage to your fundamentals. Besides, prudent strategies, time-to-time reviews and absolute determination are necessary; read this article to gain more insights about how to work on your bad data habits.

Let awareness do the work

Detailed information about customers is crucial for better assistance and quicker efficiency. So, you should always tell your customer support team to derive more information about their customers in order to serve better.

Understand your data needs

What data is important for your business? Once you know that, you will be able to apprehend your customer’s needs and expectations more effectively. Moreover, be sure that the data is accessible to all those who really needs it, otherwise it won’t be fruitful.

Introduce Standardised Data Quality Policies

images

For high quality data, make sure you introduce standard data policies and procedures. Also, ensure that the people working in your organization are acquainted with the ways of recording and storing it.

Initiate Regular Reviews

Data degradation is common. Human beings commit mistakes. Hence, it is important to regularly review and cleanse data in order to avoid future discrepancies.

Integration and Installation of the Right Tools

boxbarimage5

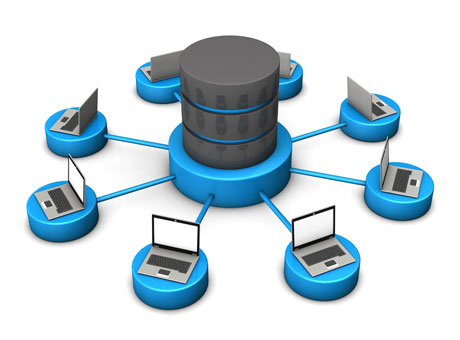
Integrate your network to ensure the data is stored on one server, but accessible from multiple locations. This will help you get an entire picture of your company’s business performance over varied mediums. Install any of the improved Data Cleaning Software to make sure your data is free of duplicates and perfectly formatted right from the start.


To brush up your analytics skills, get enrolled in a Data analyst course. Visit DexLab Analytics.


Interested in a career in Data Analyst?

To learn more about Machine Learning Using Python and Spark – click here.
To learn more about Data Analyst with Advanced excel course – click here.
To learn more about Data Analyst with SAS Course – click here.
To learn more about Data Analyst with R Course – click here.
To learn more about Big Data Course – click here.

Concocting Data with GIS

Concocting Data with GIS

In supreme and sophisticated geospatial realm, data have been predominant. Or, should I say it is the matured fosterling of Geographic Information Systems (GIS). Choose, whatever suits you; subject to whom you work for or what you need to work on. The meat and potatoes? To excel on location analytics, concentrate only on the best most current data.

big-data-visualization-e1456688631506-1024x671

In today’s world, data is valuable. It is vital and veritable. It is indispensable in Geographic Information Systems (GIS).

To second that, today’s tech-efficient society is anchored on location-based data, than ever, especially with the rise in Twitter, Google, Facebook and other social media apps, which collects and stores data from their highly-valued users to sell them off to money-grubbing advertisers.  Though secretly. On the other hand, cell phones go a step ahead in broadcasting your current location data 24/7. Otherwise, how would your friends know that you are safe when a severe earthquake rattled your neighbouring city! (Thanks to location settings)

Feisty Predicaments

sap_ipad_google_maps

However, the real challenge lies in data identification and consumption. Countless number of users gets baffled when it comes to finding data, and if found, how to consume it to set off their business determinations. To solve this, many imminent think tanks of tech industry came out with direct and decisive solutions. Some of them were loaded with an abundance of data, i.e. digestible and disintegrated. By disintegration, they meant that the data was categorized into: points of interest, roads, boundaries and demographics, for easy comprehensibility. Furthermore, industry data bundles concerning telecommunications, retail and insurance fields were added to make the coverage global and profitable. To top it off, quality content and sprawling file formats boosted the results and mechanisms, both.

Conflux of GIS and BI

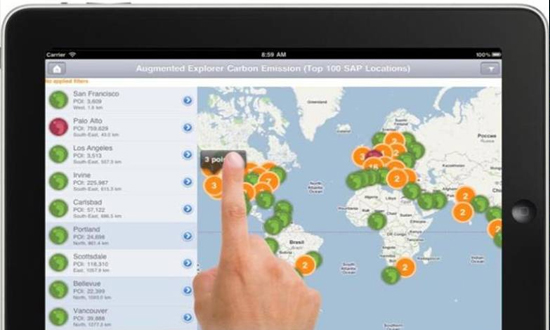
Location technology – Does this ring a bell? Yes? Then you would be familiar with GIS but others, particularly new Business Intelligence users and consumers must have just started taking baby steps on basic mapping. For BI, maps are the backdrop against which business analysts project their business data, stats and analytical information. Analysing the data to understand the insights of consumers is crucial, directly affecting the business decisions and revenues thereby. For example, heat maps, used to see the concentration of installations, customers and IoT devices provides an unparalleled accurateness of spatial relationships, which is impossible to obtain from the spreadsheets.


Seeking data analytics certification courses to boost your business growth? Go through our comprehensive Online Courses in data science at DexLab Analytics.

One of the integral location analytics issues is to help in identifying the high-risk zones at the time of natural disasters, like tornadoes, earthquakes, floods, hurricanes or mudslides. For example, in the US, the East Coast is vulnerable to a lot of hurricanes and floods, whereas earthquakes and mudslides snap the West Coast time to time. Assessment of these location problems is intrinsically important for mortgage underwriters, insurance agents and public safety departments. And best data along with effective geo-coding is the solution to all the inconveniences. 

Discover easy Data Science Courses Online by logging in to DexLab Analytics. To know more on Business Analytics Online Certification, contact us.


Interested in a career in Data Analyst?

To learn more about Machine Learning Using Python and Spark – click here.
To learn more about Data Analyst with Advanced excel course – click here.
To learn more about Data Analyst with SAS Course – click here.
To learn more about Data Analyst with R Course – click here.
To learn more about Big Data Course – click here.

Data Analytics for the Big Screen

Can the film industry leverage more on data analytics?

Film making as an industry is as dependent on good marketing as it is on good content.

Data Analytics for the Big Screen

And it is here that data analytics comes to the picture, for not only does it govern marketing strategies of a Studio but in future it might govern the creative half as well.

For a conventional Hollywood blockbuster, an average of $70 Million are spent within 10-12 weeks and data analytics might direct us as to how much cash needs to be spent and where. Nowadays companies such as IBM are experimenting with Deep Sentiment Analysis, which tries to gauge the market sentiment by listening to the constant stream of content being posted by the users in a given area. The data comes from all sorts of sources, both structured and unstructured, which then needs to be cleaned before gaining any actionable insights from it. Nowadays, companies are working towards developing Market Optimisation Models where they can use historical data to create models, which are then fed current data in order to guide marketing budget allocation decisions. Another way studios are using data analytics is to predict market reaction in USA and Europe by analysing moviegoer’s reaction to the initial run of the movie (usually in smaller markets of Asia). They then proceed to rebrand/improve its offering to make it more ‘commercial’ for a given region.


But does this seemingly endless data and ever improving predictive model point towards a future, where Big Data might tell writers what to write, directors how to direct and actors how to act? If the answer is in affirmative, then are we diluting cinema as an artistic medium? Studios, such as Netflix have now extracted about 70,000 unique characteristics from its movie collection, and now they are analysing how the presence/absence of a characteristic has an impact on the movie revenue/rating/viewing. It then uses these findings to develop and fine-tune the shows it will produce in future. This increasingly ‘scientific’ manner of developing movies is taking over at other studios as well, along with experts fearing that this practice might lead to the industry losing its experimental and creative edge.

With proved benefits, including increased revenue and minimal risk, it is imperative for studios to invest into Data Analytics. It has become imperative to design their marketing strategy using this mine of user data to make their offerings economic, popular, efficient and successful.

Seeking data analytics certification courses to boost your business growth? Go through our comprehensive Online Courses in data science at DexLab Analytics.


Interested in a career in Data Analyst?

To learn more about Machine Learning Using Python and Spark – click here.
To learn more about Data Analyst with Advanced excel course – click here.
To learn more about Data Analyst with SAS Course – click here.
To learn more about Data Analyst with R Course – click here.
To learn more about Big Data Course – click here.

You Must Put These Data Analytics Books in Your Reading List This Year

To be a successful data analyst, you must share two very important attributes that you must possess:


  1. You must be a voracious reader in order to keep up with the developments in the industry
  2. You must be willing to share your knowledge with the people in a simplified manner, so that everyone around you also gets access to this knowledge
     
    You Must Put These Data Analytics Books in Your Reading List This Year


That is because the universe around us deals in the common currency of information and wisdom, which should flow freely without any price tags on it.

Continue reading “You Must Put These Data Analytics Books in Your Reading List This Year”

What Sets Apart Data Science from Big Data and Data Analytics

What Sets Apart Data Science from Big Data and Data Analytics

Today is a time when omnipresent has a whole new definition. We no longer think about the almighty, omnipotent and omnipresent God when we speak about being everywhere. Nowadays we mostly mean data when we hear the term “present everywhere”. The amount of digital data that populates the earth today is growing at a tremendous rate, doubling over every two years and transforming the way we live.

As per IBM, an astounding amount of 2.5 Billion gigabytes of data is generated every day since the year 2012. Another revelation made by an article published in the Forbes magazine stated that data is growing faster than ever before today, and by the year 2020 almost 1.7 megabytes of new information will be created every second by every human being on this earth. And that is why it is imperative to know the fundamental basics of this field as clearly this is where our future lies.

In this article, we will know the main differentiating factors between data science, Big Data analysis and data analytics. We will discuss in detail about the points such as what they are, where they are used, and the skills one needs to be a professional in these fields, and finally the prospect of salary in each case.

2

First off we start with the understanding of what these subjects are:

What is data science?

Data science involves dealing with unstructured and structured data. It is a field that consists of everything that relates to cleansing of data, preparation and analysis. It can be defined as the combination of mathematics, analytics, statistics, programming, capture of data and problem solving. And all of that in the most ingenious ways with an amazing ability to look at things from a unique perspective. They professionals involved with this field should be proficient in data preparation, cleansing, and alignment of data.

To put it simply, this is the umbrella of techniques which is used to extract insights and information from the data.

What do we mean by Big Data?

As the name suggests, Big Data is nothing but a mammoth amount of data. This is so huge that it cannot be processed effectively with the existing traditional applications. The processing of Big Data starts with working with raw data that is not very well aggregated and is almost impossible to store in the memory of only one single computer.

It is now a popular buzzword filling up the job portals with vacancies. And is used to denote basically a large number of data, both structured and unstructured. It inundates a business on a daily basis. It is a prime source of information that can be used to take better decisions and proper strategic business moves.

As per Gartner, Big Data can be defined as high velocity, high volume and high variety information assets which demand cost efficient, innovative forms of information processing that enable improved insight, better decision making, and a procedural automation.

Thus a Big Data certification, can help you bag the best paying jobs in the market.

Understanding data analytics:

Data Analytics is the science of assessing raw data with the purpose of drawing actionable insights from the same.

It basically involves application of algorithms in a mechanical and systematic process to gather information. For instance, it may involve a task like running through a large number of data sets to look for comprehensible correlations between one another.

The main focus for data analytics is concentrated on interference, which is the procedure for deriving conclusions which are mainly based on what the researchers already are aware of.

Where can I apply my data science skills?

  • On internet searching: search engines use data science algorithms
  • For digital ads: data science algorithms is an important aspect for the whole digital marketing spectrum.
  • Recommender systems: finding relevant products from a list of billions available can be found easily. Several companies and ecommerce retailers use data to implement this system.

Big Data applicability:

The following sectors use Big Data application:

  • Customer analysis
  • Fraud analytics
  • Compliance analytics
  • Financial services, credit risk modelling
  • Operational analytics
  • Communication systems
  • Retailers

Data analysis scope and application:

  1. Healthcare sector for efficient service and reduction of cost pressure
  2. Travel sector for optimizing buying experience
  3. Gaming industry for deriving insights about likes and dislikes of gamers
  4. For management of energy, with smart grid management, energy optimization distribution and also used by utility companies.

Here is an infographic that further describes all there is to know about these trending, job-hungry sectors that are growing at a tremendous rate:

Don’t Be Bamboozled by The Data-Jargon: Difference in Detween The Data Fields


Now that you know what the path to career success, looks like stop waiting and get a R Analytics Certification today.


Interested in a career in Data Analyst?

To learn more about Data Analyst with Advanced excel course – Enrol Now.
To learn more about Data Analyst with R Course – Enrol Now.
To learn more about Big Data Course – Enrol Now.

To learn more about Machine Learning Using Python and Spark – Enrol Now.
To learn more about Data Analyst with SAS Course – Enrol Now.
To learn more about Data Analyst with Apache Spark Course – Enrol Now.
To learn more about Data Analyst with Market Risk Analytics and Modelling Course – Enrol Now.

We Are Training Snapdeal on Data Science with R

With the Big Data boom within the IT industry worldwide, more and more online retailers are using it to create better shopping experience for their customers through a boost in customer satisfaction to generate better revenue for themselves.


We Are Training Snapdeal on Data Science with R
Dexlab Analytics is Conducting Training for Snapdeal in Data Science and R Programming


The funny news about Target knowing about a young lady’s pregnancy even before the father could was a viral content that sent the internet crazy. But how did they know this?

 
The answer lies in the wizardry of data analysis, as when a lady starts searching to buy products like nutritional supplements, unscented beauty products and cotton balls then there is a good chance that she is pregnant.


For More Information Visit Now www.prlog.org at Dexlab Analytics is Conducting Training for Snapdeal in Data Science and R Programming

Continue reading “We Are Training Snapdeal on Data Science with R”

Sherlock Holmes Has Been Doing Data Visualization Before Big Data

Investigative minded people will definitely relate to this story from almost every child’s formative years. The day they get their hands on a magnifying glass, kids would feign being the most famous detective of all times – Sherlock Holmes with a cap they would focus the magnifying glass on an object and try and derive meaning by studying the details closely. This would be their first lesson in data visualization. Later as we learnt about Mr. Holmes through books of Sir Arthur Conan Doyle many of us may have imagined pursuing a career as a full-fledged detective. In his book A Study in Scarlet is the most vivid description of the inclination Mr. Holmes has for the sciences.

Sherlock Holmes Has Been Doing Data Visualization Before Big Data

Now that we come to think of it a detective has probably evolved in this technologically driven planet into a modern-day data analyst or an experimental scientist. The job of a data analyst or scientist revolves around gathering a bunch of disorganized data, and then we use this to build a case through deduction and logic and then you reach a conclusion after analysis. Continue reading “Sherlock Holmes Has Been Doing Data Visualization Before Big Data”

High Demand for Data Scientist profiles in LinkedIn

High Demand for Data Scientist profiles in LinkedIn

Currently, Data Science experts are the most sought candidates in the world. According to a research report published by DJ Metrics, the number of ‘Data Scientist’ profiles in LinkedIn has nearly doubled over the last few years. At present, there are more than 11,400 data scientists on the professional networking website, out of which, 52% have added the particular job description (read Data Scientist) during the period between 2012 and 2015.

About the Research

DJ Metrics have taken into account 60,200 LinkedIn profiles of professional experts, while 27,700 records of Educational data and 254,000 records of skills sets were also used to conduct an analysis. Additionally, they have analysed the database of 6200 companies that have provided employment to the Data Scientists. The names of the Companies were collected by analysing the profiles of the Data professionals, since they have listed the names of their employers.

2

Great Career Opportunities

Great Career Opportunities

Researchers are forecasting that there will be a steady rise in the demand for trained Data Scientists, because of the increased adoption of Big Data and Business Intelligence by the leading global companies. High-end business organisations like Microsoft and Facebook are going through a continuous recruitment phase, as these companies had accelerated their hiring process by 151% and 39% respectively in 2014, as compared to what they had done in 2013.

According to the research report, about 65% of the total recruitments were carried out by the following industries:

  • Information Technology and Services, Internet and Computer Software Sector: 9%
  • Education: 3%
  • Banking and Finance: 2%
  • Marketing and Advertising: 2%

Big Data demands Bigger Skills

Big Data demands Bigger Skills

 DJ Metrics has analysed the database of 254,000 skills in order to figure out the growth in the number of skilful Data Science professionals. The results are significant, as apart from the general ‘power’ skills; namely, Data Analysis, Analytics and Data Mining, the top skills found among the vast number of profiles included R, Python, Machine Learning, MATLAB, JAVA, Statistics and SQL. Surprisingly, the Chief Data Scientists are found to have the least technical skills, as only 27% of the profiles had listed Python, while 26% listed R as their technical skill sets. On the other hand, 52% and 53% Junior Data Scientists have listed Python and R, respectively.

Top Recruiters

Top Recruiters

If you see the chart above, you will see that Microsoft and Facebook are the top recruiters over the given period. Surprisingly, Google has not made it to the top 10, although it has recruited quite a number of Data Science professionals. The reason may be that the Data Scientists at Google are called ‘Quantitative Analysts’, which is probably used by their employees while listing their designation on LinkedIn. Since, LinkedIn has researched about the general Data Scientists; they may not have detected the alternate titles.

Countries with highest Data Scientist population

Countries with highest Data Scientist population

Almost 55% of the total Data Scientists in the world are currently located in the United States of America (USA), which makes the top of the list. The second country with maximum numbers of Data Science professionals is United Kingdom (UK), while the third position is occupied by India.  

Are you interested in coveted data science online courses to upgrade your data science skill-set? Look no further than DexLab Analytics. They offer cutting edge Data Science training in Gurgaon for aspiring candidates.


Interested in a career in Data Analyst?

To learn more about Data Analyst with Advanced excel course – Enrol Now.
To learn more about Data Analyst with R Course – Enrol Now.
To learn more about Big Data Course – Enrol Now.

To learn more about Machine Learning Using Python and Spark – Enrol Now.
To learn more about Data Analyst with SAS Course – Enrol Now.
To learn more about Data Analyst with Apache Spark Course – Enrol Now.
To learn more about Data Analyst with Market Risk Analytics and Modelling Course – Enrol Now.

Call us to know more