Data Science Courses Archives - Page 15 of 16 - DexLab Analytics | Big Data Hadoop SAS R Analytics Predictive Modeling & Excel VBA

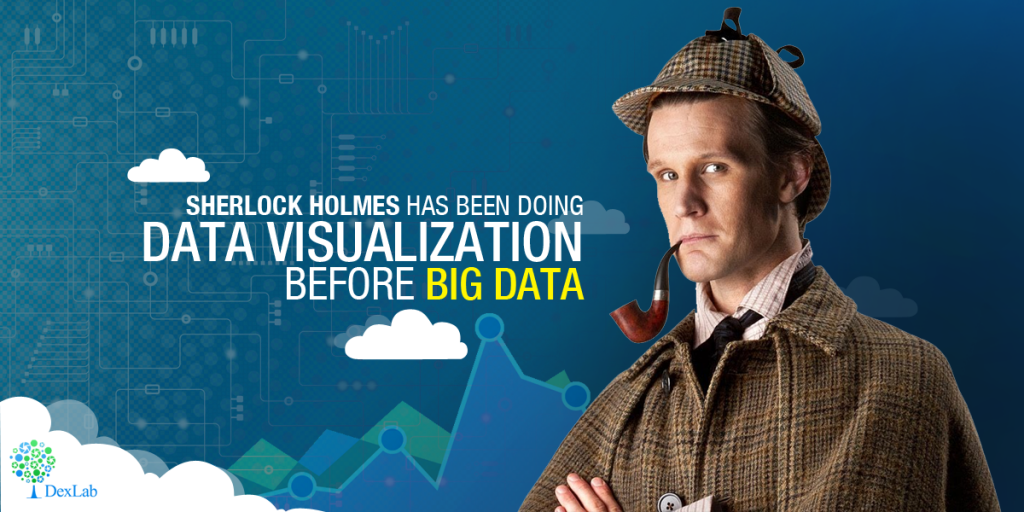
Sherlock Holmes Has Been Doing Data Visualization Before Big Data

Investigative minded people will definitely relate to this story from almost every child’s formative years. The day they get their hands on a magnifying glass, kids would feign being the most famous detective of all times – Sherlock Holmes with a cap they would focus the magnifying glass on an object and try and derive meaning by studying the details closely. This would be their first lesson in data visualization. Later as we learnt about Mr. Holmes through books of Sir Arthur Conan Doyle many of us may have imagined pursuing a career as a full-fledged detective. In his book A Study in Scarlet is the most vivid description of the inclination Mr. Holmes has for the sciences.

Sherlock Holmes Has Been Doing Data Visualization Before Big Data

Now that we come to think of it a detective has probably evolved in this technologically driven planet into a modern-day data analyst or an experimental scientist. The job of a data analyst or scientist revolves around gathering a bunch of disorganized data, and then we use this to build a case through deduction and logic and then you reach a conclusion after analysis. Continue reading “Sherlock Holmes Has Been Doing Data Visualization Before Big Data”

High Demand for Data Scientist profiles in LinkedIn

High Demand for Data Scientist profiles in LinkedIn

Currently, Data Science experts are the most sought candidates in the world. According to a research report published by DJ Metrics, the number of ‘Data Scientist’ profiles in LinkedIn has nearly doubled over the last few years. At present, there are more than 11,400 data scientists on the professional networking website, out of which, 52% have added the particular job description (read Data Scientist) during the period between 2012 and 2015.

About the Research

DJ Metrics have taken into account 60,200 LinkedIn profiles of professional experts, while 27,700 records of Educational data and 254,000 records of skills sets were also used to conduct an analysis. Additionally, they have analysed the database of 6200 companies that have provided employment to the Data Scientists. The names of the Companies were collected by analysing the profiles of the Data professionals, since they have listed the names of their employers.

2

Great Career Opportunities

Great Career Opportunities

Researchers are forecasting that there will be a steady rise in the demand for trained Data Scientists, because of the increased adoption of Big Data and Business Intelligence by the leading global companies. High-end business organisations like Microsoft and Facebook are going through a continuous recruitment phase, as these companies had accelerated their hiring process by 151% and 39% respectively in 2014, as compared to what they had done in 2013.

According to the research report, about 65% of the total recruitments were carried out by the following industries:

  • Information Technology and Services, Internet and Computer Software Sector: 9%
  • Education: 3%
  • Banking and Finance: 2%
  • Marketing and Advertising: 2%

Big Data demands Bigger Skills

Big Data demands Bigger Skills

 DJ Metrics has analysed the database of 254,000 skills in order to figure out the growth in the number of skilful Data Science professionals. The results are significant, as apart from the general ‘power’ skills; namely, Data Analysis, Analytics and Data Mining, the top skills found among the vast number of profiles included R, Python, Machine Learning, MATLAB, JAVA, Statistics and SQL. Surprisingly, the Chief Data Scientists are found to have the least technical skills, as only 27% of the profiles had listed Python, while 26% listed R as their technical skill sets. On the other hand, 52% and 53% Junior Data Scientists have listed Python and R, respectively.

Top Recruiters

Top Recruiters

If you see the chart above, you will see that Microsoft and Facebook are the top recruiters over the given period. Surprisingly, Google has not made it to the top 10, although it has recruited quite a number of Data Science professionals. The reason may be that the Data Scientists at Google are called ‘Quantitative Analysts’, which is probably used by their employees while listing their designation on LinkedIn. Since, LinkedIn has researched about the general Data Scientists; they may not have detected the alternate titles.

Countries with highest Data Scientist population

Countries with highest Data Scientist population

Almost 55% of the total Data Scientists in the world are currently located in the United States of America (USA), which makes the top of the list. The second country with maximum numbers of Data Science professionals is United Kingdom (UK), while the third position is occupied by India.  

Are you interested in coveted data science online courses to upgrade your data science skill-set? Look no further than DexLab Analytics. They offer cutting edge Data Science training in Gurgaon for aspiring candidates.


Interested in a career in Data Analyst?

To learn more about Data Analyst with Advanced excel course – Enrol Now.
To learn more about Data Analyst with R Course – Enrol Now.
To learn more about Big Data Course – Enrol Now.

To learn more about Machine Learning Using Python and Spark – Enrol Now.
To learn more about Data Analyst with SAS Course – Enrol Now.
To learn more about Data Analyst with Apache Spark Course – Enrol Now.
To learn more about Data Analyst with Market Risk Analytics and Modelling Course – Enrol Now.

5 Analytics Tools To Improve Your Business Decisions

5 Analytics Tools To Improve Your Business Decisions

Big Data has proved to be inevitable for business organisations in the quest for stepping ahead of their competitors. Nevertheless, only having Big Data at hand does not solve problems. You also need the availability of efficient analytics software that can put your data to the best use.

A business analytics tool is responsible for analysing massive amounts of data in order to extract valuable information. Such information in turn, can be used for improving operational efficiency and for taking better decisions.

2

So, let us here go through the top 10 data analytics tools available in the market.

  • Yellowfin BI

Yellowfin Business Intelligence (BI) is a reporting, dashboard and data analysis software. The software is able to conduct analysis of huge amounts of database, in order to figure out appropriate information. With Yellowfin, your dashboard can be easily accessible from everywhere including company intranet, mobile device or web page.

  • Business Intelligence & Reporting Tools (BIRT)

BIRT is open source software programmed for JAVA and JAVA EE platforms. It consists of a runtime component and a visual report designer, which can be used for creating reports, visual data, and charts and so on. Information gathered from this software can be used for tracking historical data and analysing it and as well as for monitoring ongoing developments in various fields. BIRT can also be used for real-time decision-making purposes.

  • Clear Analytics

Clear Analytics is quite easy to manage as the software is based on Excel spreadsheets. While the software allows you to continue managing data using Excel, it also adds some extra features like reports scheduling, administrative capabilities, version control, governance etc. for better decision making. In short, Clear Analytics can be your choice in case you want high-end performance in exchange of minimal effort.

  • Tableau

Tableau is BI software that provides insight into the data that a business organisation requires for connecting the dots, in order to make clear and effective decisions. Data visualisation in Tableau is much dynamic and elaborative as compared to the other programmes available. Besides, it also provides easier access to data given its extended mobile device support. Additionally, the costs of implementing this program as well as its upgrade are relatively low.

  • GoodData

GoodData is a service BI platform. It takes into account both internal and external datasets (cloud) of an organisation to analyse and provide better governance. The platform is programmed for managing data security and governance thereby, consequently providing the user with the desired results. The most important feature of this platform is that it can analyse datasets of any size, thus making it effective for its users. Recently, the company rebranded their software as an Open Analytics platform.

These are some of the major analytics tools used by organisations irrespective of their scale in order to enhance their business intelligence. Whether you are looking to enhance your career or take better business decisions, a Data analyst certification course can help you to achieve such objectives. Data Analysis helps you to track the competitive landscape and figure out the essentials that needs to be done, in order to get ahead of your competitors. If you are a manager, you can take precise decisions based on quantitative data. Since big data is potential of driving your success, it is your job to master the science and use it for your advantage.


Interested in a career in Data Analyst?

To learn more about Data Analyst with Advanced excel course – Enrol Now.
To learn more about Data Analyst with R Course – Enrol Now.
To learn more about Big Data Course – Enrol Now.

To learn more about Machine Learning Using Python and Spark – Enrol Now.
To learn more about Data Analyst with SAS Course – Enrol Now.
To learn more about Data Analyst with Apache Spark Course – Enrol Now.
To learn more about Data Analyst with Market Risk Analytics and Modelling Course – Enrol Now.

Know The Answer To These Interview Questions To Get A Job As Data Analyst

List of Interview Questions for Data Analysts

With this Data analyst interview guide you will know what to expect in an interview round for a position of data analyst.

A good data analyst or scientist must be capable of drawing actionable insights from the data that a company generates. They must possess a good sense of what data they must collect and should have a solid process for carrying it out effectively using processes of data analysis and building predictive models.

A data analyst must possess a strong foundation in the following topics: operations research, statistics, machine learning along with some database skills, such as SQL or SAS in order to clean, retrieve and process the data from different sources. One can lead to this role from different pathways thus candidates can expect to be bombarded with questions relevant to statistics ort mathematics and even computer programming or engineering.

Data scientists are also often required to script programs using R or Python or Matlab and the role will typically not place emphasis on the programming skills or practices and the general software engineering skills which is necessary for working with production quality software.

Here is a list of common data analyst interview questions:

Operational questions:

  1.  Describe the steps that you follow when creating a design a data-driven model to manage a business problem. For example you may try and automatically classify customer support mails, by either sentiment or topic. Another task may be to predict a company’s employee churn.
  2. What models would you classify as simple models and which are the ones that are complex according to you? What are the comparative strengths and weaknesses of choosing a more complex model over a simplistic one?
  3. What are the possible ways in which you can combine models to create an ensemble model and what are the main advantages of doing this?
  4. Tell us about certain pre-processing steps that you may carry out on data before using them to train a model and describe the conditions under which they may be applied.

Role specific questions:

About basic ideas in probability, statistics and machine learning:

  1. Define what is confidence interval and why do you think it is useful?
  2. What is the main difference between correlation and independence?
  3. What is Bayes Theorem? What is conditional probability? What is its use in practice?
  4. When and how do you understand that you have collected ample data for building a model?
  5. Tell us the difference between classification and regression.

Hope this list of common data science interview questions will prepare you for a job at a reputable data analysis company. For more such data science news, tutorials and articles with emphasis on programming and analytics view our regular updates from DexLab Analytics.


Interested in a career in Data Analyst?

To learn more about Data Analyst with Advanced excel course – Enrol Now.
To learn more about Data Analyst with R Course – Enrol Now.
To learn more about Big Data Course – Enrol Now.

To learn more about Machine Learning Using Python and Spark – Enrol Now.
To learn more about Data Analyst with SAS Course – Enrol Now.
To learn more about Data Analyst with Apache Spark Course – Enrol Now.
To learn more about Data Analyst with Market Risk Analytics and Modelling Course – Enrol Now.

Secrets To Clinch Victory in Global Data Science Competitions

Data scientists are often perceived as crazy IT nerds who would use formulas and algorithms to even determine how many teaspoons of sugar to put in their tea! Well, we would not argue about this, as much as stereotypical this may sound, but a data scientist feels a rush when he solves a problem with calculations, analysis and logic; a rush that incomparable to anything else.

 
Secrets To Clinch Victory in Global Data Science Competitions


Just as an avid gamer who plays COD (Call of Duty) or CS (Counter Strike) waits for WCG (World Cyber Games). A data analyst waits for – Datahack. People who are just crazy about machine learning wait for the whole year to participate in Datahack. For them this is Olympics of Data Analysis. Continue reading “Secrets To Clinch Victory in Global Data Science Competitions”

Prepare For Your Data Science Job Interview With Answers to These Puzzles

Prepare For Your Data Science Job Interview With Answers to These Puzzles

You may have passed your data science certification course with flying colours, but getting your first break in an analytical job role can be quite difficult. Did you know that more than 30 percent of top tier analytical firms evaluate and select their candidates on their ability to solving puzzles? After all this is the best way to determine that they are logical, with ample creative thinking abilities and are definitely pros at dealing with numbers (a skill must have for data personnel).

The companies are keen on hiring people who have the ability to bring a unique perspective in solving business problems. Such individuals are capable of to offer their hiring firms with a huge advantage over other candidates. But to garner such capabilities an individual must practice regularly with consistent efforts.

As fellow data analysts, we recommend that you develop a daily habit of solving puzzles. They are mental exercises which on disciplined training will help you to get better with time. When employed in a job role that involves having to deal with complex problems everyday such a skill will prove to be an asset.

Are you ready to work out your grey matter cells? Here are the most common puzzles asked at interviews for data science positions:

These questions have been asked to candidates at companies like Amazon, Google, Goldman Sachs, and JP Morgan etc.

Note: Try solving these problems on your own before checking the solution, and feel free to share your logic behind the solutions in the comments below. We are all ears eyes to see how unique someone’s mind can be!

Puzzle #1:

Blind game challenge:

You have been placed in a dark room, there is a table kept in the room. The table has 50 coins atop its surface, out of these 50 coins 10 coins have their tails side up and 40 coins have their heads side up. Your task is to divide this set of 50 coins into 2 groups (not necessarily of equal size) so that both the groups have equal numbers of coins with the tails side up.

Solution #1:

The coins should be divided into two groups one with 40 coins and one with 10 coins, then flip all the coins in the group with 10 coins.

Puzzle #2:

Bag of coins problem:

You have been given 10 bags full of coins; each bag comes with an infinite number of coins. But there is a twist, one of the bags is full of forged coins but sadly you do not remember which one it is. But you do know that the weight of the real coins are 1 gram and those which are forged are 1.1 gram. Your task is to identify the bags in minimum readings with a digital weighing machine that has been provided with you.

2

Solutions #2:

You need to take 1 coin from the first bag, 2 coins from the second bag, and 3 coins from the third bag and so on and so forth. Eventually you will end up with 55 coins in total (1+2+3+4+…10). The next step is to weigh all the 55 coins together. You can identify which bag has the forged coins based on the final reading of the weighing machine. For instance, if the reading ends with 0.4 then it is the fourth bag with forged coins. And if it comes 0.7 then it is the 7th bag with the forgeries.

Puzzle #3:

The Sand timer trouble:

You have two hourglasses or sand timers one of which can show 4 minutes and the next one can show 7 minutes respectively. Your job is to use both the sand times (either one at a time or simultaneously or in any other combination) and measure a time of 9 minutes.

Solution #3:

Step 1: start the 7 minute sand timer along with the 4 minute sand timer

Step 2: when the 4 minute sand timer ends turn it upside down instantaneously

Step 3: when the 7 minute sand time ends also turn it down at that instant

Step 4: when the 4 minute sand timer ends turn the 7 minute sand timer upside down and it will have 1 minute worth of sand in it

Thus, effectively 8 + 1 = 9

In closing thoughts:

Hope these questions were enough to get your brain rolling, while a lot of these questions may seem challenging to most of the people, but with a little out-of-the-box analytical thinking you will soon discover that they are not too difficult to solve.

If these questions were simple enough for you, we have plenty more with increasing difficulty. And if all these brain picking has left you overwhelmed to the peak and all you want is to solve real-world data problems, then follow our regular social media uploads advertising latest job openings in the field of data science.

DexLab Analytics is a premier data science training institute in Gurgaon that offers program centric courses. Their online certification course on data science is stellar, come check out the course itinerary now.
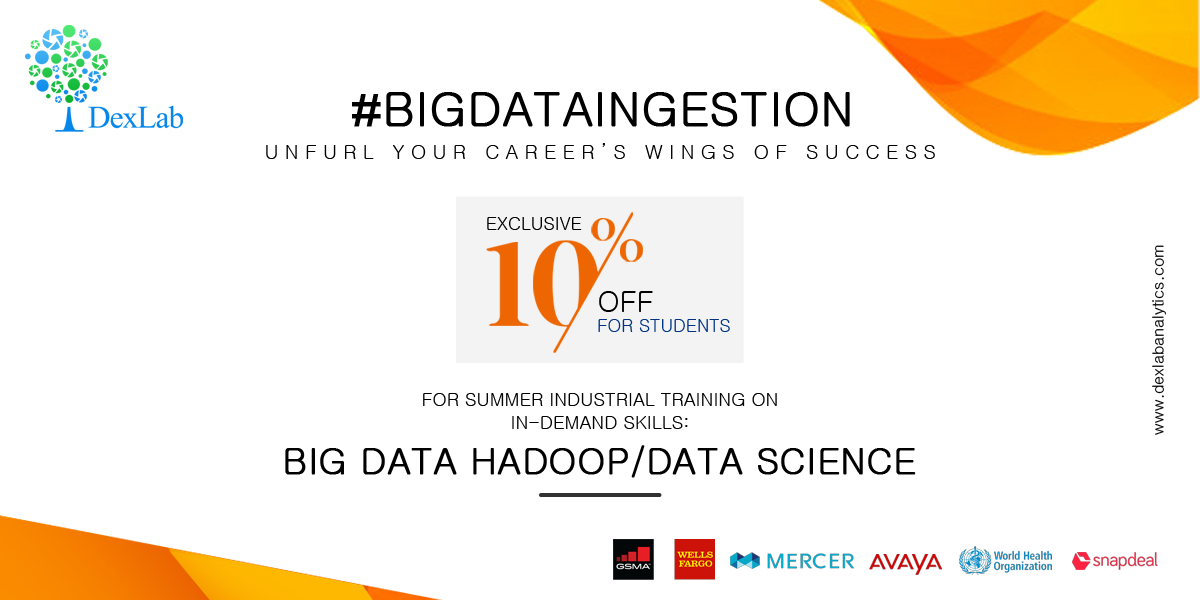
DexLab Analytics Presents #BigDataIngestion

DexLab Analytics has started a new admission drive for prospective students interested in big data and data science certification. Enroll in #BigDataIngestion and enjoy 10% off on in-demand courses, including data science, machine learning, hadoop and business analytics.


Interested in a career in Data Analyst?

To learn more about Data Analyst with Advanced excel course – Enrol Now.
To learn more about Data Analyst with R Course – Enrol Now.
To learn more about Big Data Course – Enrol Now.

To learn more about Machine Learning Using Python and Spark – Enrol Now.
To learn more about Data Analyst with SAS Course – Enrol Now.
To learn more about Data Analyst with Apache Spark Course – Enrol Now.
To learn more about Data Analyst with Market Risk Analytics and Modelling Course – Enrol Now.
India Will Lead in Analytics Services:

Today is a time when each day is witnessing the field of analytics gets more and more pervasive. It is helping other fields and sectors to achieve more. At a time like this our nation is expected to maintain its ground over other major offshore destinations such as Philippines, China, Eastern Europe and Latin America as per a recent survey.


A host of factors will drive the demand for this service from India. They are – availability of talent pool, industry maturity and a wide spectrum of services which was reported by the survey that was conducted by Avendus Capital which is a financial services company. Continue reading “India Will Lead in Analytics Services:”

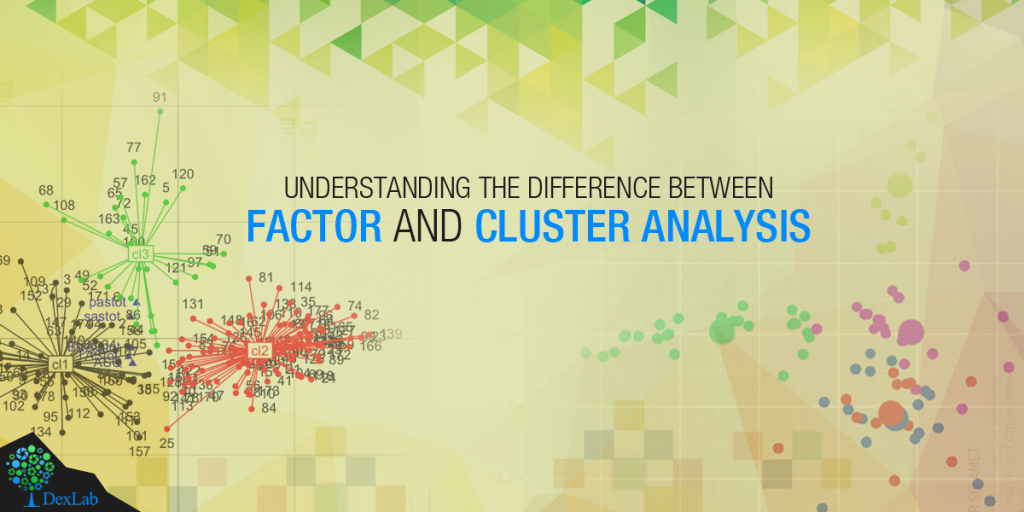
Understanding the Difference Between Factor and Cluster Analysis

Understanding the Difference Between Factor and Cluster Analysis

Cluster analysis and factor analysis are two different statistical methods in data analytics which are used heavily in analytical methods of subjects like natural sciences and behavioural sciences. The names of these analytical methods are so because both these methods allow the users to divide the data into either clusters or into factors.

Most newly established data analysts have this common confusion that both these methods are almost similar. But while these two methods may look similar on the surface but they differ in several ways including their applications and objectives.

Difference in objectives between cluster analysis and factor analysis:

One key difference between cluster analysis and factor analysis is the fact that they have distinguished objectives. For factor analysis the usual objective is to explain the correlation with a data set and understand how the variables relate to each other. But on the other hand the objective of cluster analysis is to address the heterogeneity in the individual data sets.

Put in simpler words the spirit of cluster analysis is to help in categorization but that of factor analysis are a form of simplification.

Data Science Machine Learning Certification

Difference is solutions:

This is not an easy section for drawing a line of separation in between cluster and factor analysis. That is because the results or solutions obtainable from both these analysis is subjective to their application. But still one could say that with factor analysis provides in a way the ‘best’ solutions to the researcher. This best solution is in the sense that the researcher can optimize a certain aspect of the solution this is known as orthogonality which offers ease of interpretation for the analysts.

But in case of cluster analysis this is not the case. The reasons behind that being all algorithms which can yield the best solutions for cluster analysis are usually computationally incompetent. Thus, researchers cannot trust this method of cluster analysis as it does not guarantee an optimal solution.

Difference in applications:

Cluster analysis and factor analysis differ in how they are applied to data, especially when it comes to applying them to real data. This is because factor analysis can reduce the unwieldy variables sets and boil them down to a smaller set of factors. This makes it suitable for simplifying otherwise complex models of analysis. Moreover, factor analysis also comes with a sort of confirmatory use researchers can use this method to develop a set of hypotheses based on how the variables in the data set are related.  After that the researcher can run a factor analysis to further confirm these hypotheses.

But cluster analysis on the other hand is suitable only for categorizing objects as per certain predetermined criteria. In cluster analysis a researcher can measure selected aspects of say a group of newly discovered plants and then place these plants into categories of species grouped by employing cluster analysis.

Here is an infographic to better explain the difference between cluster analysis and factor analysis: 


Interested in a career in Data Analyst?

To learn more about Data Analyst with Advanced excel course – Enrol Now.
To learn more about Data Analyst with R Course – Enrol Now.
To learn more about Big Data Course – Enrol Now.

To learn more about Machine Learning Using Python and Spark – Enrol Now.
To learn more about Data Analyst with SAS Course – Enrol Now.
To learn more about Data Analyst with Apache Spark Course – Enrol Now.
To learn more about Data Analyst with Market Risk Analytics and Modelling Course – Enrol Now.

The Beginners’ Guide to Data Science Jargon

The Beginners’ Guide to Data Science Jargon

Are you poised to join the ranks of c-suite data operatives working with the Big Word – Big Data? But before you set foot in the industry with the big players, you must train yourself how to talk the talk before you can walk the walk. Data science and analysis is a complex field as it is with mind-numbing numbers and lengthy algorithms and on top of that there is the jargon that is stranger than fiction in this field. So, to help you prepare your tongue right, here is our brief list of the most commonly used terminology in the data science industry. After you have the enlightenment of knowledge about these words, you will not need to be hesitant when hearing these words and silently think to yourself that, “This sounds data-related”.

Here is a list of data-related jargon to clear your doubts about from all over the Big Data spectrum:

Analytics: the process of drawing conclusions from raw information or data that is actionable. With the help of analysis raw data can be transformed into meaningful information that was otherwise useless to the company. The main emphasis of analytics remains on the inference rather than the systematic operations or even the software in use.


  • Predictive Analysis: after analysing the events that happened in the future and the historical data of a company or organization and then being able to make probable predictions about the company’s future. This may also involve proposing counteractive plans and strategies to prevent an incoming disaster or loss.
  • Descriptive Analysis: narrowing down or in other words boiling down huge numbers into small pieces of usable information. Instead of listing a lot of numbers and complex details these use a general narrative and thrust in the report. 


Prescriptive Analysis: this is the course of action that analytics personnel propose after landing upon a definite approach after days of analysis on a problem. Data is turned into actions and real world problems find solutions with the right decisions.


Algorithms: the mathematical formulas statistical procedures used to analyse data by analytical personnel. These are usually used in software processes and analyze any data that have been input.


Cloud: this is not the same stuff that the weather report talks about when speaking of an overcast day. But that being said, this cloud is also basically everywhere. This is the process of storing or accessing data, files and software over the World Wide Web, instead of the old system of hard drive storage.


R:  maybe not a very descriptive name for a programming language but nevertheless, this is a very commonly used programming language used in data science that uses statistical computing. This is also one of the easiest and most popularly used languages in data science.


SAS: Statistical Analysis System is a software suite developed by the SAS institute and is also a very commonly used data analysis language. It was developed in the North Carolina State University.


Machine Learning: a method considered equivalent to machine wizardry where data analysis is automated by teaching machines to use models, algorithms and other processes for analytics.  

2


Hadoop: better known as Apache Hadoop which is an open source software framework, it principally works by storing files and processing data, which is why it is still mostly used as a data warehousing system.


IoT: this is a proposed system wherein devices will be able to talk to each other. This is like a network of objects like, your phone, car, and smart wearables etc. which are embedded with network connectivity. The best examples are driverless vehicles.


These were the most commonly used data analytics jargon; for more such news and articles about data analytics stay hooked to daily uploads from Dexlab Analytics, creating an easier world with data backed decisions.


Interested in a career in Data Analyst?

To learn more about Data Analyst with Advanced excel course – Enrol Now.
To learn more about Data Analyst with R Course – Enrol Now.
To learn more about Big Data Course – Enrol Now.

To learn more about Machine Learning Using Python and Spark – Enrol Now.
To learn more about Data Analyst with SAS Course – Enrol Now.
To learn more about Data Analyst with Apache Spark Course – Enrol Now.
To learn more about Data Analyst with Market Risk Analytics and Modelling Course – Enrol Now.

Call us to know more