Data Science Classes Archives - Page 6 of 10 - DexLab Analytics | Big Data Hadoop SAS R Analytics Predictive Modeling & Excel VBA

A Regression Line Is the Best Fit for the Given PRF If the Parameters Are OLS Estimations – Elucidate

A Regression Line Is the Best Fit for the Given PRF If the Parameters Are OLS Estimations - Elucidate

Regression analysis is extensively used in business applications. It’s one of the most integral statistical techniques that help in estimating the direction and strength between two or more (financial) variables – thus determining a company’s sales and profits over the past few years.

In this blog, we have explained how a regression line is the best fit for a given PRF if the parameters are all OLS estimations.

The OLS estimators for a given regression line has been obtained as: a = y ̅ – bx ̅ and b = (Cov(x,y))/(v(x)). The regression line on the basis of these OLS estimate has been given as: Y ̂_ i-Y ̅ = b(x_i-x ̅ )….. (1)

The regression line (1) constructed above is a function of the least square i.e. the parameters of the regression equation have been selected so that the residual sum of squares is minimized. Thus, the estimators ‘a’ & ‘b’ explains the population parameters, the best relative to any other parameters. Given, the linearity of the parameters, these estimators share the minimum variations with the population parameters, i.e. they explain the maximum variations in the model, in relation to the population parameters, as compared to any other estimators, in a class of unbiased estimators.

Thus, the regression line would be the ‘best fit’ for a given PRF. If ‘a’ & ‘b’ are best linear unbiased estimators for  respectively. Thus, to show ‘best fit’, we need to prove:

  1. To ‘b’ is Best unbiased estimator for :-

From the OLS estimation; we have ‘b’ as:

i.e.b is a linear combination of w’is & y’is.

Hence; ‘b’ is a linear estimator for β. Therefore, the regression line would be linear in parameters as far as ‘b’ is concerned.

Now,

Let us test for the prevalence of this conditions:

For unbiasedness, we must have :- E(b)=β. To test this, we take expectation on both sides of (3) & get:

From (1) & (4) we can say that ‘b’ is a linear unbiased estimator for β.

To check whether ‘b’ is the best estimator or not we need to check whether it has the minimum variance in a class of linear unbiased estimator.

Thus, we need to calculate the variance for ‘b’ & show that it is the minimum in a class of unbiased estimations. But, first, we need to calculate the variance for ‘b’.

Now; we need to construct another linear unbiased estimator and find its variance.

Let another estimator be: b^*=∑ci yi….(6)  For unbiasedness ∑ci =0,∑cixi =1.

Now; from (6) we get:

∴b* is an unbiased estimator for  Now; the variance for  can be calculated as:-

Now;

Hence; from (9) we can say V(b) is the least among a class of unbiasedness estimators.

Therefore, ‘b’ is the best linear unbiased estimator for  in a class of linear unbiased estimators.

2

  1. To prove ‘a’ is the best linear unbiased estimator for α:-

Form the OLS estimation we have ‘a’ as:-

Here; ‘b’ is a function of Y and Y is a linear function of X(orUi).

‘a’ is also a linear function of Y. i.e. has linearity.

There, ‘a’ is a linear estimator for   ……. (11)

Now, for ‘a’ to be an unbiased estimator; we must have From (10) we have:-

Taking expectations on both sides of the equation; we get:

Therefore, ‘a’ is an unbiased estimator for  ……… (12)

From (11) & (12) ‘a’ is a linear unbiased estimator for

Now, if ‘a’ is to be the best estimator for then is most have the minimum variance. Thus; we first need to calculate the variance of ‘a’.

Now, 

Now; let us consider an estimator in the class of linear unbiased estimator.

Further we know,

Now;

Hence;

Now;

Therefore;

Hence; from (16) we can say that is the Min Variance Unbiased estimator in a class of unbiased estimator.

Hence; we can now safely conclude that a regression line composed of OLS estimators is the ‘best fit’ line for a given PRF, compared to any other estimator.

Thus, the best-fit regression line can be depicted as

Thus, a regression line is the best fit for a given PRF if the estimators are OLS.

End Notes

The beauty and efficiency of Regression method of forecasting never fail to amaze us. The way it crunches the data to help make better decisions and improve the current position of the business is incredible. If you are interested in the same, follow us at DexLab Analytics. A continues blog series on regression model and analysis is upcoming. Watch this space for more.

DexLab Analytics offers premium data science courses in Gurgaon crafted by the experts. After thorough research, each course is prepared keeping student’s needs and industry demands in mind. You can check out our course offerings here.


Interested in a career in Data Analyst?

To learn more about Data Analyst with Advanced excel course – Enrol Now.
To learn more about Data Analyst with R Course – Enrol Now.
To learn more about Big Data Course – Enrol Now.

To learn more about Machine Learning Using Python and Spark – Enrol Now.
To learn more about Data Analyst with SAS Course – Enrol Now.
To learn more about Data Analyst with Apache Spark Course – Enrol Now.
To learn more about Data Analyst with Market Risk Analytics and Modelling Course – Enrol Now.


Demand for Data Analysts is Skyrocketing – Explained

Demand for Data Analysts is Skyrocketing - Explained

The salary of analytics professionals outnumbers that of software engineers by more than 26%. The wave of big data analytics is taking the world by storm. If you follow the latest studies, you will discover that there has been a prominent growth in median salary over several experience levels in the past three years (2016 to 2018). In 2019, the average analytics salary has been capped at 12.6 lakh per annum.

The key takeaway is that the salary structure of analytics professionals continues to beat other tech-related job roles. In fact, data analysts are found out-earning their Java correspondents by nearly 50% in India alone. A latest survey provides an encompassing view of base and compensation salaries in data science along with median salaries followed across diverse job categories, regions, education profiles, experience, tools and skills.

In this regard, a spokesperson of a prominent data analytics learning institute was found saying, “The demand for AI skills is expected to increase rapidly, which is also reflected by the fact that AI engineers command a higher salary than peers.” She further added, “Many of our clients have realized that investing in data-driven skills at the leadership level is a determining factor for the success of digital and AI initiatives in the organization. With the increasing adoption of digital technologies, we expect an enduring growth of Data Science and AI initiatives to offer exciting and lucrative career options to new age professionals,”

Over time, we are witnessing how markets are evolving while the demand for skilled data scientists is following an upward trend. It is not only the technology firms that are posting job offers, but the change is also evident across industries, like retail, medical, retail and CPG amongst others. These sectors are enhancing their analytical capabilities implying an automatic increase in the number of data-centric jobs and recruitment of data scientists.

Points to Consider:

  • In the beginning, nearly 76% of data analysts earn 6-lakh figure per annum.
  • The average analytics salary observed in 2018-19 is 12.6 lakh.
  • In terms of analytics career, Mumbai offers the highest compensation of 13.7 lakh yearly, followed by Bangalore at 13 lakh.
  • Mid-level professionals proficient in data analytics are more in demand.
  • Knowing Python is an added advantage; Python Programming training will help you earn more. Expect a package of 15.1 lakh.
  • Nevertheless, we often see a pay disparity for female data scientists against their male counterparts. While women’s take-home salary is 9.2 lakh, male from the same designation and profession earns 13.7 lakh per annum.

2

As endnotes, the demand for data science skills is skyrocketing. If you want to enter into this flourishing job market, this is the best time! Enroll in a good data analyst course in Delhi and mould your career in the shape of success! DexLab Analytics is a top-notch data analyst training institute that offers a plethora of in-demand skill training courses. Reach us for more.


This article has been sourced fromwww.tribuneindia.com/news/jobs-careers/data-analytics-professionals-ride-the-big-data-wave/759602.html


Interested in a career in Data Analyst?

To learn more about Data Analyst with Advanced excel course – Enrol Now.
To learn more about Data Analyst with R Course – Enrol Now.
To learn more about Big Data Course – Enrol Now.

To learn more about Machine Learning Using Python and Spark – Enrol Now.
To learn more about Data Analyst with SAS Course – Enrol Now.
To learn more about Data Analyst with Apache Spark Course – Enrol Now.
To learn more about Data Analyst with Market Risk Analytics and Modelling Course – Enrol Now.
Bayesian Thinking & Its Underlying Principles

Bayesian Thinking & Its Underlying Principles

In the previous blog on Bayes’ Theorem, we left off at an interesting junction where we just touched upon the ideas on prior odds ratio, likelihood ratio and the resulting Posterior Odds Ratio. However, we didn’t go into much detail of what it means in real life scenarios and how should we use them.

In this blog, we will introduce the powerful concept of “Bayesian Thinking” and explain why it is so important. Bayesian Thinking is a practical application of the Bayes’ Theorem which can be used as a powerful decision-making tool too!

We’ll consider an example to understand how Bayesian Thinking is used to make sound decisions.

For the sake of simplicity, let’s imagine a management consultation firm hires only two types of employees. Let’s say, IT professionals and business consultants. You come across an employee of this firm, let’s call him Raj. You notice something about Raj instantly. Raj is shy. Now if you were asked to guess which type of employee Raj is what would be your guess?

If your guess is that Raj is an IT guy based on shyness as an attribute, then you have already fallen for one of the inherent cognitive biases. We’ll talk more about it later. But what if it can be proved Raj is actually twice as likely to be a Business Consultant?!

This is where Bayesian Thinking allows us to keep account of priors and likelihood information to predict a posterior probability.

The inherent cognitive bias you fell for is actually called – Base Rate Neglect. Base Rate Neglect occurs when we do not take into account the underlying proportion of a group in the population. Put it simply, what is the proportion of IT professionals to Business consultants in a business management firm? It would be fair to assume for every 1 IT professional, the firm hires 10 business consultants.

Another assumption could be made about shyness as an attribute. It would be fair to assume shyness is more common in IT professionals as compared to business consultants. Let’s assume, 75% of IT professionals are in fact shy corresponding to about 15% of business consultants.

Think of the proportion of employees in the firm as the prior odds. Now, think of the shyness as an attribute as the Likelihood. The figure below demonstrates when we take a product of the two, we get posterior odds.

Plugging in the values shows us that Raj is actually twice as likely to be a Business consultant. This proves to us that by applying Bayesian Thinking we can eliminate bias and make a sound judgment.

Now, it would be unrealistic for you to try drawing a diagram or quantifying assumptions in most of the cases. So, how do we learn to apply Bayesian Thinking without quantifying our assumptions? Turns out we could, if we understood what are the underlying principles of Bayesian Thinking are.

Principles of Bayesian Thinking

Rule 1 – Remember your priors!

As we saw earlier how easy it is to fall for the base rate neglect trap. The underlying proportion in the population is often times neglected and we as human beings have a tendency to just focus on just the attribute. Think of priors as the underlying or the background knowledge which is essentially an additional bit of information in addition to the likelihood. A product of the priors together with likelihood determines the posterior odds/probability.

Rule 2 – Question your existing belief

This is somewhat tricky and counter-intuitive to grasp but question your priors. Present yourself with a hypothesis what if your priors were irrelevant or even wrong? How will that affect your posterior probability? Would the new posterior probability be any different than the existing one if your priors are irrelevant or even wrong?

Rule 3 – Update incrementally

We live in a dynamic world where evidence and attributes are constantly shifting. While it is okay to believe in well-tested priors and likelihoods in the present moment. However, always question does my priors & likelihood still hold true today? In other words, update your beliefs incrementally as new information or evidence surfaces. A good example of this would be the shifting sentiments of the financial markets. What holds true today, may not tomorrow? Hence, the priors and likelihoods must also be incrementally updated.

Conclusion

In conclusion, Bayesian Thinking is a powerful tool to hone your judgment skills. Developing Bayesian Thinking essentially tells us what to believe in and how much confident you are about that belief. It also allows us to shift our existing beliefs in light of new information or as the evidence unfolds. Hopefully, you now have a better understanding of Bayesian Thinking and why is it so important.

On that note, we would like to say DexLab Analytics is a premium data analytics training institute located in the heart of Delhi NCR. We provide intensive training on a plethora of data-centric subjects, including data science, Python and credit risk analytics. Stay tuned for more such interesting blogs and updates!

About the Author: Nish Lau Bakshi is a professional data scientist with an actuarial background and a passion to use the power of statistics to tackle various pressing, daily life problems.


Interested in a career in Data Analyst?

To learn more about Data Analyst with Advanced excel course – Enrol Now.
To learn more about Data Analyst with R Course – Enrol Now.
To learn more about Big Data Course – Enrol Now.

To learn more about Machine Learning Using Python and Spark – Enrol Now.
To learn more about Data Analyst with SAS Course – Enrol Now.
To learn more about Data Analyst with Apache Spark Course – Enrol Now.
To learn more about Data Analyst with Market Risk Analytics and Modelling Course – Enrol Now.

Upskill and Upgrade: The Mantra for Budding Data Scientists

Upskill and Upgrade: The Mantra for Budding Data Scientists

Have the right skills? Then the hottest jobs of the millennium might be waiting for you! The job profiles of data analysts, data scientists, data managers and statisticians harbour great potentials.

However, the biggest challenge in today’s age lies in preparing novice graduates for Industry 4.0 jobs. Although no one has yet cleared which roles will cease to exist and which new roles will be created, the consultants have started advising students to imbibe necessary skills and up-skill in domains that are likely to influence and carve the future jobs. Becoming adaptive is the best way to sail high in the looming technology-dominated future.

Data Science and Future

In this context, data science has proved to be one of the most promising fields of technology and science that exhibits a wide gap between demand and supply yet an absolute imperative across disciplines. “Today there is no shortage of data or computing abilities but there is a shortage of workforce equipped with the right skill set that can interpret data and get valuable insights,” revealed James Abdey, assistant professorial lecturer Statistics, London School of Economics and Political Science (LSE).

He further added that data science is a multidisciplinary field – drawing collectives from Economics, Mathematics, Finance, Statistics and more.

As a matter of fact, anyone, who has the right skill and expertise, can become a data scientist. The required skills are analytical thinking, problem-solving and decision-making aptitude. “As everything becomes data-driven, acquiring analytical and statistical skill sets will soon be imperative for all students, including those pursuing Social Sciences or Liberal Arts and also for professionals,” said Jitin Chadha, founder and director, Indian School of Business and Finance (ISBF).

DexLab Analytics is one of the most prominent deep learning training institutes seated in the heart of Delhi. We offer state-of-the-art in-demand skill training courses to all the interested candidates.

The Challenges Ahead

The dearth of expert training faculty and obsolete curriculum acts as major roadblocks to the success of data science training. Such hindrances cause difficulty in preparing graduates for Industry 4.0. In this regard, Chiraag Mehta from ISBF shared that by increasing international collaborations and intensifying industry-academia connect, they can formulate an effective solution and bring forth the best practices to the classrooms. “With international collaborations, higher education institutes can bring in the latest curriculum while a deeper industry-academia connect including, guest lecturers from industry players and internships will help students relate the theory to real-world applications, ” shared Mehta during an interview with Education Times.

2

Industry 4.0: A Brief Overview

The concept Industry 4.0 encompasses the potential of a new industrial revolution – where gathering and analyzing data across machines will become the order of the day. The rise of this new digital industrial revolution is expected to facilitate faster, more flexible and efficient processes to manufacture high-quality products at reduced costs – thus, increasing productivity, switch economies, stimulate industrial growth and reform workforce profile.

Want to know more about data science courses in Gurgaon? Feel free to reach us at DexLab Analytics.


The blog has been sourced fromtimesofindia.indiatimes.com/home/education/news/learn-to-upskill-and-be-adaptive/articleshow/68989949.cms


Interested in a career in Data Analyst?

To learn more about Data Analyst with Advanced excel course – Enrol Now.
To learn more about Data Analyst with R Course – Enrol Now.
To learn more about Big Data Course – Enrol Now.

To learn more about Machine Learning Using Python and Spark – Enrol Now.
To learn more about Data Analyst with SAS Course – Enrol Now.
To learn more about Data Analyst with Apache Spark Course – Enrol Now.
To learn more about Data Analyst with Market Risk Analytics and Modelling Course – Enrol Now.

Study: The Demand for Data Scientists is Likely to Rise Sharply

Study: The Demand for Data Scientists is Likely to Rise Sharply

Data is like the new oil. A large number of companies are leveraging artificial intelligence and big data to mine these vast volumes of data in today’s time. Data science is a promising landmine of job opportunities – and it’s high time to consider it as a successful career avenue.

The prospect of data science is skyrocketing. Today, it is estimated that more than 50000 data science and machine learning jobs are lying vacant. Plus, nearly 40000 new jobs are to be generated in India alone by 2020. If you follow the global trends, the role of data scientist has expanded over 650% since 2012 yet only 35000 people in the US are skilled enough.

Data scientists are like the platform that connects the dots between programming and implementation of data to solve challenging business intricacies – says Pankaj Muthe, Academic Program Manager (APAC), Company Spokesperson, QlikTech. The company delivers intuitive platform solutions for embedded analytics, self-service data visualizations and guided analytics and reporting across the globe.

According to a pool of experts, data science is the hottest job trend of this century and is the second most popular degree to have at the master level next to MBA. No wonder, this new breed of science and technology is believed to be driving a new wave of innovation! Data scientists and front-end developers attracted the highest remuneration across Indian startups throughout 2017.

2

Eligibility Criteria

To become a professional data scientist, a degree in computer science/engineering or mathematics is a must. Most of the data scientists have a knack for intricate tasks and aptitude to learn challenging programming languages. Any good organization seeks interested and intelligent candidates with the zeal to learn more. The subjects in which they need to be proficient are mathematics, statistics and programming. Moreover, data science jobs need a very sound base in machine learning algorithms, statistical modeling and neural networks as well as incredible communication skills.

Today, a lot of institutes offer state-of-the-art data science online courses that prove extremely beneficial for career growth and expansion. Combining theoretical knowledge and technical aspects of data science training, these institutes provide skill and assistance to develop real-world applications. DexLab Analytics is one such institute that is located in the heart of Delhi NCR. For more, feel free to reach us at <www.dexlabanalytics.com>

Future Prospects

After land, labour and capital, data ranks as the fourth factor of production. According to the US Department of Statistics, the demand for data engineers is likely to grow by 40% by 2020. If you are looking for a flourishing career option, this is the place to be: an entry-level engineer begins their career as a business analyst and then proceeds towards becoming a project manager. Later, after years of experience, these virgin business analysts further get promoted to become chief data officers.


Interested in a career in Data Analyst?

To learn more about Data Analyst with Advanced excel course – Enrol Now.
To learn more about Data Analyst with R Course – Enrol Now.
To learn more about Big Data Course – Enrol Now.

To learn more about Machine Learning Using Python and Spark – Enrol Now.
To learn more about Data Analyst with SAS Course – Enrol Now.
To learn more about Data Analyst with Apache Spark Course – Enrol Now.
To learn more about Data Analyst with Market Risk Analytics and Modelling Course – Enrol Now.
Know All about Usage-Driven Grouping of Programming Languages Used in Data Science

Know All about Usage-Driven Grouping of Programming Languages Used in Data Science

Programming skills are indispensable for data science professionals. The main job of machine learning engineers and data scientists is drawing insights from data, and their expertise in programming languages enable them to do this crucial task properly. Research has shown that professionals of the data science field typically work with three languages simultaneously. So, which ones are the most popular? Are some languages more likely to be used together?

Recent studies explain that certain programming languages are used jointly besides other programming languages that are used independently. With the survey data collected from Kaggle’s 2018 Machine Learning and Data Science study, usage patterns of over 18,000 data science experts working with 16 programming languages were analyzed. The research revealed that these languages can actually be categorized into smaller sets, resulting in 5 main groupings. The nature of the groupings is indicative of specific roles or applications that individual groups support, like analytics, front-end work and general-purpose tasks.

2

Principal Component Analysis for Dimension Reduction

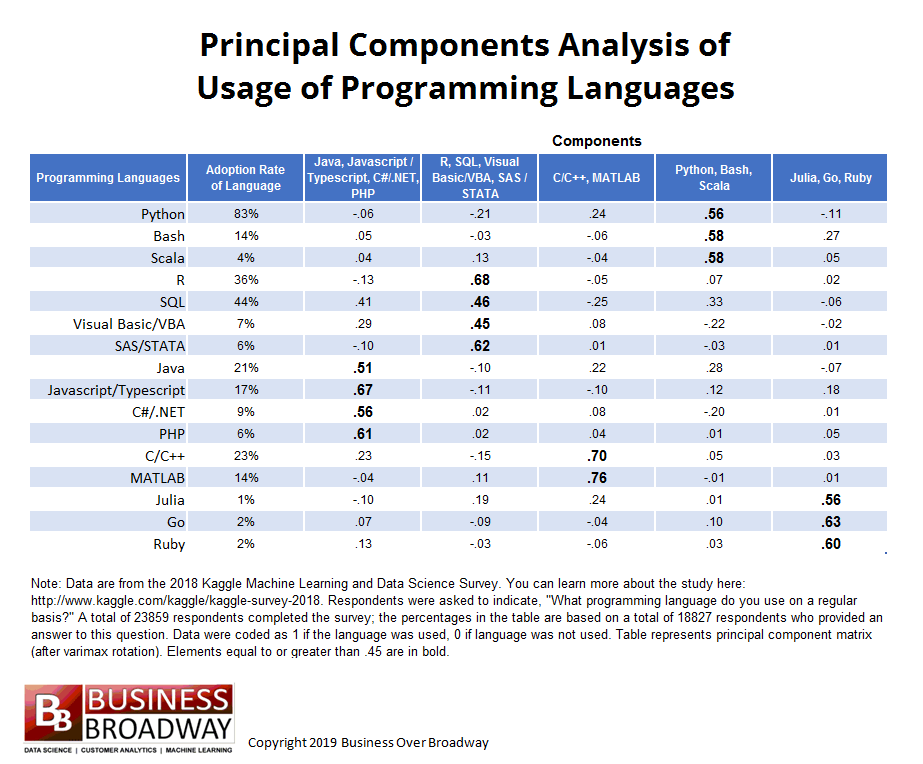
In this article, we will explain how Bob E. Hayes, PhD holder, scientist, blogger and data science writer has used principal component analysis, a type of data reduction method, to categorize 16 different programming languages. Herein, the relationship among various languages is inspected before putting them in particular groups. Basically, principal component analysis looks into statistical associations like covariance within a large collection of variables, and then justifies these correlations with the help of a few variables, called components.

Principal component matrix presents the results of this analysis. The matrix is an nXm table, where:

n= total no. of original variables, which in this case are the number of programming languages

m= number of main components

The strength of relationship between each language and underlying components is represented by the elements of the matrix. Overall, the principal component analysis of programming language usage gives us two important insights:

  • How many underlying components (groupings of programming languages) describe the preliminary set of languages
  • The languages that go best with each programming language grouping

Result of Principal Component Analysis:

The nature of this analysis is exploratory, meaning no pre-defined structure was imposed on the data. The result was primarily driven by the type of relationship shared by the 16 languages. The aim was to explain the relationships with as less components as possible. In addition, few rules of thumb were used to establish the number of components. One was to find the number of eigen values with value greater than 1 – that number determines the number of components. Another method is to identify the breaking point in the scree plot, which is a plot of the 16 eigen values.

businessoverbroadway.com


5-factor solution was chosen to describe the relationships. This is owing to two reasons – firstly, 5 eigen values were greater than one and secondly, the scree plot showed a breaking point around 6th eigen value.

Following are two key interpretations from the principal component matrix:

  • Values greater than equal to .45 have been made bold
  • The headings of different components are named on the basis of tools that loaded highly on that component. For example, component 4 has been labeled as Python, Bash, Scala because these languages loaded highest on this component, implying respondents are likely to use Bash and Scala if they work with Python. Other 4 components were labeled in a similar manner.

Groupings of Programming Languages

The given data set is appropriately described by 5 tool grouping. Below are given 5 groupings, including the particular languages that fall within the group, meaning they are likely to be used together.

  1. Java, Javascript/Typescript, C#/.NET, PHP
  2. R, SQL, Visual Basic/VBA, SAS/STATA
  3. C/C++, MATLAB
  4. Python, Bash, Scala
  5. Julia, Go, Ruby

One programming language didn’t properly load into any of the components: SQL. However, SQL is used moderately with three programming languages, namely Java (component 1), R (component 2) and Python (component 4).

It is further understood that the groupings are determined by the functionality of different languages in the group. General-purpose programming languages, Python, Scala and Bash, got grouped under a single component, whereas languages used for analytical studies, like R and the other languages under comp. 2, got grouped together. Web applications and front-end work are supported by Java and other tools under component 1.

Conclusion:

Data science enthusiasts can succeed better in their projects and boost their chances of landing specific jobs by choosing correct languages that are suited for the job role they want. Being skilled in a single programming language doesn’t cut it in today’s competitive industry. Seasoned data professionals use a set of languages for their projects. Hence, the result of the principal component analysis implies that it’s wise for data pros to skill up in a few related programming languages rather than a single language, and focus on a specific part of data science.

For more help with your data science learning, get in touch with DexLab Analytics, a leading data analyst training institute in Delhi. Also check our Machine learning courses in Delhi to be trained in the essential and latest skills in the field.

 
Reference: http://customerthink.com/usage-driven-groupings-of-data-science-and-machine-learning-programming-languages
 

Interested in a career in Data Analyst?

To learn more about Data Analyst with Advanced excel course – Enrol Now.
To learn more about Data Analyst with R Course – Enrol Now.
To learn more about Big Data Course – Enrol Now.

To learn more about Machine Learning Using Python and Spark – Enrol Now.
To learn more about Data Analyst with SAS Course – Enrol Now.
To learn more about Data Analyst with Apache Spark Course – Enrol Now.
To learn more about Data Analyst with Market Risk Analytics and Modelling Course – Enrol Now.
Discover Top 5 Data Scientist Archetypes

Discover Top 5 Data Scientist Archetypes

Data science jobs are labelled as the hottest job of the 21st century. For the last few years, this job profile is indeed gaining accolades. And yes, that’s a good thing! Although much has been said about how to progress towards a successful career as a data scientist, little do we know about the types of data scientists you may come across in the industry! In this blog, we are going to explore the various kinds of data scientists or simply put – the data scientist archetypes found in every organization.

Generalist

This is the most common type of data scientists you find in every industry. The Generalist contains an exemplary mixture of skill and expertise in data modelling, technical engineering, data analysis and mechanics. These data scientists interact with researchers and experts in the team. They are the ones who climb up to the Tier-1 leadership teams, and we aren’t complaining!

Detective

He is the one who is prudent and puts enough emphasis on data analysis. This breed of data scientists knows how to play with the right data, incur insights and derive conclusions. The researchers say, with an absolute focus on analysis, a detective is familiar with numerous engineering and modelling techniques and methods.

Maker

The crop of data scientists who are obsessed with data engineering and architecture are known as the Makers. They know how to transform a petty idea into concrete machinery. The core attribute of a Maker is his knowledge in modelling and data mechanisms, and that’s what makes the project reach heights of success in relatively lesser time.

Enrol in one of the best data science courses in Gurgaon from DexLab Analytics.

Oracle

Having mastered the art and science of machine learning, the Oracle data scientist is rich in experience and full of expertise. Tackling the meat of the problem cracks the deal. Also called as data ninjas, these data scientists possess the right know how of how to deal with specific tools and techniques of analysis and solve crucial challenges. Elaborate experience in data modelling and engineering helps!

Unicorn

The one who runs the entire data science team and is the leader of the team is the Unicorn. A Unicorn data scientist is reckoned to be a data ninja or an expert in all aspects of data science domain and stays a toe ahead to nurture all the data science nuances and concepts. The term is basically a fusion version of all the archetypes mentioned above weaved together – the job responsibility of a data unicorn is impossible to suffice, but it’s a long road, peppered with various archetypes as a waypoint.

Organizations across the globe, including media, telecom, banking and financial institutions, market research companies, etc. are generating data of various types. These large volumes of data call for impeccable data analysis. For that, we have these data science experts – they are well-equipped with desirable data science skills and are in high demand throughout industry verticals.

Thinking of becoming a data ninja? Try data science courses in Delhi NCR: they are encompassing, on-point and industry-relevant.


The blog has been sourced from  ― www.analyticsindiamag.com/see-the-6-data-scientist-archetypes-you-will-find-in-every-organisation


Interested in a career in Data Analyst?

To learn more about Data Analyst with Advanced excel course – Enrol Now.
To learn more about Data Analyst with R Course – Enrol Now.
To learn more about Big Data Course – Enrol Now.

To learn more about Machine Learning Using Python and Spark – Enrol Now.
To learn more about Data Analyst with SAS Course – Enrol Now.
To learn more about Data Analyst with Apache Spark Course – Enrol Now.
To learn more about Data Analyst with Market Risk Analytics and Modelling Course – Enrol Now.
How to Build and Maintain Successful Data Science Teams?

How to Build and Maintain Successful Data Science Teams?

Businesses are becoming smarter. They are unleashing a bigger impact. Driven by innovation and humongous volumes of data, organizations observe market trends and predict customer behavioral patterns – no wonder, this industry is the right place to incubate newer technologies and explore higher horizons.

Data science is the bull’s eye of this new-age industry. It is unabashedly predictive rather than being conclusive. As a result, garnering cross-team collaborations in this particular field of science may turn a bit challenging. A good data science team is a combination of talented professionals, high intellect, powerful body of knowledge and advanced data-tackling skills.

To give you a hand, we’ve rounded up top trends or tips to follow to get to the bottom of the art of running successful data science teams:

2

Diversity is the Key

Diverse backgrounds, on-point technical expertise and voluminous domain knowledge is what makes a data science team high on diversity. A healthy concoction of machine learning skills, knowledge in mathematics and statistics and conversational skills is critical for a productive team. Just having one or two skills is simply not enough, anymore!

Structure and Prioritize

Once you have a team by your side, you need to start structuring an operating model. The data needs to be deconstructed into sizeable prioritized slices. After that, every data-related measure should be backed by needful communication – it helps in determining the bottlenecks and devise effective solutions.

Experimentation Helps

Experimentation is crucial as well as important. Unless you experiment, you can never scale new heights and this is equally applicable in data science. In the sprawling field of data science, every project starts with a challenge and a set of hypothesis that addresses it. However, you won’t find any particular roadmap to success. Hence, it opens a lot of room for innovation and experimentation.

Collective Responsibility

Yielding data science initiatives demand absolute cooperation, collaborative responsibilities and fine reporting structures. A healthy coordination between analytics and business teams, specifically IT, is extremely important for overall business success. Data science experts need to collaborate with each other and strike a tone of success.

Data Accuracy

Gain access to data bank and fine-tune the accuracy of your analysis. Business users leverage improved functional tools of analytics for overall business success. Data is the key, and data availability and quality are the pillars on which organizations stand. Therefore, we suggest practice data accuracy for improved data analytics and boost future business goals.

Today, online resources and libraries can help you almost everything. What they cannot do is feed you is the underlying intricacies of data science and how to devise an effective solution utilizing the base knowledge of mathematics, statistics and machine learning technology. For these, you need an expert Data Science Certification – it will help you discover the grey unknown territories of data and educate you on how to tame them.

Reach us at DexLab Analytics – we offer in-demand data science courses for students and professional, both.


The blog has been sourced fromwww.analyticsindiamag.com/the-art-of-running-successful-data-science-teams


Interested in a career in Data Analyst?

To learn more about Data Analyst with Advanced excel course – Enrol Now.
To learn more about Data Analyst with R Course – Enrol Now.
To learn more about Big Data Course – Enrol Now.

To learn more about Machine Learning Using Python and Spark – Enrol Now.
To learn more about Data Analyst with SAS Course – Enrol Now.
To learn more about Data Analyst with Apache Spark Course – Enrol Now.
To learn more about Data Analyst with Market Risk Analytics and Modelling Course – Enrol Now.
How Students Select a Good Data Science Course?

How Students Select a Good Data Science Course

Data science and analytics are in hype. This time, we decided to know what students look for while arming themselves in this new age field of study. For that, we bring you Analytics India Magazine’s recent survey.

We are on an interesting endeavor to tap into the key areas that IT professionals and aspiring candidates look up to for lessening the learning gap. Ready to join us?

Disclaimer – the below opinions are from budding data scientists – from young IT employees to fresh graduates; we have compiled them and presented in a concise way. All thanks to AIM.

2

What key element to consider in a data science or analytics course?

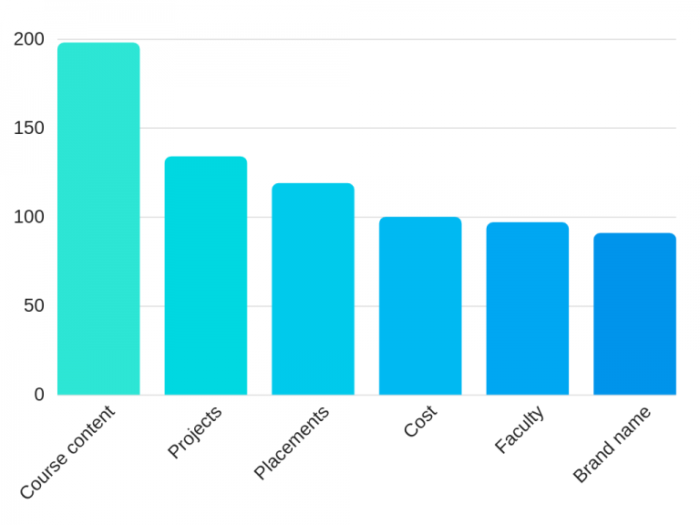
For students, there are many preconceived notions about a course’s curriculum, faculty, brand name and even fellow batch mates. No wonder, it’s always tricky to focus only on a single key element.

Nevertheless, going by the survey, the respondents voted the most for course content, only to be seconded by hands-on experience. Yes, course content is the life and soul of data science and analytics training program. But, it’s not enough, it has to be supplemented by good hands-on experience and placement opportunities.

For more,

What should be the duration of the data science or analytics course?

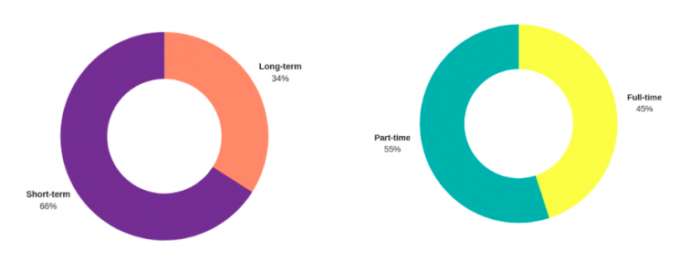
Short-term or long-term? This is a very common question plaguing the minds of interested candidates –in the recent survey, more than 66% of respondents said they would choose short-term programme over long-term, and almost 55% said that they would prefer part-time skill-training programme than full-time.

What format would you chose for data science training courses?

Always, course curriculum should be in an easy to learn format. When the expert guys at AIM asked the respondents what kind of format do they prefer for their educational course, this is what they revealed:

  • 47% or more voted for a hybrid format of education
  • 28% said they prefer online learning method
  • Less than 25% of the candidates said they would like to stick to the old-school classroom method of teaching

What about Capstone Projects and Placements?

Capstone Projects are important. 92% of respondents vouched for that.

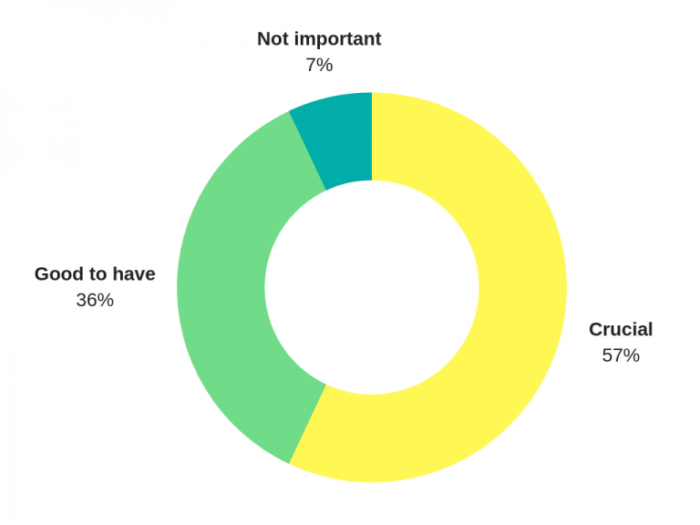
Another 57% said that placements are crucial too if you are thinking of making a mark in the competitive tech industry. Up-skilling is the key in today’s world.

When is the best time to opt for a data science course?

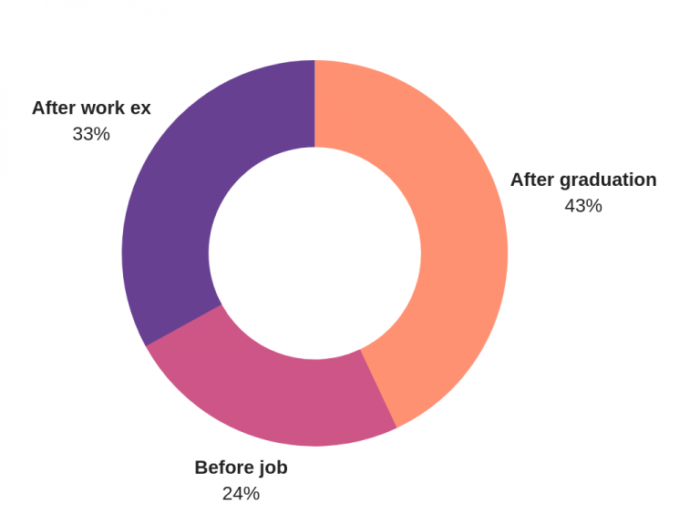
There’s nothing like the best time to enroll in a data science and analytics course. Anytime, you can start learning. However, the 43% of respondents believe that it’s better to take up business analyst training course right after graduation or post graduation.

On the other hand, 33% think that gaining some work experience prior to start training would be helpful.

For more such updates, watch this space.

If you are looking for a decent data analyst training institute in Gurgaon, DexLab Analytics fits the bill right. Drop by their site and gather information.


Interested in a career in Data Analyst?

To learn more about Data Analyst with Advanced excel course – Enrol Now.
To learn more about Data Analyst with R Course – Enrol Now.
To learn more about Big Data Course – Enrol Now.

To learn more about Machine Learning Using Python and Spark – Enrol Now.
To learn more about Data Analyst with SAS Course – Enrol Now.
To learn more about Data Analyst with Apache Spark Course – Enrol Now.
To learn more about Data Analyst with Market Risk Analytics and Modelling Course – Enrol Now.
Call us to know more