Data Science Classes Archives - DexLab Analytics | Big Data Hadoop SAS R Analytics Predictive Modeling & Excel VBA

MongoDB Basics Part-II

In our previous blog we discussed about few of the basic functions of MQL like .find() , .count() , .pretty() etc. and in this blog we will continue to do the same. At the end of the blog there is a quiz for you to solve, feel free to test your knowledge and wisdom you have gained so far.

Given below is the list of functions that can be used for data wrangling:-

  1. updateOne() :- This function is used to change the current value of a field in a single document.

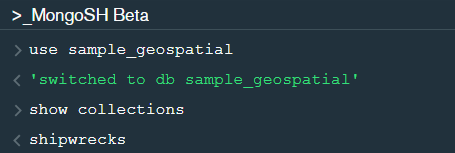
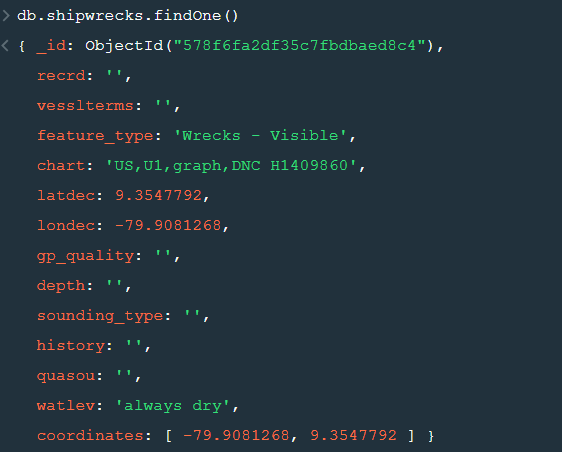
After changing the database to “sample_geospatial” we want to see what the document looks like? So for that we will use .findOne() function.

Now lets update the field value of “recrd” from ‘ ’ to “abc” where the “feature_type” is ‘Wrecks-Visible’.

Now within the .updateOne() funtion any thing in the first part of { } is the condition on the basis of which we want to update the given document and the second part is the changes which we want to make. Here we are saying that set the value as “abc” in the “recrd” field . In case you wanted to increase the value by a certain number ( assuming that the value is integer or float) you can use “$inc” instead.

2. updateMany() :- This function updates many documents at once based on the condition provided.

3. deleteOne() & deleteMany() :- These functions are used to delete one or many documents based on the given condition or field.

4. Logical Operators :-

“$and” : It is used to match all the conditions.

“$or” : It is used to match any of the conditions.

The first code matches both the conditions i.e. name should be “Wetpaint” and “category_code” should be “web”, whereas the second code matches any one of the conditions i.e. either name should be “Wetpaint” or “Facebook”. Try these codes and see the difference by yourself.


So, with that we come to the end of the discussion on the MongoDB Basics. Hopefully it helped you understand the topic, for more information you can also watch the video tutorial attached down this blog. The blog is designed and prepared by Niharika Rai, Analytics Consultant, DexLab Analytics DexLab Analytics offers machine learning courses in Gurgaon. To keep on learning more, follow DexLab Analytics blog.


.

Introduction to MongoDB

MongoDB is a document based database program which was developed by MongoDB Inc. and is licensed under server side public license (SSPL). It can be used across platforms and is a non-relational database also known as NoSQL, where NoSQL means that the data is not stored in the conventional tabular format and is used for unstructured data as compared to SQL and that is the major difference between NoSQL and SQL.
MongoDB stores document in JSON or BSON format. JSON also known as JavaScript Object notation is a format where data is stored in a key value pair or array format which is readable for a normal human being whereas BSON is nothing but the JSON file encoded in the binary format which is quite hard for a human being to understand.
Structure of MongoDB which uses a query language MQL(Mongodb query language):-
Databases:- Databases is a group of collections.
Collections:- Collection is a group fields.
Fields:- Fields are nothing but key value pairs
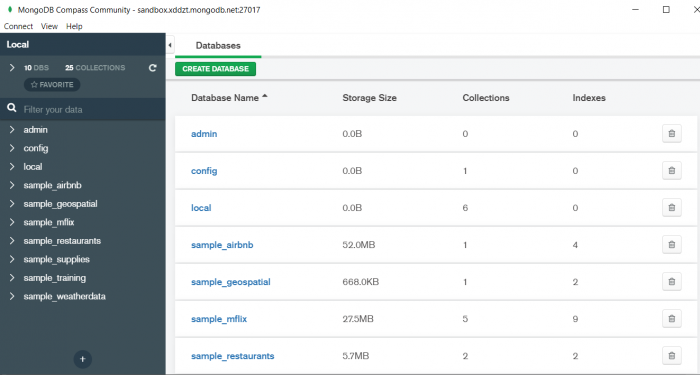
Just for an example look at the image given below:-

Here I am using MongoDB Compass a tool to connect to Atlas which is a cloud based platform which can help us write our queries and start performing all sort of data extraction and deployment techniques. You can download MongoDB Compass via the given link https://www.mongodb.com/try/download/compass

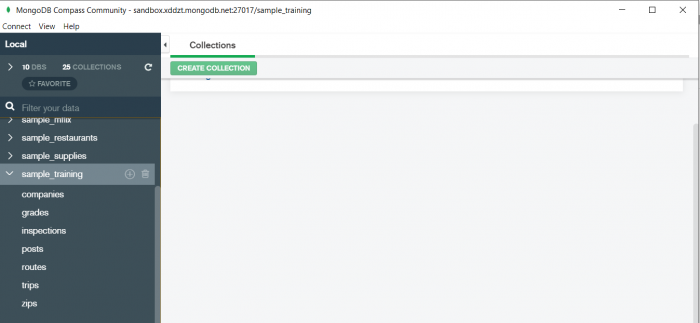
In the above image in the red box we have our databases and if we click on the “sample_training” database we will see a list of collections similar to the tables in sql.

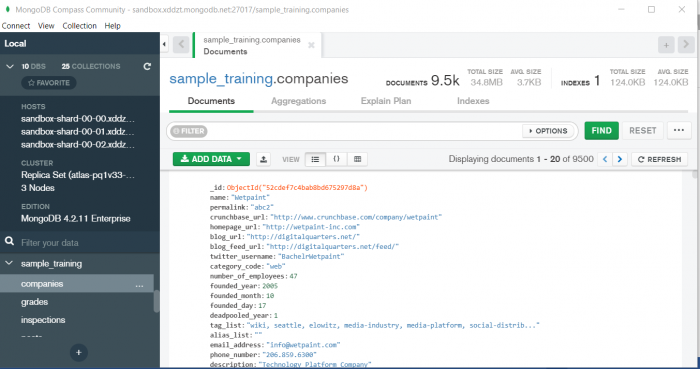
Now lets write our first query and see what data in “companies” collection looks like but before that select the “companies” collection.

Now in our filter cell we can write the following query:-

In the above query “name” and “category_code” are the key values also known as fields and “Wetpaint” and “web” are the pair values on the basis of which we want to filter the data.
What is cluster and how to create it on Atlas?
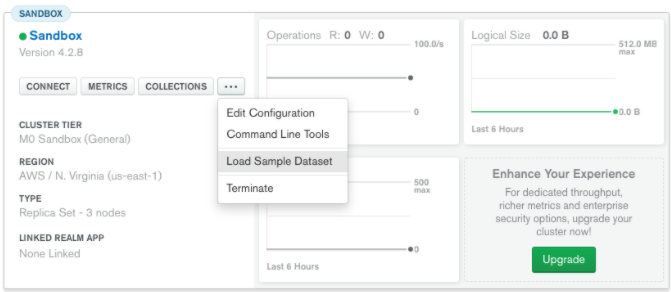
MongoDB cluster also know as sharded cluster is created where each collection is divided into shards (small portions of the original data) which is a replica set of the original collection. In case you want to use Atlas there is an unpaid version available with approximately 512 mb space which is free to use. There is a pre-existing cluster in MongoDB named Sandbox , which currently I am using and you can use it too by following the given steps:-
1. Create a free account or sign in using your Google account on
https://www.mongodb.com/cloud/atlas/lp/try2-in?utm_source=google&utm_campaign=gs_apac_india_search_brand_atlas_desktop&utm_term=mongodb%20atlas&utm_medium=cpc_paid_search&utm_ad=e&utm_ad_campaign_id=6501677905&gclid=CjwKCAiAr6-ABhAfEiwADO4sfaMDS6YRyBKaciG97RoCgBimOEq9jU2E5N4Jc4ErkuJXYcVpPd47-xoCkL8QAvD_BwE
2. Click on “Create an Organization”.
3. Write the organization name “MDBU”.
4. Click on “Create Organization”.
5. Click on “New Project”.
6. Name your project M001 and click “Next”.
7. Click on “Build a Cluster”.
8. Click on “Create a Cluster” an option under which free is written.
9. Click on the region closest to you and at the bottom change the name of the cluster to “Sandbox”.
10. Now click on connect and click on “Allow access from anywhere”.
11. Create a Database User and then click on “Create Database User”.
username: m001-student
password: m001-mongodb-basics
12. Click on “Close” and now load your sample as given below :

Loading may take a while….
13. Click on collections once the sample is loaded and now you can start using the filter option in a similar way as in MongoDB Compass
In my next blog I’ll be sharing with you how to connect Atlas with MongoDB Compass and we will also learn few ways in which we can write query using MQL.

So, with that we come to the end of the discussion on the MongoDB. Hopefully it helped you understand the topic, for more information you can also watch the video tutorial attached down this blog. The blog is designed and prepared by Niharika Rai, Analytics Consultant, DexLab Analytics DexLab Analytics offers machine learning courses in Gurgaon. To keep on learning more, follow DexLab Analytics blog.


.
ARIMA (Auto-Regressive Integrated Moving Average)

arima-time series-dexlab analytics

This is another blog added to the series of time series forecasting. In this particular blog  I will be discussing about the basic concepts of ARIMA model.

So what is ARIMA?

ARIMA also known as Autoregressive Integrated Moving Average is a time series forecasting model that helps us predict the future values on the basis of the past values. This model predicts the future values on the basis of the data’s own lags and its lagged errors.

When a  data does not reflect any seasonal changes and plus it does not have a pattern of random white noise or residual then  an ARIMA model can be used for forecasting.

There are three parameters attributed to an ARIMA model p, q and d :-

p :- corresponds to the autoregressive part

q:- corresponds to the moving average part.

d:- corresponds to number of differencing required to make the data stationary.

In our previous blog we have already discussed in detail what is p and q but what we haven’t discussed is what is d and what is the meaning of differencing (a term missing in ARMA model).

Since AR is a linear regression model and works best when the independent variables are not correlated, differencing can be used to make the model stationary which is subtracting the previous value from the current value so that the prediction of any further values can be stabilized .  In case the model is already stationary the value of d=0. Therefore “differencing is the minimum number of deductions required to make the model stationary”. The order of d depends on exactly when your model becomes stationary i.e. in case  the autocorrelation is positive over 10 lags then we can do further differencing otherwise in case autocorrelation is very negative at the first lag then we have an over-differenced series.

The formula for the ARIMA model would be:-

To check if ARIMA model is suited for our dataset i.e. to check the stationary of the data we will apply Dickey Fuller test and depending on the results we will  using differencing.

In my next blog I will be discussing about how to perform time series forecasting using ARIMA model manually and what is Dickey Fuller test and how to apply that, so just keep on following us for more.

So, with that we come to the end of the discussion on the ARIMA Model. Hopefully it helped you understand the topic, for more information you can also watch the video tutorial attached down this blog. The blog is designed and prepared by Niharika Rai, Analytics Consultant, DexLab Analytics DexLab Analytics offers machine learning courses in Gurgaon. To keep on learning more, follow DexLab Analytics blog.


.
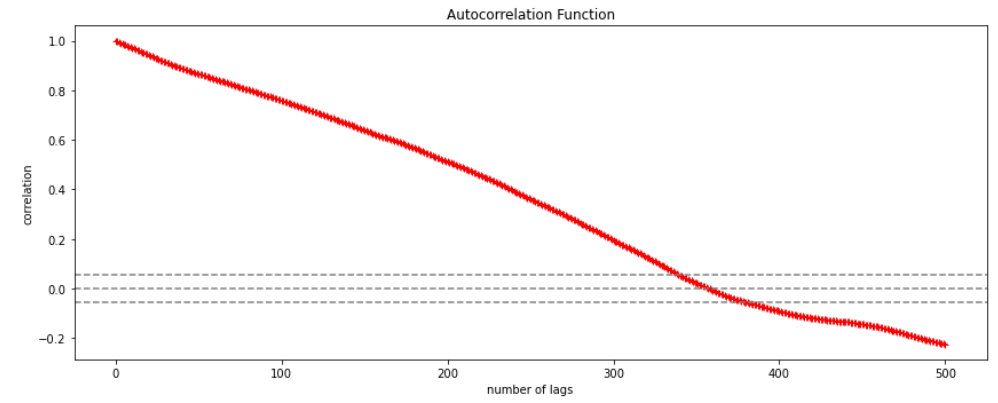
Autocorrelation- Time Series – Part 3

Autocorrelation is a special case of correlation. It refers to the relationship between successive values of the same variables .For example if an individual with a consumption pattern:-

spends too much in period 1 then he will try to compensate that in period 2 by spending less than usual. This would mean that Ut is correlated with Ut+1 . If it is plotted the graph will appear as follows :

Positive Autocorrelation : When the previous year’s error effects the current year’s error in such a way that when a graph is plotted the line moves in the upward direction or when the error of the time t-1 carries over into a positive error in the following period it is called a positive autocorrelation.
Negative Autocorrelation : When the previous year’s error effects the current year’s error in such a way that when a graph is plotted the line moves in the downward direction or when the error of the time t-1 carries over into a negative error in the following period it is called a negative autocorrelation.

Now there are two ways of detecting the presence of autocorrelation
By plotting a scatter plot of the estimated residual (ei) against one another i.e. present value of residuals are plotted against its own past value.

If most of the points fall in the 1st and the 3rd quadrants , autocorrelation will be positive since the products are positive.

If most of the points fall in the 2nd and 4th quadrant , the autocorrelation will be negative, because the products are negative.
By plotting ei against time : The successive values of ei are plotted against time would indicate the possible presence of autocorrelation .If e’s in successive time show a regular time pattern, then there is autocorrelation in the function. The autocorrelation is said to be negative if successive values of ei changes sign frequently.
First Order of Autocorrelation (AR-1)
When t-1 time period’s error affects the error of time period t (current time period), then it is called first order of autocorrelation.
AR-1 coefficient p takes values between +1 and -1
The size of this coefficient p determines the strength of autocorrelation.
A positive value of p indicates a positive autocorrelation.
A negative value of p indicates a negative autocorrelation
In case if p = 0, then this indicates there is no autocorrelation.
To explain the error term in any particular period t, we use the following formula:-

Where Vt= a random term which fulfills all the usual assumptions of OLS
How to find the value of p?

One can estimate the value of ρ by applying the following formula :-

Time Series Analysis & Modelling with Python (Part II) – Data Smoothing

dexlab_time_series

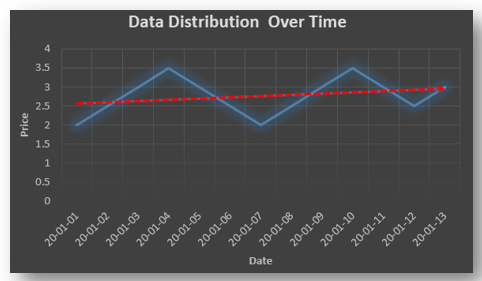
Data Smoothing is done to better understand the hidden patterns in the data. In the non- stationary processes, it is very hard to forecast the data as the variance over a period of time changes, therefore data smoothing techniques are used to smooth out the irregular roughness to see a clearer signal.

In this segment we will be discussing two of the most important data smoothing techniques :-

  • Moving average smoothing
  • Exponential smoothing

Moving average smoothing

Moving average is a technique where subsets of original data are created and then average of each subset is taken to smooth out the data and find the value in between each subset which better helps to see the trend over a period of time.

Lets take an example to better understand the problem.

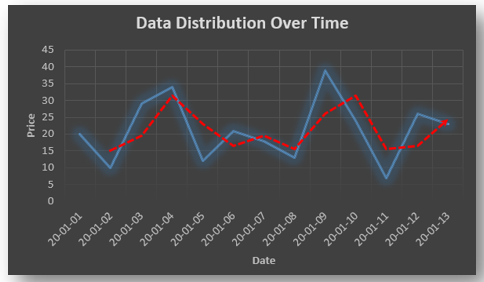
Suppose that we have a data of price observed over a period of time and it is a non-stationary data so that the tend is hard to recognize.

QTR (quarter)Price
110
211
318
414
515
6?


In the above data we don’t know the value of the 6th quarter.

….fig (1)

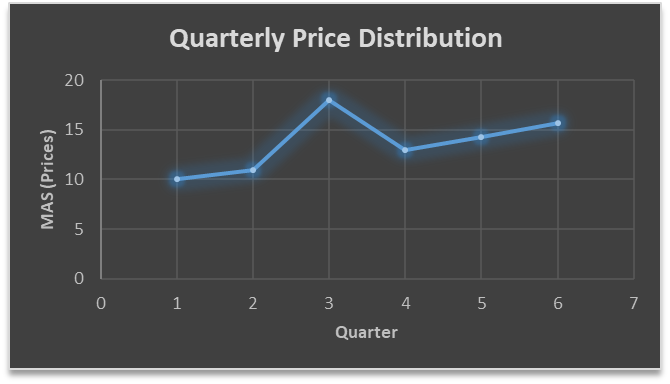
The plot above shows that there is no trend the data is following so to better understand the pattern we calculate the moving average over three quarter at a time so that we get in between values as well as we get the missing value of the 6th quarter.

To find the missing value of 6th quarter we will use previous three quarter’s data i.e.

MAS =  = 15.7

QTR (quarter)Price
110
211
318
414
515
615.7

MAS =  = 13

MAS =  = 14.33

QTR (quarter)PriceMAS (Price)
11010
21111
31818
41413
51514.33
615.715.7


….. fig (2)

In the above graph we can see that after 3rd quarter there is an upward sloping trend in the data.

Exponential Data Smoothing

In this method a larger weight ( ) which lies between 0 & 1 is given to the most recent observations and as the observation grows more distant the weight decreases exponentially.

The weights are decided on the basis how the data is, in case the data has low movement then we will choose the value of  closer to 0 and in case the data has a lot more randomness then in that case we would like to choose the value of  closer to 1.

EMA= Ft= Ft-1 + (At-1 – Ft-1)

Now lets see a practical example.

For this example we will be taking  = 0.5

Taking the same data……

QTR (quarter)Price

(At)

EMS Price(Ft)
11010
211?
318?
414?
515?
6??


To find the value of yellow cell we need to find out the value of all the blue cells and since we do not have the initial value of F1 we will use the value of A1. Now lets do the calculation:-

F2=10+0.5(10 – 10) = 10

F3=10+0.5(11 – 10) = 10.5

F4=10.5+0.5(18 – 10.5) = 14.25

F5=14.25+0.5(14 – 14.25) = 14.13

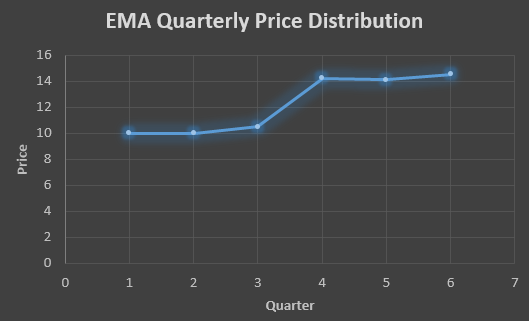
F6=14.13+0.5(15 – 14.13)= 14.56

QTR (quarter)Price

(At)

EMS Price(Ft)
11010
21110
31810.5
41414.25
51514.13
614.5614.56

In the above graph we see that there is a trend now where the data is moving in the upward direction.

So, with that we come to the end of the discussion on the Data smoothing method. Hopefully it helped you understand the topic, for more information you can also watch the video tutorial attached down this blog. The blog is designed and prepared by Niharika Rai, Analytics Consultant, DexLab Analytics DexLab Analytics offers machine learning courses in Gurgaon. To keep on learning more, follow DexLab Analytics blog.


.

Time Series Analysis Part I


A time series is a sequence of numerical data in which each item is associated with a particular instant in time. Many sets of data appear as time series: a monthly sequence of the quantity of goods shipped from a factory, a weekly series of the number of road accidents, daily rainfall amounts, hourly observations made on the yield of a chemical process, and so on. Examples of time series abound in such fields as economics, business, engineering, the natural sciences (especially geophysics and meteorology), and the social sciences.

  • Univariate time series analysis- When we have a single sequence of data observed over time then it is called univariate time series analysis.
  • Multivariate time series analysis – When we have several sets of data for the same sequence of time periods to observe then it is called multivariate time series analysis.

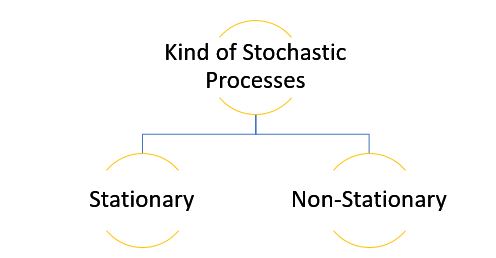
The data used in time series analysis is a random variable (Yt) where t is denoted as time and such a collection of random variables ordered in time is called random or stochastic process.

Stationary: A time series is said to be stationary when all the moments of its probability distribution i.e. mean, variance , covariance etc. are invariant over time. It becomes quite easy forecast data in this kind of situation as the hidden patterns are recognizable which make predictions easy.

Non-stationary: A non-stationary time series will have a time varying mean or time varying variance or both, which makes it impossible to generalize the time series over other time periods.

Non stationary processes can further be explained with the help of a term called Random walk models. This term or theory usually is used in stock market which assumes that stock prices are independent of each other over time. Now there are two types of random walks:
Random walk with drift : When the observation that is to be predicted at a time ‘t’ is equal to last period’s value plus a constant or a drift (α) and the residual term (ε). It can be written as
Yt= α + Yt-1 + εt
The equation shows that Yt drifts upwards or downwards depending upon α being positive or negative and the mean and the variance also increases over time.
Random walk without drift: The random walk without a drift model observes that the values to be predicted at time ‘t’ is equal to last past period’s value plus a random shock.
Yt= Yt-1 + εt
Consider that the effect in one unit shock then the process started at some time 0 with a value of Y0
When t=1
Y1= Y0 + ε1
When t=2
Y2= Y1+ ε2= Y0 + ε1+ ε2
In general,
Yt= Y0+∑ εt
In this case as t increases the variance increases indefinitely whereas the mean value of Y is equal to its initial or starting value. Therefore the random walk model without drift is a non-stationary process.

So, with that we come to the end of the discussion on the Time Series. Hopefully it helped you understand time Series, for more information you can also watch the video tutorial attached down this blog. DexLab Analytics offers machine learning courses in delhi. To keep on learning more, follow DexLab Analytics blog.


.

Theory of Estimation Part-I: The Introduction

Theory of Estimation Part-I: The Introduction

The theory of estimation is a branch in statistics that provides numerical values of the unknown parameters of the population on the basis of the measured empirical data that has a random component. This is a process of guessing the underlying properties of the population by observing the sample that has been taken from the population. The idea behind this is to calculate and find out the approximate values of the population parameter on the basis of a sample statistics.

Population:- All the items in any field of inquiry constitutes to a “Population”. For example all the employees of a factory is a population of that factory and the population mean is represented and the size of the population is represented by  N.

Sample:- Selection of few items from the population constitutes to a sample and the mean of the sample is represented by  and the sample size is represented by n

Statistics:- Any statistical measure calculated on the basis of sample observations is called Statistic. Like sample mean, sample standard deviation, etc.

Estimator:- In general estimator acts as a rule, a measure computed on the basis of the sample which tells us how to calculate the values of the estimate. It is a functional form of all sample observations prorating a representative value of the collected sample.

Suppose we have a random sample x_1,x_2,…,x_n on a variable x, whose distribution in the population involves an unknown parameter. It is required to find an estimate of on the basis of sample values.

Unbiasedness:-A statistic t is said to be an unbiased estimator if E(β ̂)= βi.e. observed value is equal to the expected value. In case E(β ̂)≠ β then the estimator is biased estimator.

Consistency:- One of the most desirable property of good estimator is that its accuracy should increase when the sample becomes larger i.e. the error between the expected value and the observed value reduces as the size of the sample increases E(β ̂ )- β=0

Efficiency:-An estimator is said to be an efficient estimator if it has the smallest variance compared to all the consistent and unbiased estimators. If consistent estimator exists whose sampling variance is less than that of any other consistent estimator, it is said to be “most efficient”; and it provides a standard for the measurement of ‘efficiency’ of a statistic.

Data Science Machine Learning Certification

Sufficiency:- An estimator is said to be sufficient if it contains all information in the sample about .

At the end of this discussion, hopefully, you have learned what theory of estimation is. Watch the video tutorial attached below to learn more about this. DexLab Analytics is a data science training institute in gurgaon, that offers advanced courses. Follow the blog section to access more informative posts like this.


.

Linear Regression Part II: Predictive Data Analysis Using Linear Regression

Linear Regression Part II: Predictive Data Analysis Using Linear Regression

In our previous blog we studied about the basic concepts of Linear Regression and its assumptions and let’s practically try to understand how it works.

Given below is a dataset for which we will try to generate a linear function i.e.

y=b0+b1Xi

Where,

y= Dependent variable

Xi= Independent variable

b0 = Intercept (coefficient)

b1 = Slope (coefficient)

To find out beta (b0& b1) coefficients we use the following formula:-

Let’s start the calculation stepwise.

  1. First let’s find the mean of x and y and then find out the difference between the mean values and the Xi and Yie. (x-x ̅ ) and (y-y ̅ ).
  2. Now calculate the value of (x-x ̅ )2 and (y-y ̅ )2. The variation is squared to remove the negative signs otherwise the summation of the column will be 0.
  3. Next we need to see how income and consumption simultaneously variate i.e. (x-x ̅ )* (y-y ̅ )

Now all there is left is to use the above calculated values in the formula:-

As we have the value of beta coefficients we will be able to find the y ̂(dependent variable) value.

We need to now find the difference between the predicted y ̂ and observed y which is also called the error term or the error.

To remove the negative sign lets square the residual.

What is R2 and adjusted R2 ?

R2 also known as goodness of fit is the ratio of the difference between observed y and predicted  and the observed y and the mean value of y.

Hopefully, now you have understood how to solve a Linear Regression problem and would apply what you have learned in this blog. You can also follow the video tutorial attached down the blog. You can expect more such informative posts if you keep on following the DexLab Analytics blog. DexLab Analytics provides data Science certification courses in gurgaon.


.

ANOVA Part-II: What is Two-way ANOVA?

ANOVA Part-II What is Two-way ANOVA

In my previous blog, I have already introduced you to a statistical term called ANOVA and I have also explained you what one-way ANOVA is? Now in this particular blog I will explain the meaning of two-way ANOVA.

The below image shows few tests to check the relationship/variation among variables or samples. When it comes to research analysis the first thing that we should do is to understand the sample which we have and then try to disintegrate the dataset to form and understand the relationship between two or more variables to derive some kind of conclusion. Once the relation has been established, our job is to test that relationship between variables so that we have a solid evidence for or against them. In case we have to check for variation among different samples, for example if the quality of seed is affecting the productivity we have to test if it is happening by chance or because of some reason. Under these kind of situations one-way ANOVA comes in handy (analysis on the basis of a single factor).

Two-way ANOVA

Two-way ANOVA is used when we are testing the variations among samples on the basis two factors. For example testing variation on the basis of seed quality and fertilizer.

Hopefully you have understood what Two-way ANOVA is. If you need more information, check out the video tutorial attached down the blog. Keep on following the DexLab Analytics blog, to find more information about Data Science, Artificial Intelligence. DexLab Analytics offers data Science certification courses in gurgaon.


.

Call us to know more