Data Science Certification Archives - Page 14 of 17 - DexLab Analytics | Big Data Hadoop SAS R Analytics Predictive Modeling & Excel VBA

After Chess, Draughts and Backgammon, How Google’s AlphaGo Win at Go

After Chess, Draughts and Backgammon, How Google’s AlphaGo Win at Go

Two decades ago, if someone asked me to write a computer program that played tic-tac-toe, I would have failed horribly. Now being an accomplished computer programmer, I know the desirable tricks to solve tic-tac-toe with the help of “Minimax Algorithm”, and what it takes is just about an hour to jot down the program. No doubt, my coding skills have evolved over the period of time, but also computer science technology has reached unattainable heights.

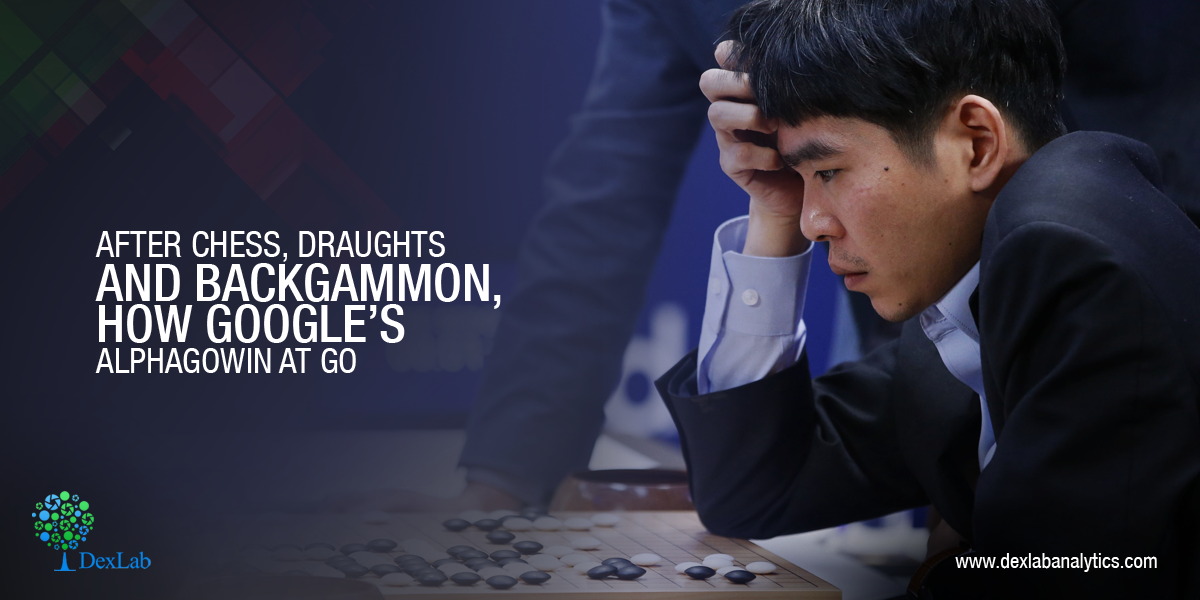
Computers paved the ways for a startled innovation. When in 1997, IBM introduced a chess-playing computer, known as Deep Blue, which eventually beat world-renowned Grandmaster Garry Kasparov in a six-game match, people remained in awe for years. Following the trend, in 2016, Google’s London-based AI Company, DeepMind launched AlphaGo – and it mastered over the ancient board game Go. Computers have outplayed the best human players in the games of chess, draughts and backgammon, now it’s time for Go.

Also read: Infographic: How Big Data Analytics Can Help To Boost Company Sales?

The technology goes on thriving, beating humans at games. In late May, AlphaGo is all set to take on its human rival Ke Jie, the best player in the world during the Future of Go Summit in Wuzhen, China. Games, which solely relied on human intelligence, wit, intuition, discern is now excelled by the AI, which is powered by improved engineering and computer superiority.

Also read: Top Databases of 2017 to Watch Out For

Don’t you think this is great! Where AI is driving our cars, looking for ways to cure deadly cancer and helping us in everyday work, winning at Go takes AI a step ahead. It not only makes the games more fun and exciting, but endlessly enjoyable.

The strategy explained

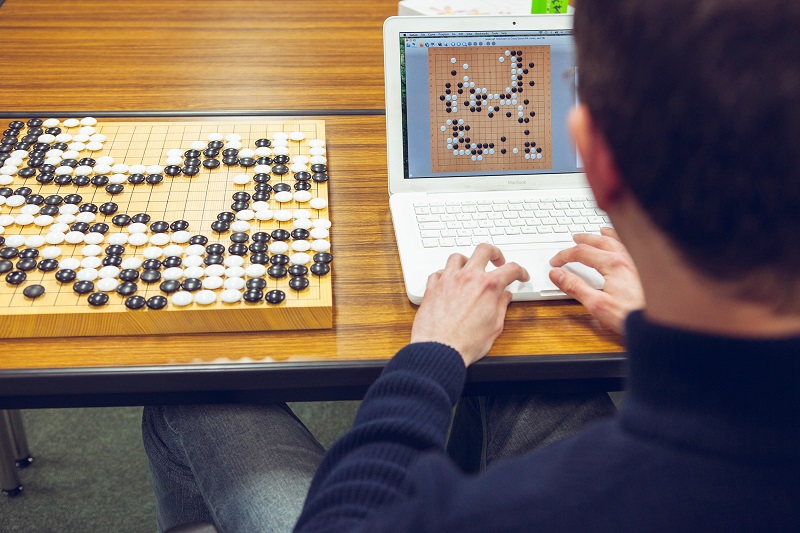
In the eastern part of the world, notably in China, Japan and South Korea, Go is extremely popular and many celebrities indulge in it. The game developers showed interest for long in the complexity of this game. However, the rules are simple – the main objective is to secure the maximum territories by placing and capturing black and white stones on a 19×19 grid.

Also read: Shadowing a Data Architect for a Day!

Chess is less complicated than Go; in the latter, the chances of recognising wins and losses is relatively tougher, as stones possess equal values, and ensures understated impacts throughout the board. To play Go, AlphaGo program implemented deep learning in neural networks – a brain-stimulated program. The connections formed here runs in-between layers of simulated neurons, further strengthened by examples and experiences. Firstly, it analysed 30 million positions from expert games, while gaining abstract information about the state of play from the board data, just like other programmes that classify images from pixels. After all this, finally it played against itself over 50 computers to improve its performance, with each iteration and this came to be known as reinforcement learning.

Go-02 (1)

The round of applause

“AlphaGo plays in a human way”, says Fan – DeepMind’s program AlphaGo beat Fan Hui, the European Go champion. He further added, “If no one told me, maybe I would think the player was a little strange, but a very strong player, a real person.” “The program seems to have developed a conservative (rather than aggressive) style”, adds Toby Manning, a veteran Go player and a referee.

You can now get a superior quality Data Science Certification from the experts in Delhi and Gurgaon. Tune into DexLab Analytics for regular updates on business analytics certification.


Interested in a career in Data Analyst?

To learn more about Data Analyst with Advanced excel course – Enrol Now.
To learn more about Data Analyst with R Course – Enrol Now.
To learn more about Big Data Course – Enrol Now.

To learn more about Machine Learning Using Python and Spark – Enrol Now.
To learn more about Data Analyst with SAS Course – Enrol Now.
To learn more about Data Analyst with Apache Spark Course – Enrol Now.
To learn more about Data Analyst with Market Risk Analytics and Modelling Course – Enrol Now.

Drawing a Bigger Picture: FAQs about Data Analytics

Drawing a Bigger Picture: FAQs about Data Analytics

When the whole world is going crazy about business analytics, you might be sitting in a corner and wondering what does it all mean? With so many explanations, notions run a gamut of options.

It’s TIME to be acquainted with all the imperceptible jargons of data science; let’s get things moving with these elementary FAQs.

What is data analytics?

Data analytics is all about understanding the data and implementing the derived knowledge to direct actions. It is a technical way to transform raw data into meaningful information, which makes integral decision-making easier and effective. To perform data analytics, a handful number of statistical tools and software is used and et voila, you are right on your way to success!

How will analytics help businesses grow?

The rippling effects of data analytics are evident, from the moment you introduce it in your business network. And stop rattling! The effects are largely on the positive side, letting your business unravel opportunities, which it ignored before owing to lack of accurate analytical lens. By parsing latest trends, conventions and relationships within data, analytics help predict the future tendencies of the market.

Moreover, it throws light on these following questions:

  • What is going on and what will happen next?
  • Why is it happening?
  • What strategy would be the best to implement?

Also read: Tigers will be safe in the hands of Big Data Analytics

How do analytics projects look like?

A conventional analytics strategy is segregated into the following 4 steps:

Research – Analysts need to identify and get through the heart of the matter to help business address issues that it is facing now or will encounter in the future.

Plan – What type of data is used? What are the sources from where the data is to be secured? How the data is prepared for implementation? What are the methods used to analyse data? Professional analysts will assess the above-mentioned questions and find relevant solutions.

Execute – This is an important step, where analysts explores and analyses data from different perspectives.

Evaluate – In this stage, analysts evaluate the strategies and execute them.

How predictive modelling is implemented through business domains?

In business analytics, there are chiefly two models, descriptive and predictive. Descriptive models explain what has already happened and what is happening now, while Predictive models decipher what would happen along with stating the underlying reason.

Also read: Data Analytics for the Big Screen

One can now solve issues related to marketing, finance, human resource, operations and any other business operations without a hitch with predictive analytics modelling. By integrating past with present data, this strategy aims to anticipate the future before it arrives.

When should I deploy analytics in business?

An Intrinsic Revelation – Analytics is not a one-time event; it is a continuous process once undertaken. No one can say when will be the right time to introduce data analytics in your business. However, most of the businesses resort to analytics in their not-up-par days, when they face problems and lags behind in devising any possible solution.

5

So, now that you understand the data analytics sphere and the significance attached, take up business analytics training in Delhi. From a career perspective, the field of data science is burgeoning. DexLab Analytics is a premier data science training institute, headquartered in Gurgaon. Check out our services and get one for yourself!


Interested in a career in Data Analyst?

To learn more about Data Analyst with Advanced excel course – Enrol Now.
To learn more about Data Analyst with R Course – Enrol Now.
To learn more about Big Data Course – Enrol Now.

To learn more about Machine Learning Using Python and Spark – Enrol Now.
To learn more about Data Analyst with SAS Course – Enrol Now.
To learn more about Data Analyst with Apache Spark Course – Enrol Now.
To learn more about Data Analyst with Market Risk Analytics and Modelling Course – Enrol Now.

Top Databases of 2017 to Watch Out For

Data processing is the most talked about topic of this year. From the figure below, you can comprehend that NoSQL and SQL databases are the ones most preferred by the respondents. 

 
Top Databases of 2017to Watch Out For
 

By putting together the percentage of respondents who found them fetching and who called them ‘extremely engaging’, we can conclude who the runner-up is. Here, NoSQL databases secure the second rank with 74.8%.

Continue reading “Top Databases of 2017 to Watch Out For”

Sherlock Holmes Has Always Been a Data Analyst. Here’s Why

The job of a data analyst or scientist revolves around gathering a bunch of disorganized data, and then using them to build a case through deduction and logic. Finally, following that you will reach a conclusion after analysis.

Sherlock Holmes Has Always Been a Data Analyst. Here's Why

Below quote from Sherlock Holmes is relevant –

“When you have eliminated the impossible whatever remains, no matter how Improbable it is must be the truth.”​

tumblr_mdorpe1mnr1qf5zmno1_500

He always started each case by focusing on the problem.

The problem would sometimes arrive in the form of a letter, sometimes as an item in the newspaper, but most often, it would announce itself by a knock at the door. The client would then present the mystery to Holmes and he would probe the client for salient information. Holmes never relied on guesswork or on assumptions. For Holmes, each new case was unique, and what mattered were reliable and verifiable facts about the case. These gave the investigation an initial focus and direction.

Deduction, Reasoning & Analytics

It is a capital mistake to theorize before one has data. Insensibly one begins to twist facts to suit theories, instead of theories to suit facts.”

Similarly a data analyst is expected not to assume or formulate theories, which can make the reasoning biased. In his stories, Sherlock Holmes demonstrates his keen powers of observation and deduction from data in front of him. He can decipher how the light enters in Watson’s bathroom based on how his beard is shaved; he attests one person has lived in China from one of his tattoos; he discovers previous financial situation of a man who he had never seen before just looking to the hat the man had just used.

1

A data scientist has powerful computational and statistics tools that help him finding patterns amid so much data.


In the end, a data analyst’s introduction can be similar to what Sherlock said:

My name is Sherlock Holmes. It is my business to know what other people do not

know.

Team Cosmos

You can learn more about Data analysis by taking up Data analyst certification courses. DexLab Analytics also offers Business analyst training courses.


Interested in a career in Data Analyst?

To learn more about Machine Learning Using Python and Spark – click here.
To learn more about Data Analyst with Advanced excel course – click here.
To learn more about Data Analyst with SAS Course – click here.
To learn more about Data Analyst with R Course – click here.
To learn more about Big Data Course – click here.

Shadowing a Data Architect for a Day!

Shadowing a Data Architect for a Day!

A data architect is a noteworthy role in the present analytics industry. One can naturally evolve from a data analyst or a database designer to a data architect after gathering sufficient experience in the field. The prominence of this role showcases the emergence of the online websites and other internet avenues which require the integration of data from several unrelated data sources.

These data sources can be anything from:

  • External sources, like market feeds (for e.g. Bloomberg) or other News Agencies (like, Reuters)
  • Or they could be internal sources like exiting systems that collect data, for instance HR operations that gather employee data

Here is a depiction of a day in the life of a successful data architect:

Data analyst certification from a reputable analytics-training institute can help to speed up your process of evolution from being a data analyst to becoming a successful data architect!


Shadowing a Data Architect for a Day! from Infographics


Interested in a career in Data Analyst?

To learn more about Data Analyst with Advanced excel course – Enrol Now.
To learn more about Data Analyst with R Course – Enrol Now.
To learn more about Big Data Course – Enrol Now.

To learn more about Machine Learning Using Python and Spark – Enrol Now.
To learn more about Data Analyst with SAS Course – Enrol Now.
To learn more about Data Analyst with Apache Spark Course – Enrol Now.
To learn more about Data Analyst with Market Risk Analytics and Modelling Course – Enrol Now.

Harnessing Big Data for Water Management

World Water Day: Save Water with Big Data

Appalling forces are re-establishing the relationship between humans and water.

In the past, communities developed slowly, while the weather remained constant. Water sources never depleted at tumultuous rates as it has today. Water is no longer a dependable resource. That’s why many countries and cities are embracing smart technologies to manage water efficiently and preserve it for the coming generations.

As we observe the United Nations World Water Day on Wednesday, 22nd March, it is apt to assess the development being made in conserving this diminishing resource.

World-Water-Day-Save-Water-Save-Water-Save-Nature

 Today, the Internet of Things (IoT) – a blooming worldwide network of devices and appliances linked to the internet – has materialized as a propitious solution to save water and protect clean drinking water, especially in cities.  

To begin our discussion, Netherlands is on its way to develop a pioneering program to address the relevant problems of increasing sea levels, surging number of droughts and the effect of extreme weather changes on its trains, bus networks and roadways, and the efficiency with which the entire nation tackles situations like this. The ambitious project, Digital Delta draws in local and regional water jurisdictions, top-notch scientists and proliferating businesses to implement Big Data technology for upgrading the systems of its €7 billion water management, while restricting the costs of preserving water by 15%.

Prophecies about Urban Centres
data_flow

Plummeting freshwater resources: a serious challenge faced by the global population is now at its apex. An overwhelming 89 percent of the world population thrives on enhanced water supply systems, which results in a loss of more than 32 billion cubic meters of fresh water, through physical leakage. Thereby, more than 50 percent of world population will be vulnerable in water-stressed regions by 2025. And by 2040, the figures will further push the energy demand by 56%, making US the second highest energy consumer across the globe.

Saving Water Globally

In the meantime, most of the world cities should re-invent and re-structure their assets to pull together advanced functions encompassing different complex systems and to associate with new powerful allies. Urbanization comes with its own costs. Day by day, these networks are growing more complicated and even more expensive. By delving deeper into the interconnections of systems, the societies will be in a better position to grasp how to run them more efficiently.

Water has never grabbed eyeballs, as it has today. Many countries are not at all prepared to manage such burgeoning complexities of water management. Besides, water management authorities are constantly under pressure to harness their power for flood protection and drinking water standards.

Reality Check: Water demand is set to rise by 30% by 2030. Ever increasing population and swelling urbanization are the reasons behind such calamitous figures.

Smart City Technology – The Key to Urban Sustainability

AAEAAQAAAAAAAAgTAAAAJDllNmM3YjJmLWI3NTEtNDkxNS05MWYxLTYxMTM3OTUyZGE2OQ

New Jersey Institute of Technology (NJIT) revealed that by 2025 smart city technologies would multiply to an industry estimating $27.5 billion. Moreover, nearly 88 smart cities will develop by the end of 2025. Smart cities whirl around the concept of using improved, interconnecting technologies to make environment safe, lives easier and urban living cost-effective and more efficient.

Societies are enduring new weather extremes. It is the high time to use big data and analytical science to cure the growing complexities in managing our water systems. Smart technology is the only viable option that can take future generations towards a sustainable future.

Seeking data science courses online? Visit us at DexLab Analytics. We offer a wide array of highly interactive online courses in data science.


Interested in a career in Data Analyst?

To learn more about Data Analyst with Advanced excel course – Enrol Now.
To learn more about Data Analyst with R Course – Enrol Now.
To learn more about Big Data Course – Enrol Now.

To learn more about Machine Learning Using Python and Spark – Enrol Now.
To learn more about Data Analyst with SAS Course – Enrol Now.
To learn more about Data Analyst with Apache Spark Course – Enrol Now.
To learn more about Data Analyst with Market Risk Analytics and Modelling Course – Enrol Now.

Knock! Knock! It’s Time to Change Your Bad Data Habits

Knock! Knock! It’s Time to Change Your Bad Data Habits

Do you follow your instincts instead of data and insights?

Do you prefer storing data in different databases, in separate formats with varying values?

Habits are subject to change. Though it may take some time, but eventually it evolves. Good and bad habits make a person. Good habits don’t demand attention, but bad habits often need to be looked into.

If you suffer from bad data habits, then you must make sure you deal with it. It has to be a thing from your past rather than a dominating present. After all, data is incredibly important for business organizations to proliferate and generate decent revenues.


As per Experian’s Data Quality Report, 83% of companies consider their revenue suffers from inaccurate and insufficient customer data. It happens because of time and money wastage on insubstantial resources, which leads to a humungous loss of productivity and profit.

Bad Data Habits: The Ugly Truth

Data is the essence of business. From email delivery to customer feedback to profit generation, the impact of data trickles from strata to strata.

1280-blog-bad-data2

Sadly, many companies fail to fathom the significance of data and continue storing data on multiple systems, instead of a single location, in various formats without actually knowing ways to handle it. This eventually results into huge data pile-ups, where the entire data silo becomes difficult to manage.

However, if you have the right tools and a zeal to ensure data quality, you can confidently manage your data, eradicate duplications and fix errors before they inflict damage to your fundamentals. Besides, prudent strategies, time-to-time reviews and absolute determination are necessary; read this article to gain more insights about how to work on your bad data habits.

Let awareness do the work

Detailed information about customers is crucial for better assistance and quicker efficiency. So, you should always tell your customer support team to derive more information about their customers in order to serve better.

Understand your data needs

What data is important for your business? Once you know that, you will be able to apprehend your customer’s needs and expectations more effectively. Moreover, be sure that the data is accessible to all those who really needs it, otherwise it won’t be fruitful.

Introduce Standardised Data Quality Policies

images

For high quality data, make sure you introduce standard data policies and procedures. Also, ensure that the people working in your organization are acquainted with the ways of recording and storing it.

Initiate Regular Reviews

Data degradation is common. Human beings commit mistakes. Hence, it is important to regularly review and cleanse data in order to avoid future discrepancies.

Integration and Installation of the Right Tools

boxbarimage5

Integrate your network to ensure the data is stored on one server, but accessible from multiple locations. This will help you get an entire picture of your company’s business performance over varied mediums. Install any of the improved Data Cleaning Software to make sure your data is free of duplicates and perfectly formatted right from the start.


To brush up your analytics skills, get enrolled in a Data analyst course. Visit DexLab Analytics.


Interested in a career in Data Analyst?

To learn more about Machine Learning Using Python and Spark – click here.
To learn more about Data Analyst with Advanced excel course – click here.
To learn more about Data Analyst with SAS Course – click here.
To learn more about Data Analyst with R Course – click here.
To learn more about Big Data Course – click here.

Concocting Data with GIS

Concocting Data with GIS

In supreme and sophisticated geospatial realm, data have been predominant. Or, should I say it is the matured fosterling of Geographic Information Systems (GIS). Choose, whatever suits you; subject to whom you work for or what you need to work on. The meat and potatoes? To excel on location analytics, concentrate only on the best most current data.

big-data-visualization-e1456688631506-1024x671

In today’s world, data is valuable. It is vital and veritable. It is indispensable in Geographic Information Systems (GIS).

To second that, today’s tech-efficient society is anchored on location-based data, than ever, especially with the rise in Twitter, Google, Facebook and other social media apps, which collects and stores data from their highly-valued users to sell them off to money-grubbing advertisers.  Though secretly. On the other hand, cell phones go a step ahead in broadcasting your current location data 24/7. Otherwise, how would your friends know that you are safe when a severe earthquake rattled your neighbouring city! (Thanks to location settings)

Feisty Predicaments

sap_ipad_google_maps

However, the real challenge lies in data identification and consumption. Countless number of users gets baffled when it comes to finding data, and if found, how to consume it to set off their business determinations. To solve this, many imminent think tanks of tech industry came out with direct and decisive solutions. Some of them were loaded with an abundance of data, i.e. digestible and disintegrated. By disintegration, they meant that the data was categorized into: points of interest, roads, boundaries and demographics, for easy comprehensibility. Furthermore, industry data bundles concerning telecommunications, retail and insurance fields were added to make the coverage global and profitable. To top it off, quality content and sprawling file formats boosted the results and mechanisms, both.

Conflux of GIS and BI

Location technology – Does this ring a bell? Yes? Then you would be familiar with GIS but others, particularly new Business Intelligence users and consumers must have just started taking baby steps on basic mapping. For BI, maps are the backdrop against which business analysts project their business data, stats and analytical information. Analysing the data to understand the insights of consumers is crucial, directly affecting the business decisions and revenues thereby. For example, heat maps, used to see the concentration of installations, customers and IoT devices provides an unparalleled accurateness of spatial relationships, which is impossible to obtain from the spreadsheets.


Seeking data analytics certification courses to boost your business growth? Go through our comprehensive Online Courses in data science at DexLab Analytics.

One of the integral location analytics issues is to help in identifying the high-risk zones at the time of natural disasters, like tornadoes, earthquakes, floods, hurricanes or mudslides. For example, in the US, the East Coast is vulnerable to a lot of hurricanes and floods, whereas earthquakes and mudslides snap the West Coast time to time. Assessment of these location problems is intrinsically important for mortgage underwriters, insurance agents and public safety departments. And best data along with effective geo-coding is the solution to all the inconveniences. 

Discover easy Data Science Courses Online by logging in to DexLab Analytics. To know more on Business Analytics Online Certification, contact us.


Interested in a career in Data Analyst?

To learn more about Machine Learning Using Python and Spark – click here.
To learn more about Data Analyst with Advanced excel course – click here.
To learn more about Data Analyst with SAS Course – click here.
To learn more about Data Analyst with R Course – click here.
To learn more about Big Data Course – click here.

Data Analytics for the Big Screen

Can the film industry leverage more on data analytics?

Film making as an industry is as dependent on good marketing as it is on good content.

Data Analytics for the Big Screen

And it is here that data analytics comes to the picture, for not only does it govern marketing strategies of a Studio but in future it might govern the creative half as well.

For a conventional Hollywood blockbuster, an average of $70 Million are spent within 10-12 weeks and data analytics might direct us as to how much cash needs to be spent and where. Nowadays companies such as IBM are experimenting with Deep Sentiment Analysis, which tries to gauge the market sentiment by listening to the constant stream of content being posted by the users in a given area. The data comes from all sorts of sources, both structured and unstructured, which then needs to be cleaned before gaining any actionable insights from it. Nowadays, companies are working towards developing Market Optimisation Models where they can use historical data to create models, which are then fed current data in order to guide marketing budget allocation decisions. Another way studios are using data analytics is to predict market reaction in USA and Europe by analysing moviegoer’s reaction to the initial run of the movie (usually in smaller markets of Asia). They then proceed to rebrand/improve its offering to make it more ‘commercial’ for a given region.


But does this seemingly endless data and ever improving predictive model point towards a future, where Big Data might tell writers what to write, directors how to direct and actors how to act? If the answer is in affirmative, then are we diluting cinema as an artistic medium? Studios, such as Netflix have now extracted about 70,000 unique characteristics from its movie collection, and now they are analysing how the presence/absence of a characteristic has an impact on the movie revenue/rating/viewing. It then uses these findings to develop and fine-tune the shows it will produce in future. This increasingly ‘scientific’ manner of developing movies is taking over at other studios as well, along with experts fearing that this practice might lead to the industry losing its experimental and creative edge.

With proved benefits, including increased revenue and minimal risk, it is imperative for studios to invest into Data Analytics. It has become imperative to design their marketing strategy using this mine of user data to make their offerings economic, popular, efficient and successful.

Seeking data analytics certification courses to boost your business growth? Go through our comprehensive Online Courses in data science at DexLab Analytics.


Interested in a career in Data Analyst?

To learn more about Machine Learning Using Python and Spark – click here.
To learn more about Data Analyst with Advanced excel course – click here.
To learn more about Data Analyst with SAS Course – click here.
To learn more about Data Analyst with R Course – click here.
To learn more about Big Data Course – click here.

Call us to know more