Data and Risk Analytics Archives - Page 2 of 2 - DexLab Analytics | Big Data Hadoop SAS R Analytics Predictive Modeling & Excel VBA

How Data Analytics Influences Holiday Retail Experience [Video]

Thanksgiving was right here! Half of the globe witnessed some crazy shopping kicking off the entire holiday season, and retailers had a whale of a time, offering luscious discounts and consumer gifts at half the prices.

 
How Data Analytics Influences Holiday Retail Experience
 

Before the weekend Thanksgiving sale, 69% of Americans, close to 164 million people across the US were estimated to shop– and they had planned to shell out up to 3.4% more money as compared to last year’s Black Friday and Cyber Monday sale. The forecasts came from National Retail Federation’s annual survey, headed by Prosper Insights & Analytics.

Continue reading “How Data Analytics Influences Holiday Retail Experience [Video]”

Explaining the Everlasting Bond between Data and Risk Analytics

Explaining the Everlasting Bond between Data and Risk Analytics


The use of data analytics is robustly expanding in the financial sector – and the risk landscape is changing pretty fast. Every day a new innovation in the field of risk analytics is making its way, and sometimes some new risks and its respective strategies are popping up just around the corner. The rise of big data, artificial intelligence and advanced analytics helps companies gain valuable cognizance from data. Computing power, the Internet of Things, drones and machine learning are some of the latest new-age tools to assist companies in taking better decisions, hence increase future profitability. Alike, risk managers implement market risk analytics and big data to manage their day-to-day work activities, while identifying, ascertaining and mitigating risks.

Continue reading “Explaining the Everlasting Bond between Data and Risk Analytics”

Understanding the Difference Between Factor and Cluster Analysis

Understanding the Difference Between Factor and Cluster Analysis

Cluster analysis and factor analysis are two different statistical methods in data analytics which are used heavily in analytical methods of subjects like natural sciences and behavioural sciences. The names of these analytical methods are so because both these methods allow the users to divide the data into either clusters or into factors.

Most newly established data analysts have this common confusion that both these methods are almost similar. But while these two methods may look similar on the surface but they differ in several ways including their applications and objectives.

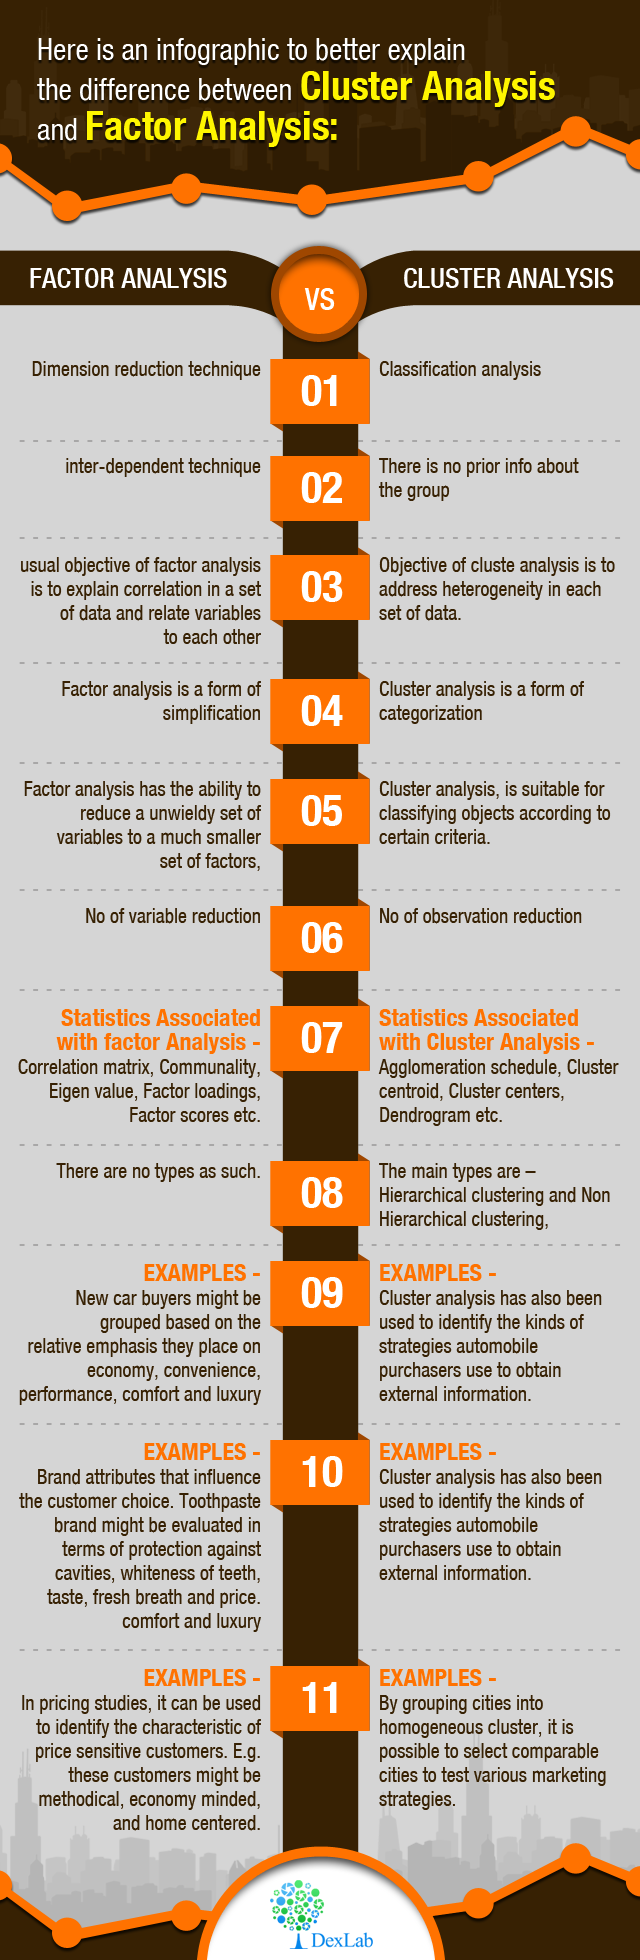
Difference in objectives between cluster analysis and factor analysis:

One key difference between cluster analysis and factor analysis is the fact that they have distinguished objectives. For factor analysis the usual objective is to explain the correlation with a data set and understand how the variables relate to each other. But on the other hand the objective of cluster analysis is to address the heterogeneity in the individual data sets.

Put in simpler words the spirit of cluster analysis is to help in categorization but that of factor analysis are a form of simplification.

Data Science Machine Learning Certification

Difference is solutions:

This is not an easy section for drawing a line of separation in between cluster and factor analysis. That is because the results or solutions obtainable from both these analysis is subjective to their application. But still one could say that with factor analysis provides in a way the ‘best’ solutions to the researcher. This best solution is in the sense that the researcher can optimize a certain aspect of the solution this is known as orthogonality which offers ease of interpretation for the analysts.

But in case of cluster analysis this is not the case. The reasons behind that being all algorithms which can yield the best solutions for cluster analysis are usually computationally incompetent. Thus, researchers cannot trust this method of cluster analysis as it does not guarantee an optimal solution.

Difference in applications:

Cluster analysis and factor analysis differ in how they are applied to data, especially when it comes to applying them to real data. This is because factor analysis can reduce the unwieldy variables sets and boil them down to a smaller set of factors. This makes it suitable for simplifying otherwise complex models of analysis. Moreover, factor analysis also comes with a sort of confirmatory use researchers can use this method to develop a set of hypotheses based on how the variables in the data set are related.  After that the researcher can run a factor analysis to further confirm these hypotheses.

But cluster analysis on the other hand is suitable only for categorizing objects as per certain predetermined criteria. In cluster analysis a researcher can measure selected aspects of say a group of newly discovered plants and then place these plants into categories of species grouped by employing cluster analysis.

Here is an infographic to better explain the difference between cluster analysis and factor analysis: 


Interested in a career in Data Analyst?

To learn more about Data Analyst with Advanced excel course – Enrol Now.
To learn more about Data Analyst with R Course – Enrol Now.
To learn more about Big Data Course – Enrol Now.

To learn more about Machine Learning Using Python and Spark – Enrol Now.
To learn more about Data Analyst with SAS Course – Enrol Now.
To learn more about Data Analyst with Apache Spark Course – Enrol Now.
To learn more about Data Analyst with Market Risk Analytics and Modelling Course – Enrol Now.

Are You a Student of Statistics? – You must know these 3 things

Are you a student of statistics?

We a premiere statistical and data analysis training institute offering courses on Big Data Hadoop, Business intelligence and Ai. We asked our faculty to tell us the three most important things that every student of elementary statistics should know.

So, let us get on with it:

  1. The notion that statistics is about numbers, is in the context only: statistics involves a rich treasure trove of numeric and graphical representation of displaying data to quantify them also it is very important to be capable of generating graphs along with numbers. But that is not the half part of statistics and the main interesting aspect is related to making the big leap from numbers and graphs to the realistic worldly interpretations. Uncannily statistics also poses to be a fascinating philosophical tension raising the question and healthy skepticism about we believe in and what we do not.
  2. The analysis part is not the most crucial part of a statistical study, the most important part lies with the when, where and how of gathering the data. We must not forget when we enter each number or data, calculate and plot the strategies we build on our understanding, but many a times at the time of interpretation that each every graph, data or number is a product of a fallible machine, be it organic or mechanical. If we are able to take proper care at the stage of sampling and observation we will be able to obtain great dividends at the final stage of interpretation and analysis of all our statistical efforts.
  3. All statistical functions off all kinds of mathematical sciences are based on a two-way communication system. This communication system should be between the statistician and non-statistician end. The main aim of statistical analysis is to put forward important social, public and scientific questions. A good statistician knows how to communicate with the public especially with those who are by and large not statisticians. Also the public here plays an important role and must possess simple idea of statistical conclusions to grasp what the statisticians have to say to them. This is an important criterion to be incorporated in the K-12 and college curriculum for elementary statistical students.

Data Science Machine Learning Certification

If you agree with our views and would like to discuss further on statistics and its application on data analysis then feel free drop by DexLab Analytics and stay updated on the latest trends in data management and mining.


Interested in a career in Data Analyst?

To learn more about Data Analyst with Advanced excel course – Enrol Now.
To learn more about Data Analyst with R Course – Enrol Now.
To learn more about Big Data Course – Enrol Now.

To learn more about Machine Learning Using Python and Spark – Enrol Now.
To learn more about Data Analyst with SAS Course – Enrol Now.
To learn more about Data Analyst with Apache Spark Course – Enrol Now.
To learn more about Data Analyst with Market Risk Analytics and Modelling Course – Enrol Now.

Interesting Statistics of Employment: 5 Figures

Interesting Statistics of Employment: 5 Figures

It is a common sight to see the old and young talking about the job market that is going through a slump, regardless of the time or the economic conditions of the country; this picture usually is accompanied with some “cutting chai” at tea stalls on busy streets or cool cafes at the malls with the slurp of espresso with a tiny straw where the average upper-middle class youth talk about their first-world dreams while breathing progressive third-world air.

But is that really always the case? Data management or statistical analysis as we have established several times before, is sending the job market into hyper-drive, attracting millions of MNCs into the Indian soil and populating the job search portals with millions of opportunities in data.  But dare we only make statements, we are statisticians and we know that numbers do speak louder than simple statements.

So, in keeping with our love for figures and facts backed by data, DexLab Analytics has compiled a list of interesting statistics about the job market and the process of hiring.

#1 Each and every major corporate job position attracts a minimum of 250 applications!

Out of all these applications only 4 to 6 resumes get shortlisted and are called for interviews. Out of these 4 to 6 people only 1 lucky candidate is selected.

#2 Every job seeker takes into account 5 factors before accepting the position at a firm.

They are –

  • The company culture, values and overall work environment
  • Distance, ease of commute, location
  • Prospects of maintaining work/life balance
  • Growth prospects in career and
  • Pay package and compensation.

#3 Almost 94 percent of sales personnel revealed that base salary is the most important determining factor in the compensation package for them.

But 62 percent of sales personnel say that commission is the most important element.

#4 Out of 3 employees at least 2 say that most employers do not do or do not know how to use social media platforms for promoting job openings.

And 3 out of 4 employees also believe that most companies and employers do not know how to promote their brand on social media networks as well.

#5 Social media platforms are used to search for jobs by 79 percent of jobseekers.

This figure rises to 86 percent for younger job seekers who are in their initial 10 years of job search.

To learn more about statistical analysis and for Data analyst certification in Gurgaon drop by our website at DexLab Analytics.


Interested in a career in Data Analyst?

To learn more about Data Analyst with Advanced excel course – Enrol Now.
To learn more about Data Analyst with R Course – Enrol Now.
To learn more about Big Data Course – Enrol Now.

To learn more about Machine Learning Using Python and Spark – Enrol Now.
To learn more about Data Analyst with SAS Course – Enrol Now.
To learn more about Data Analyst with Apache Spark Course – Enrol Now.
To learn more about Data Analyst with Market Risk Analytics and Modelling Course – Enrol Now.

Call us to know more