data analytics Archives - Page 6 of 12 - DexLab Analytics | Big Data Hadoop SAS R Analytics Predictive Modeling & Excel VBA

Architecture Trade-offs Pays Well for Enterprise Analytics

Today, owing to an explosion of technology options, determining which analytics stack to adopt takes into account a streak of architectural trade-offs. Over the years, with our experience and expertise we have learnt the most crucial aspect of creating sound analytics systems and pleasing customers with improved digital solutions – is the location where data is to be stored and processed, and the different types of databases to use so that only the right people gain access to it.

Architecture Trade-offs Pays Well for Enterprise Analytics

Opt for a comprehensive data analyst course Delhi NCR from DexLab Analytics.

Continue reading “Architecture Trade-offs Pays Well for Enterprise Analytics”

Researchers Peer into the Hood of Computational Linguistics

Researchers Peer into the Hood of Computational Linguistics


To start, give a look at these two sentences:

“This house is in a detestable location.”

“This detestable house is in this location.”


Well, these two sentences have virtually similar words, but owing to their structure, they exude entirely two different meanings. Understanding the true meaning of the sentences just by having a look at the words was something only reserved for the human intelligence, until now. Breakthroughs in Natural Language Processing (NLP), also known as computational linguistics have blazed a trail in this domain, which was once dominated by humans.

Continue reading “Researchers Peer into the Hood of Computational Linguistics”

How Data Analytics Influences Holiday Retail Experience [Video]

Thanksgiving was right here! Half of the globe witnessed some crazy shopping kicking off the entire holiday season, and retailers had a whale of a time, offering luscious discounts and consumer gifts at half the prices.

 
How Data Analytics Influences Holiday Retail Experience
 

Before the weekend Thanksgiving sale, 69% of Americans, close to 164 million people across the US were estimated to shop– and they had planned to shell out up to 3.4% more money as compared to last year’s Black Friday and Cyber Monday sale. The forecasts came from National Retail Federation’s annual survey, headed by Prosper Insights & Analytics.

Continue reading “How Data Analytics Influences Holiday Retail Experience [Video]”

Master These Piping Hot Data Analytics Techniques and Stay Ahead of the Curve [Video]

Big Data, Business Intelligence, Data Science – the digital revolution is here, and it’s evolving steadfastly.

 
Master These Piping Hot Data Analytics Techniques and Stay Ahead of the Curve [Video]
 

Soon, data analytics is becoming the life-source of IT. The range of technologies is varied, and the way data is expanding, we are fast moving towards a juncture where analysis of vast volumes of data will be done in a jiffy.

Continue reading “Master These Piping Hot Data Analytics Techniques and Stay Ahead of the Curve [Video]”

Data to Fill in the Gaps: Using Data Analytics to Seek Retail Advantage

Retailers need to know their customers well – who they are, what stuffs they like to buy, how they would pay and what they think about the product or service. The best part is that there’s an ocean of data now available to fill in the gaps. Every time a customer visits the store, a long trail of customer data churns out for the retailers to explore.

 
Data to Fill in the Gaps: Using Data Analytics to Seek Retail Advantage
 

With the help of this data, the retailers improve sales figures, customer service and interaction and their product offerings. Leveraging data is crucial. According to Gartner, retailers seek advanced analytic capabilities to shine bright in this age of digitized market solutions.

Continue reading “Data to Fill in the Gaps: Using Data Analytics to Seek Retail Advantage”

Data Science and Machine Learning: In What State They Are To Be Found?

Keen to have a sweeping view of data science and machine learning as a whole? 

Want to crack who is playing tricks with data and what’s happening in and around the budding field of machine learning across industries?

Looking for ways to know how aspiring, young data scientists are breaking into the IT field to invent something new each day?

Hold your breath, tight. The below report showcases few of our intrinsic findings – which we derived from Kaggle’s industry-wide survey. Also, interactive visualizations are on the offer.

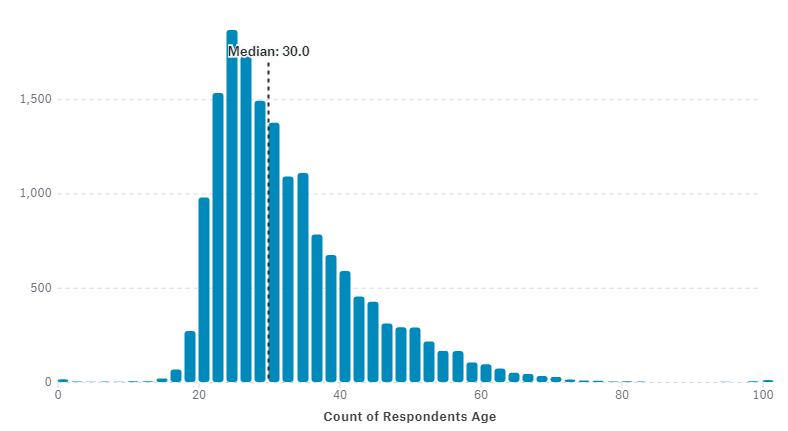
  1. On an average, data scientists fall under the age bar of 30 years old, but as a matter of fact, this age limit is subject to change. For example, the average age of data scientists from India tends to be 9 years younger than the average scientists from Australia.
  2. Python is the most commonly used language programs in India, but data scientists at large are relying on R now.
  3. Most of the data scientists are likely to possess a Master’s degree, however those who bags a salary of more than $150K mostly have a doctoral degree under their hood.

Who’s Using Data?

A lot of ways are there to nab who’s working with data, but in here we will fix our gaze on the demographic statistics and the background of people who are working in data science.

What is your age?

To kick start our discussion, according to the Kaggle survey, the average age of respondents was 30 years old subject to some variation. The respondents from India were on an average 9 years younger than those from Australia.

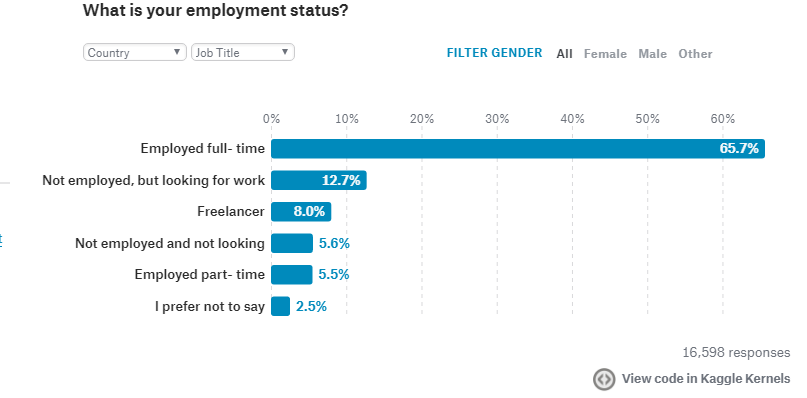
What is your employment situation?

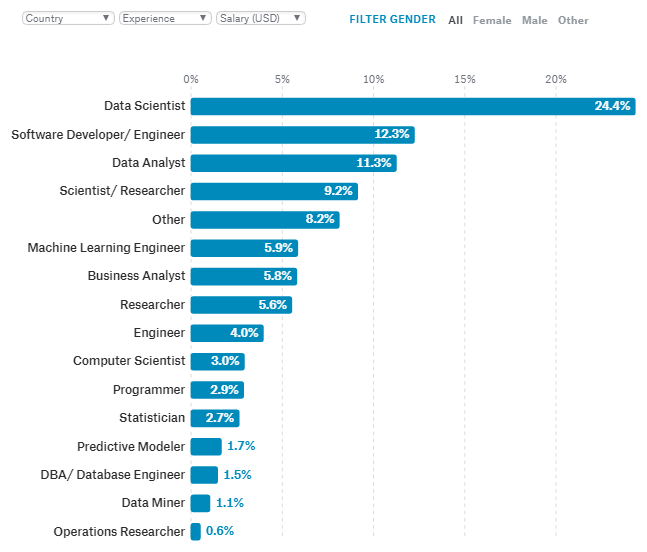
What kind of job title you bag?

Anyone who uses code for data analysis is termed as a data scientist. But how true is this? In the vast realm of data science, there are a series of job titles that can be pegged. For instance, in Iran and Malaysia, the job title of data scientist is not so popular, they like to call data scientists by the name Scientist or Researcher. So, keep a note of it.

How much is your full-time annual salary?

While “compensation and benefits” ranked a little lower than “opportunities for professional developments”, the best part remains it can still be considered a reasonable compensation.

Check out how much a standard machine learning engineer brings home to in the US

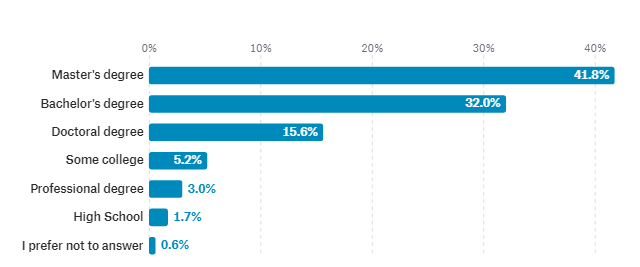
What should be the highest formal education?

So, what’s going on in your mind? Should you get your hands on the next formal degree? Normally, most of the data scientists have obtained a full-time master’s degree, even if they haven’t they are at least data analytics’ certified. But professionals who come under a higher salary slab are more likely to possess a doctoral degree.

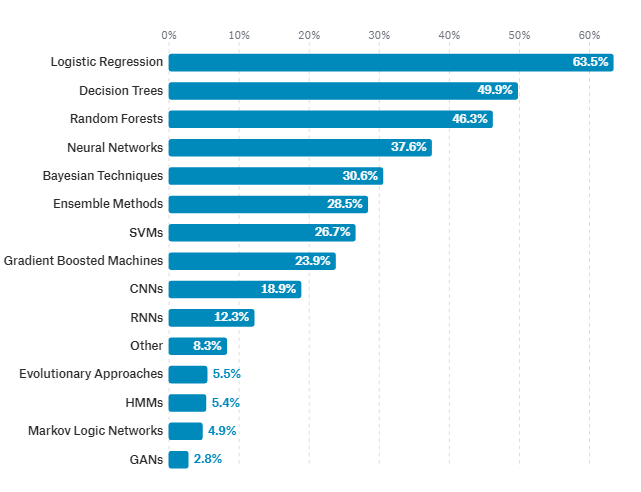
What are the most commonly used data science methods at work?

Largely, logistic regression is used in all the work areas except the domain of Military and Security, because in here Neural Networks are being implemented extensively.

Which tool is used at work?

Python was once the most used data analytics tool, but now it is replaced by R.

The original article can be viewed in Kaggle.

Kaggle: A Brief Note

Kaggle is an iconic platform for data scientists, allowing ample scope to connect, understand, discover and explore data. For years, Kaggle has been a diverse platform to drag in hundreds of data scientists and machine learning enthusiasts, and is still in the game.

For excellent data science certification in Gurgaon, look no further than DexLab Analytics. Opt for their intensive data science and machine learning certification and unlock a string of impressive career milestones.


Interested in a career in Data Analyst?

To learn more about Data Analyst with Advanced excel course – Enrol Now.
To learn more about Data Analyst with R Course – Enrol Now.
To learn more about Big Data Course – Enrol Now.

To learn more about Machine Learning Using Python and Spark – Enrol Now.
To learn more about Data Analyst with SAS Course – Enrol Now.
To learn more about Data Analyst with Apache Spark Course – Enrol Now.
To learn more about Data Analyst with Market Risk Analytics and Modelling Course – Enrol Now.

Embedded Analytics: How it’s Revolutionizing Businesses Today?

Embedded Analytics: How it’s Revolutionizing Businesses Today?


Analytics is the key to modern business growth. But, developing it as a highly interactive analytical interface is challenging enough to exhaust the time and resources both. As a result, many businesses are shifting their focus to Embedded Analytics (EA) for their operations, workflows and decision-making capabilities. This new breed of analytics, known as Embedded Analytics helps businesses leverage the power of data to process them in the most useful manner.

Continue reading “Embedded Analytics: How it’s Revolutionizing Businesses Today?”

Write ETL Jobs to Offload the Data Warehouse Using Apache Spark

Write ETL Jobs to Offload the Data Warehouse Using Apache Spark

The surge of Big Data is everywhere. The evolving trends in BI have taken the world in its stride and a lot of organizations are now taking the initiative of exploring how all this fits in.

Leverage data ecosystem to its full potential and invest in the right technology pieces – it’s important to think ahead so as to reap maximum benefits in IT in the long-run.

“By 2020, information will be used to reinvent, digitalize or eliminate 80% of business processes and products from a decade earlier.” – Gartner’s prediction put it so right!

The following architecture diagram entails a conceptual design – it helps you leverage the computing power of Hadoop ecosystem from your conventional BI/ Data warehousing handles coupled with real time analytics and data science (data warehouses are now called data lakes).
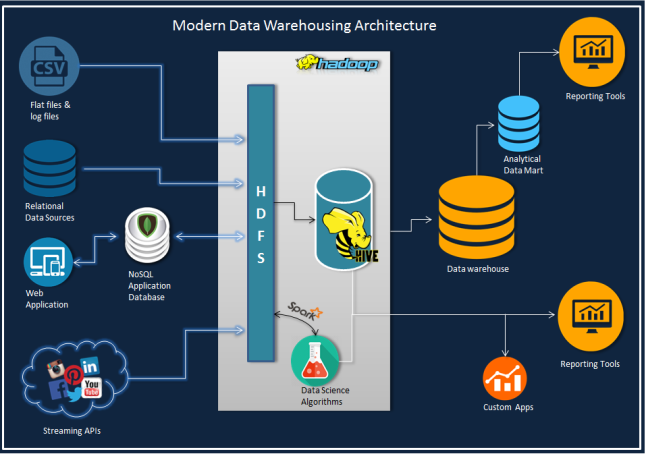
moderndwarchitecture

In this post, we will discuss how to write ETL jobs to offload data warehouse using PySpark API from the genre of Apache Spark. Spark with its lightning-fast speed in data processing complements Hadoop.

Now, as we are focusing on ETL job in this blog, let’s introduce you to a parent and a sub-dimension (type 2) table from MySQL database, which we will merge now to impose them on a single dimension table in Hive with progressive partitions.

Stay away from snow-flaking, while constructing a warehouse on hive. It will reduce useless joins as each join task generates a map task.

Just to raise your level of curiosity, the output on Spark deployment alone in this example job is 1M+rows/min.

The Employee table (300,024 rows) and a Salaries table (2,844,047 rows) are two sources – here employee’s salary records are kept in a type 2 fashion on ‘from_date’ and ‘to_date’ columns. The main target table is a functional Hive table with partitions, developed on year (‘to_date’) from Salaries table and Load date as current date. Constructing the table with such potent partition entails better organization of data and improves the queries from current employees, provided the to_date’ column has end date as ‘9999-01-01’ for all current records.

The rationale is simple: Join the two tables and add load_date and year columns, followed by potent partition insert into a hive table.

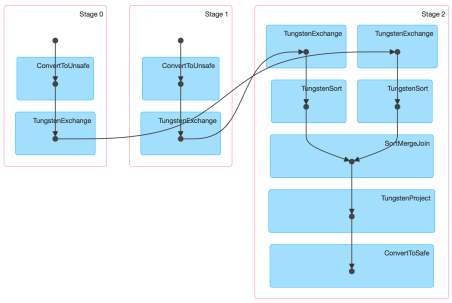
Check out how the DAG will look:
screen-shot-2015-09-28-at-1-44-32-pm

Next to version 1.4 Spark UI conjures up the physical execution of a job as Direct Acyclic Graph (the diagram above), similar to an ETL workflow. So, for this blog, we have constructed Spark 1.5 with Hive and Hadoop 2.6.0

Go through this code to complete your job easily: it is easily explained as well as we have provided the runtime parameters within the job, preferably they are parameterized.

Code: MySQL to Hive ETL Job

__author__ = 'udaysharma'
# File Name: mysql_to_hive_etl.py
from pyspark import SparkContext, SparkConf
from pyspark.sql import SQLContext, HiveContext
from pyspark.sql import functions as sqlfunc

# Define database connection parameters
MYSQL_DRIVER_PATH = "/usr/local/spark/python/lib/mysql-connector-java-5.1.36-bin.jar"
MYSQL_USERNAME = '<USER_NAME >'
MYSQL_PASSWORD = '********'
MYSQL_CONNECTION_URL = "jdbc:mysql://localhost:3306/employees?user=" + MYSQL_USERNAME+"&password="+MYSQL_PASSWORD 

# Define Spark configuration
conf = SparkConf()
conf.setMaster("spark://Box.local:7077")
conf.setAppName("MySQL_import")
conf.set("spark.executor.memory", "1g")

# Initialize a SparkContext and SQLContext
sc = SparkContext(conf=conf)
sql_ctx = SQLContext(sc)

# Initialize hive context
hive_ctx = HiveContext(sc)

# Source 1 Type: MYSQL
# Schema Name  : EMPLOYEE
# Table Name   : EMPLOYEES
# + --------------------------------------- +
# | COLUMN NAME| DATA TYPE    | CONSTRAINTS |
# + --------------------------------------- +
# | EMP_NO     | INT          | PRIMARY KEY |
# | BIRTH_DATE | DATE         |             |
# | FIRST_NAME | VARCHAR(14)  |             |
# | LAST_NAME  | VARCHAR(16)  |             |
# | GENDER     | ENUM('M'/'F')|             |
# | HIRE_DATE  | DATE         |             |
# + --------------------------------------- +
df_employees = sql_ctx.load(
    source="jdbc",
    path=MYSQL_DRIVER_PATH,
    driver='com.mysql.jdbc.Driver',
    url=MYSQL_CONNECTION_URL,
    dbtable="employees")

# Source 2 Type : MYSQL
# Schema Name   : EMPLOYEE
# Table Name    : SALARIES
# + -------------------------------- +
# | COLUMN NAME | TYPE | CONSTRAINTS |
# + -------------------------------- +
# | EMP_NO      | INT  | PRIMARY KEY |
# | SALARY      | INT  |             |
# | FROM_DATE   | DATE | PRIMARY KEY |
# | TO_DATE     | DATE |             |
# + -------------------------------- +
df_salaries = sql_ctx.load(
    source="jdbc",
    path=MYSQL_DRIVER_PATH,
    driver='com.mysql.jdbc.Driver',
    url=MYSQL_CONNECTION_URL,
    dbtable="salaries")

# Perform INNER JOIN on  the two data frames on EMP_NO column
# As of Spark 1.4 you don't have to worry about duplicate column on join result
df_emp_sal_join = df_employees.join(df_salaries, "emp_no").select("emp_no", "birth_date", "first_name",
                                                             "last_name", "gender", "hire_date",
                                                             "salary", "from_date", "to_date")

# Adding a column 'year' to the data frame for partitioning the hive table
df_add_year = df_emp_sal_join.withColumn('year', F.year(df_emp_sal_join.to_date))

# Adding a load date column to the data frame
df_final = df_add_year.withColumn('Load_date', F.current_date())

df_final.repartition(10)

# Registering data frame as a temp table for SparkSQL
hive_ctx.registerDataFrameAsTable(df_final, "EMP_TEMP")

# Target Type: APACHE HIVE
# Database   : EMPLOYEES
# Table Name : EMPLOYEE_DIM
# + ------------------------------- +
# | COlUMN NAME| TYPE   | PARTITION |
# + ------------------------------- +
# | EMP_NO     | INT    |           |
# | BIRTH_DATE | DATE   |           |
# | FIRST_NAME | STRING |           |
# | LAST_NAME  | STRING |           |
# | GENDER     | STRING |           |
# | HIRE_DATE  | DATE   |           |
# | SALARY     | INT    |           |
# | FROM_DATE  | DATE   |           |
# | TO_DATE    | DATE   |           |
# | YEAR       | INT    | PRIMARY   |
# | LOAD_DATE  | DATE   | SUB       |
# + ------------------------------- +
# Storage Format: ORC


# Inserting data into the Target table
hive_ctx.sql("INSERT OVERWRITE TABLE EMPLOYEES.EMPLOYEE_DIM PARTITION (year, Load_date) \
            SELECT EMP_NO, BIRTH_DATE, FIRST_NAME, LAST_NAME, GENDER, HIRE_DATE, \
            SALARY, FROM_DATE, TO_DATE, year, Load_date FROM EMP_TEMP")

As we have the necessary configuration mentioned in our code, we will simply call to run this job

spark-submit mysql_to_hive_etl.py

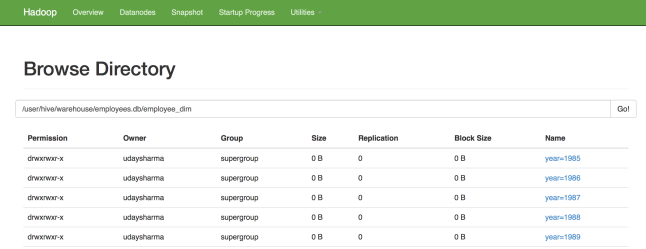
As soon as the job is run, our targeted table will consist 2844047 rows just as expected and this is how the partitions will appear:
screen-shot-2015-09-29-at-12-42-37-am

2

3

screen-shot-2015-09-29-at-12-46-55-am

The best part is that – the entire process gets over within 2-3 mins..

For more such interesting blogs and updates, follow us at DexLab Analytics. We are a premium Big Data Hadoop institute in Gurgaon catering to the needs of aspiring candidates. Opt for our comprehensive Hadoop certification in Delhi and crack such codes in a jiffy!


Interested in a career in Data Analyst?

To learn more about Data Analyst with Advanced excel course – Enrol Now.
To learn more about Data Analyst with R Course – Enrol Now.
To learn more about Big Data Course – Enrol Now.

To learn more about Machine Learning Using Python and Spark – Enrol Now.
To learn more about Data Analyst with SAS Course – Enrol Now.
To learn more about Data Analyst with Apache Spark Course – Enrol Now.
To learn more about Data Analyst with Market Risk Analytics and Modelling Course – Enrol Now.

3 Stages of a Reliable Data Science Solution to Attack Business Problems

Today, businesses are in a rat race to derive relevant intuition and make best use of their data. Several notable organizations are skimming with cutting edge data science terms and resolving intricate problems (some being more successful than others).


3 Stages of a Reliable Data Science Solution to Attack Business Problems


However, the crux lies in determining the present stage of data science your organization has embraced, followed by ascertainment of the desired level of data science.

Continue reading “3 Stages of a Reliable Data Science Solution to Attack Business Problems”

Call us to know more